. 2022 Jun 13;13(6):1057.
doi: 10.3390/genes13061057.

Tissue-Specific and Time-Dependent Expressions of PC4s in Bay Scallop (Argopecten irradians irradians) Reveal Function Allocation in Thermal Response

Affiliations

Tissue-Specific and Time-Dependent Expressions of PC4s in Bay Scallop (Argopecten irradians irradians) Reveal Function Allocation in Thermal Response

Ancheng Liu et al. Genes (Basel). .

Abstract

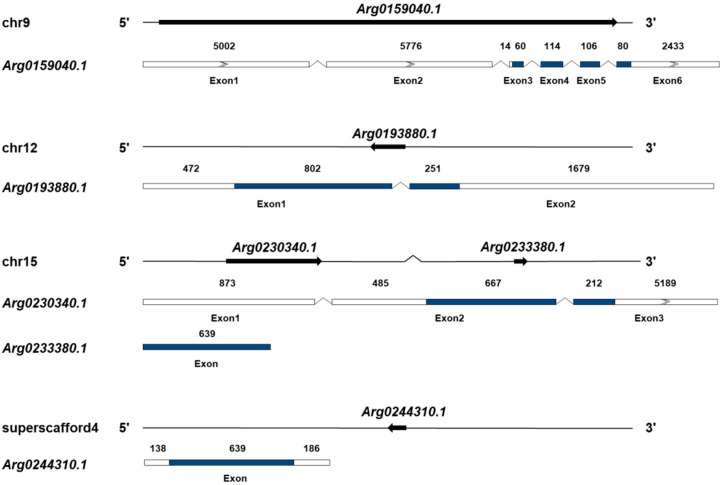
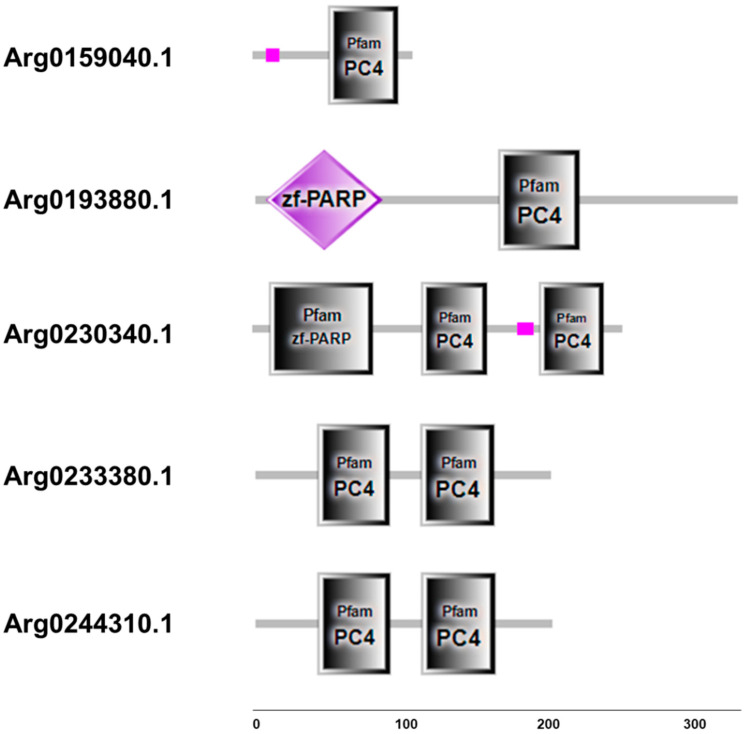
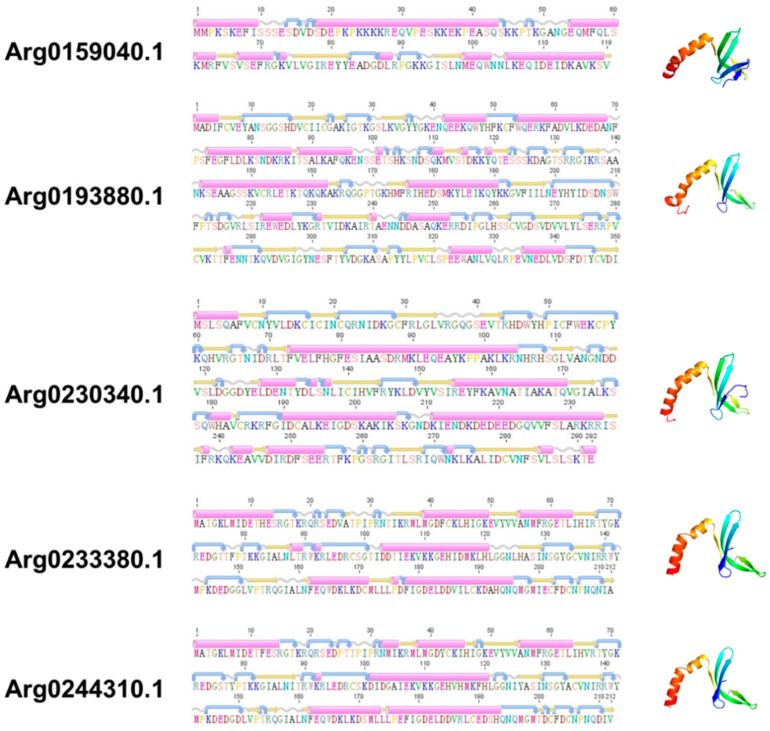
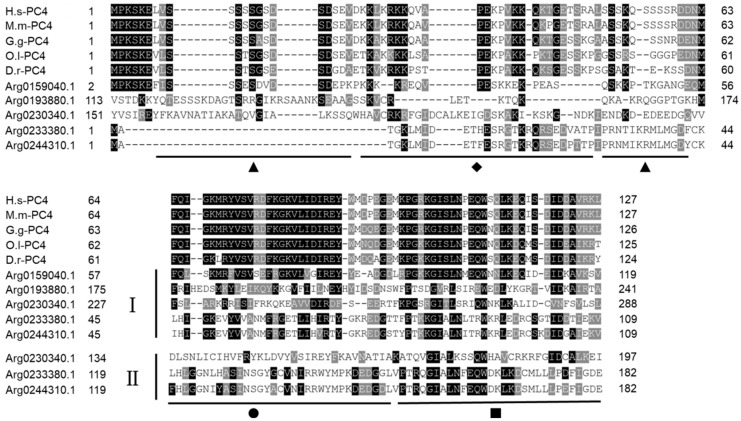
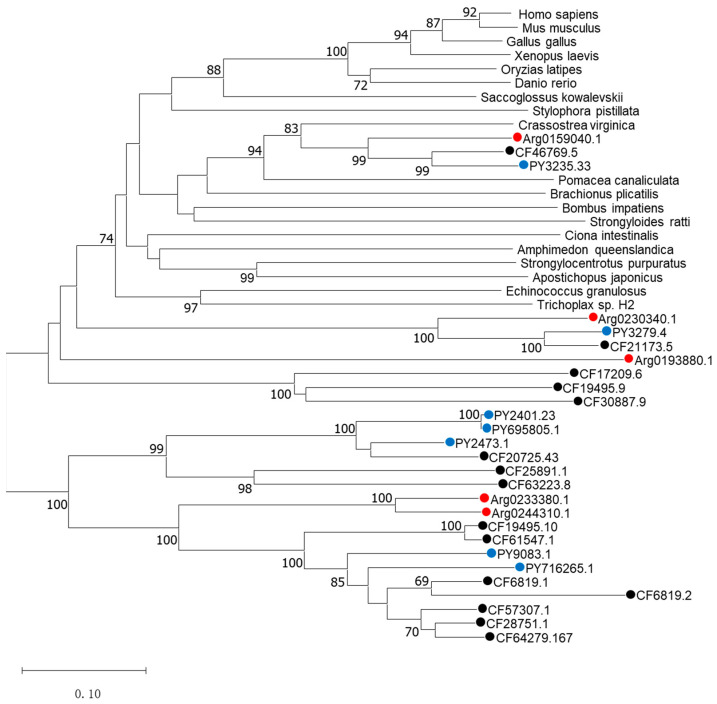
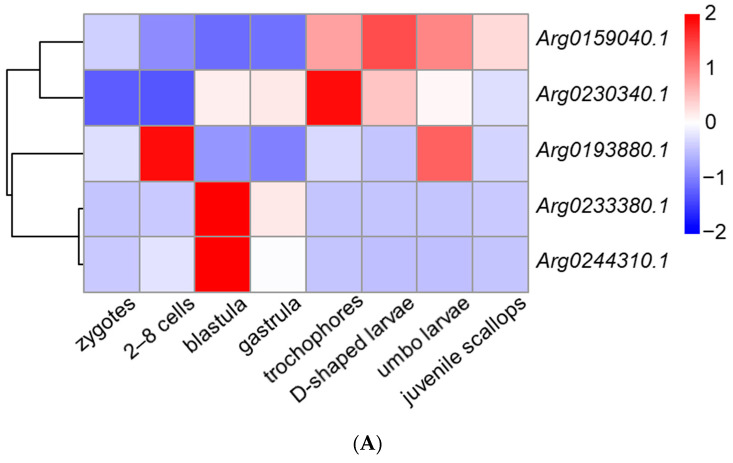
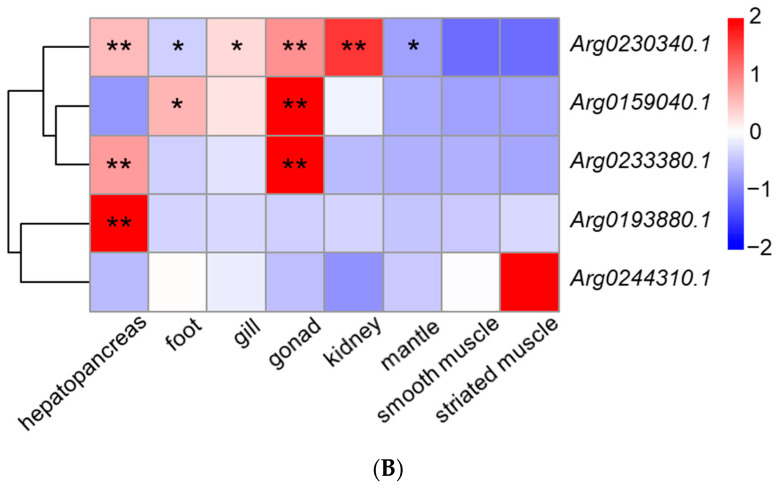
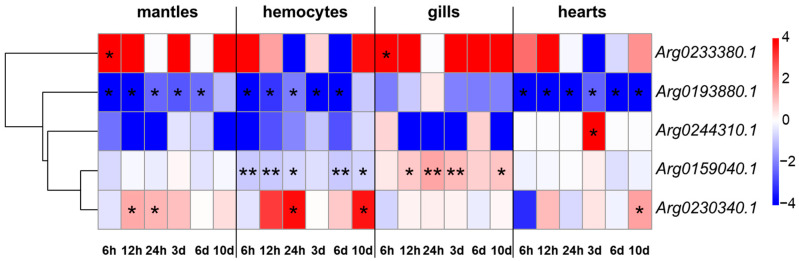
Transcriptional coactivator p15 (PC4) encodes a structurally conserved but functionally diverse protein that plays crucial roles in RNAP-II-mediated transcription, DNA replication and damage repair. Although structures and functions of PC4 have been reported in most vertebrates and some invertebrates, the PC4 genes were less systematically identified and characterized in the bay scallop Argopecten irradians irradians. In this study, five PC4 genes (AiPC4s) were successfully identified in bay scallops via whole-genome scanning through in silico analysis. Protein structure and phylogenetic analyses of AiPC4s were conducted to determine the identities and evolutionary relationships of these genes. Expression levels of AiPC4s were assessed in embryos/larvae at all developmental stages, in healthy adult tissues and in different tissues (mantles, gills, hemocytes and hearts) being processed under 32 °C stress with different time durations (0 h, 6 h, 12 h, 24 h, 3 d, 6 d and 10 d). Spatiotemporal expression profiles of AiPC4s suggested the functional roles of the genes in embryos/larvae at all developmental stages and in healthy adult tissues in bay scallop. Expression regulations (up- and down-) of AiPC4s under high-temperature stress displayed both tissue-specific and time-dependent patterns with function allocations, revealing that AiPC4s performed differentiated functions in response to thermal stress. This work provides clues of molecular function allocation of PC4 in scallops in response to thermal stress and helps in illustrating how marine bivalves resist elevated seawater temperature.

Keywords: Argopecten irradians irradians; expression regulation; function allocation; thermal tolerance; transcriptional coactivator p15.


Conflict of interest statement

The authors declare that the research was conducted in the absence of any commercial or financial relationships that could be construed as a potential conflict of interest.

Figures

Figure 1
Figure 1
Genomic structure of AiPC4 genes. The genomic structures of AiPC4s were determined by mapping cDNA sequences to genomic DNA sequences. The five AiPC4s are distributed into three chromosomes and one scaffold. The arrows on the lines indicate the genes located in the scaffolds. Exons in the ORF are displayed as colored boxes, 5′ and 3′ UTRs are represented by uncolored boxes, and introns are represented by broken lines. The lengths of the 5′ and 3′ UTRs and exons are relative to the cDNA sequence’s length. The number above each exon presents the exon length (bp).
Figure 2
Figure 2
Structure and corresponding predicted protein domains of AiPC4s. Protein domain structure of AiPC4s was predicted by SMART analysis. Low-complexity region is presented in pink. PC4 domains are shown in grey boxes. zf-PARP domains are shown in grey boxes and purple diamond. Protein domains are shown relative to the length of the position in the amino acid sequences.
Figure 3
Figure 3
The secondary and tertiary structures of AiPC4s. The pink cylinders denote α helixes, the orange straight arrows indicate β strands, the wavy lines indicate coils, and the curved arrows indicate turns.
Figure 4
Figure 4
Multiple sequence alignment of AiPC4s from H. sapiens (H.s-PC4), M. musculus (M.m-PC4), G. gallus (G.g-PC4), O. latipes (O.l-PC4) and D. rerio (D.r-PC4) downloaded from NCBI. Amino acid residues that are conserved in at least 70% sequences can be stained. Conserved amino acid residues are shaded in black. The gray-shaded regions represent similar amino acid residues. Gaps are represented by dashes to improve the alignment. The ▲ represents the serine-rich region, ◆ represents the lysine-rich region, ● represents the ssDNA-binding region and ■ represents the dimerization region. I and II represent the first and the second PC4 domain in AiPC4s, respectively. Accession numbers of other species’ PC4s are listed in Table S1.
Figure 5
Figure 5
The phylogenetic tree was constructed based on the protein sequences of AiPC4s and PC4s from other species. Numbers at the tree nodes indicate the bootstrap values from 1500 replicates. AiPC4s and PC4s from C. farreri and P. yessoensis are represented by red, black and blue circles, respectively. Accession numbers of other species’ PC4s are listed in the Table S1.
Figure 6
Figure 6
The expression profiles of AiPC4s from embryos/larvae at eight developmental stages and eight kinds of adult tissues have been laterally homogenized. (A) Relative expression levels of AiPC4s at different embryonic and larval stages. (B) Relative expression levels of AiPC4s in healthy adult tissues. Differently colored boxes highlight different expression patterns. Significant (p < 0.05) and extremely significant (p < 0.01) difference are indicated through “*” and “**”, respectively.
Figure 6
Figure 6
The expression profiles of AiPC4s from embryos/larvae at eight developmental stages and eight kinds of adult tissues have been laterally homogenized. (A) Relative expression levels of AiPC4s at different embryonic and larval stages. (B) Relative expression levels of AiPC4s in healthy adult tissues. Differently colored boxes highlight different expression patterns. Significant (p < 0.05) and extremely significant (p < 0.01) difference are indicated through “*” and “**”, respectively.
Figure 7
Figure 7
Heat map of AiPC4 expression patterns of bay scallop tissues (mantles, hemocytes, gills and hearts) in response to high-temperature stimulation (32 °C) along different time points based on log2(TPM values). Differently colored boxes highlight different expression patterns. Significant (p < 0.05) and extremely significant (p < 0.01) difference are indicated through “*” and “**”, respectively.

References

    1. Masson-Delmotte V., Zhai P., Chen Y., Goldfarb L., Gomis M.I., Matthews J.B.R., Berger S., Huang M., Yelekçi O., Yu R., et al. Climate Change 2021: The Physical Science Basis. Contribution of Working Group I to the Sixth Assessment Report of the Intergovernmental Panel on Climate Change. IPCC; Geneva, Switzerland: 2021. Summary for Policymakers.
    1. Wernberg T., Russell B.D., Thomsen M.S., Gurgel C.F.D., Bradshaw C.J.A., Poloczanska E.S., Connell S.D. Seaweed communities in retreat from ocean warming. Curr. Biol. 2011;21:1828–1832. doi: 10.1016/j.cub.2011.09.028. - DOI - PubMed
    1. Richardson A.J., Schoeman D.S. Climate impact on plankton ecosystems in the Northeast Atlantic. Science. 2004;305:1609–1612. doi: 10.1126/science.1100958. - DOI - PubMed
    1. Hoegh-Guldberg O., Mumby P.J., Hooten A.J., Steneck R.S., Greenfield P., Gomez E., Harvell C.D., Sale P.F., Edwards A.J., Caldeira K., et al. Coral reefs under rapid climate change and ocean acidification. Science. 2007;318:1737–1742. doi: 10.1126/science.1152509. - DOI - PubMed
    1. Graham N.A.J., McClanahan T.R., MacNeil M.A., Wilson S.K., Polunin N.V.C., Jennings S., Chabanet P., Clark S., Spalding M.D., Letourneur Y., et al. Climate warming, marine protected areas and the ocean-scale integrity of coral reef ecosystems. PLoS ONE. 2008;3:e3039. doi: 10.1371/journal.pone.0003039. - DOI - PMC - PubMed

Publication types

LinkOut - more resources