. 2022 Jun 18;13(6):1087.
doi: 10.3390/genes13061087.

Characterization of Immune-Based Molecular Subtypes and Prognostic Model in Prostate Adenocarcinoma

Affiliations

Characterization of Immune-Based Molecular Subtypes and Prognostic Model in Prostate Adenocarcinoma

Li Guo et al. Genes (Basel). .

Abstract

Prostate adenocarcinoma (PRAD), also named prostate cancer, the most common visceral malignancy, is diagnosed in male individuals. Herein, in order to obtain immune-based subtypes, we performed an integrative analysis to characterize molecular subtypes based on immune-related genes, and further discuss the potential features and differences between identified subtypes. Simultaneously, we also construct an immune-based risk model to assess cancer prognosis. Our findings showed that the two subtypes, C1 and C2, could be characterized, and the two subtypes showed different characteristics that could clearly describe the heterogeneity of immune microenvironments. The C2 subtype presented a better survival rate than that in the C1 subtype. Further, we constructed an immune-based prognostic model based on four screened abnormally expressed genes, and they were selected as predictors of the robust prognostic model (AUC = 0.968). Our studies provide reference for characterization of molecular subtypes and immunotherapeutic agents against prostate cancer, and the developed robust and useful immune-based prognostic model can contribute to cancer prognosis and provide reference for the individualized treatment plan and health resource utilization. These findings further promote the development and application of precision medicine in prostate cancer.

Keywords: immune-based; molecular subtypes; prognostic model; prostate adenocarcinoma (PRAD).


Conflict of interest statement

The authors declare no conflict of interest.

Figures

Figure 1
Figure 1
Identifying immune-based molecular subtypes in prostate cancer. (A). Distributions of ssGSEA scores are presented across different gene sets from 28 immune cells, and the total median value is highlighted (0.6579). The p value is estimated using a trend test. (B). The consensus score matrix for PRAD samples (k = 2) indicates that the two clusters can be divided. (C). The item-consensus analysis shows that k = 2 is an optimal selection. (D). Cumulative distribution function (CDF) curve of the consistency score shows that k = 2 is an optimal selection based on different subtype numbers (k = 2–6). Delta area plot of the relative change in area under CDF curve is also presented. (E). The two clusters can be distinguished based on ssGSEA scores using principal component analysis (PCA) of all samples. Each point indicates a patient, and different colors indicate the relevant subtypes. (F). A heatmap of immune characteristics based on ssGSEA scores shows the whole distributions in the two identified subtypes.
Figure 2
Figure 2
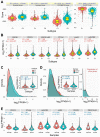
The distributions of immune-related features and genes between the two subtypes. (A). The distributions of immune-related features between the two subtypes. The fold change and p values are also presented for each feature. (B). Differential expression patterns of several immune checkpoint genes between the two subtypes. (C). The whole expression distributions of immune checkpoint genes between the two subtypes, and the fold change and p value are also presented. (D). The whole expression distributions of immune checkpoint genes between tumor and normal samples, and the fold change and p value are also presented. The distribution on the right indicates the expression distribution of other genes in PRAD, and the median value is 2.99 EUR. (E). The detailed expression patterns of immune checkpoint genes in PRAD, and the fold change and p value are also presented.
Figure 3
Figure 3
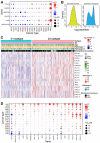
Pan-cancer expression analysis of the immune-related genes. (A). A pan-cancer expression analysis of immune checkpoint genes indicates diverse expression patterns across cancers. (B). The expression distributions of six immune checkpoint genes and other genes demonstrate the similar expression levels. The red word “PRAD” in Figure 3B is the main cancer type in this study. (C). A heatmap shows expression distributions of the 28 immune gene sets between the two subtypes. (D). A pan-cancer expression analysis of related immune genes in (C) shows diverse expression patterns across cancers.
Figure 4
Figure 4
Drug response analysis between the two screened subtypes in PRAD. (A). The distributions of the IC50 values between the two subtypes, and the median values are also presented. (B). The detailed distributions of the IC50 values between the two subtypes (p < 2.2 × 10⁻¹⁶ is estimated using the trend test). (C). Several drugs show significant differences of IC50 values between the two subtypes. (D). Survival analysis shows distinct survival outcomes between the two subtypes. (E). Gene set enrichment analysis (GSEA) of the dysregulated genes in the C2 compared with those in the C1 subtype indicates significantly enriched several biological pathways.
Figure 5
Figure 5
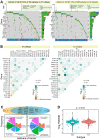
Somatic mutation landscapes of the two subtypes. (A). Somatic mutation landscapes of the two subtypes based on the top 20 genes with higher mutation frequencies, indicating the differences between the two subtypes. (B). Heatmaps show somatic interactions between the top 20 genes. (C). The gene distributions of the top 20 genes between the two subtypes and their potential contributions in hallmark of cancer. (D). The significant difference of the tumor mutational burden can be found between the two subtypes.
Figure 6
Figure 6
Four immune-related dysregulated genes are finally screened. (A). A graph presents distributions of hazard ratios, and corresponding coefficients for four selected genes are also presented. (B). AMH is significantly up-regulated, while other genes are significantly down-regulated in tumor samples. The detailed log2FC and p values are also presented. (C). Distributions of risk scores and survival times in patients show that all dead patients are clustered together. (D). Distinct survival difference can be found between high risk and low risk groups, and the ROC curve shows better performance at each cutoff point. (E). A graph presents distributions of hazard ratios, and corresponding coefficients for IRS and other factors are also presented. (F). A pan-cancer expression analysis of four screened key genes shows dynamic expression across diverse tissues. The relative expression distributions based on baseMean value estimated by DESeq2 algorithm are presented, and expression distributions of other genes are also presented. The expression median values are highlighted using a red dotted line. The expression distributions imply a higher expression trend of the four crucial genes compared to other genes.
Figure 7
Figure 7
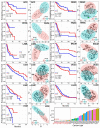
A pan-cancer analysis shows the two relatively independent clusters and potential prognostic values in 11 cancer types. The p values of survival analysis are also presented, and 11 cancers are highlighted.

References

    1. Rawla P. Epidemiology of Prostate Cancer. World J. Oncol. 2019;10:63–89. doi: 10.14740/wjon1191. - DOI - PMC - PubMed
    1. Ferlay J., Soerjomataram I., Dikshit R., Eser S., Mathers C., Rebelo M., Parkin D.M., Forman D., Bray F. Cancer incidence and mortality worldwide: Sources, methods and major patterns in GLOBOCAN 2012. Int. J. Cancer. 2015;136:E359–E386. doi: 10.1002/ijc.29210. - DOI - PubMed
    1. Ferlay J., Shin H.-R., Bray F., Forman D., Mathers C., Parkin D.M. Estimates of worldwide burden of cancer in 2008: GLOBOCAN 2008. Int. J. Cancer. 2010;127:2893–2917. doi: 10.1002/ijc.25516. - DOI - PubMed
    1. Barbosa F.G., Queiroz M.A., Nunes R.F., Viana P.C.C., Marin J.F.G., Cerri G.G., Buchpiguel C.A. Revisiting Prostate Cancer Recurrence with PSMA PET: Atlas of Typical and Atypical Patterns of Spread. RadioGraphics. 2019;39:186–212. doi: 10.1148/rg.2019180079. - DOI - PubMed
    1. Gandaglia G., Abdollah F., Schiffmann J., Trudeau V., Shariat S.F., Kim S.P., Perrotte P., Montorsi F., Briganti A., Trinh Q.-D., et al. Distribution of metastatic sites in patients with prostate cancer: A population-based analysis. Prostate. 2013;74:210–216. doi: 10.1002/pros.22742. - DOI - PubMed

Publication types