

Polyphenols and Polysaccharides from Morus alba L. Fruit Attenuate High-Fat Diet-Induced Metabolic Syndrome Modifying the Gut Microbiota and Metabolite Profile
- PMID: 35742014
- PMCID: PMC9223293
- DOI: 10.3390/foods11121818
Polyphenols and Polysaccharides from Morus alba L. Fruit Attenuate High-Fat Diet-Induced Metabolic Syndrome Modifying the Gut Microbiota and Metabolite Profile
Abstract
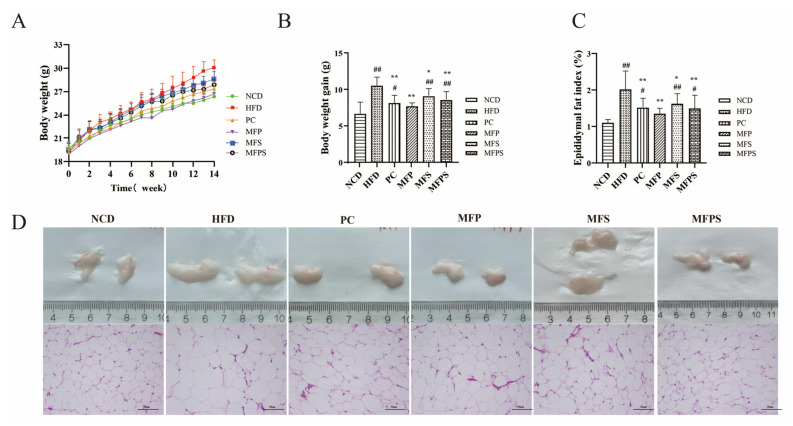
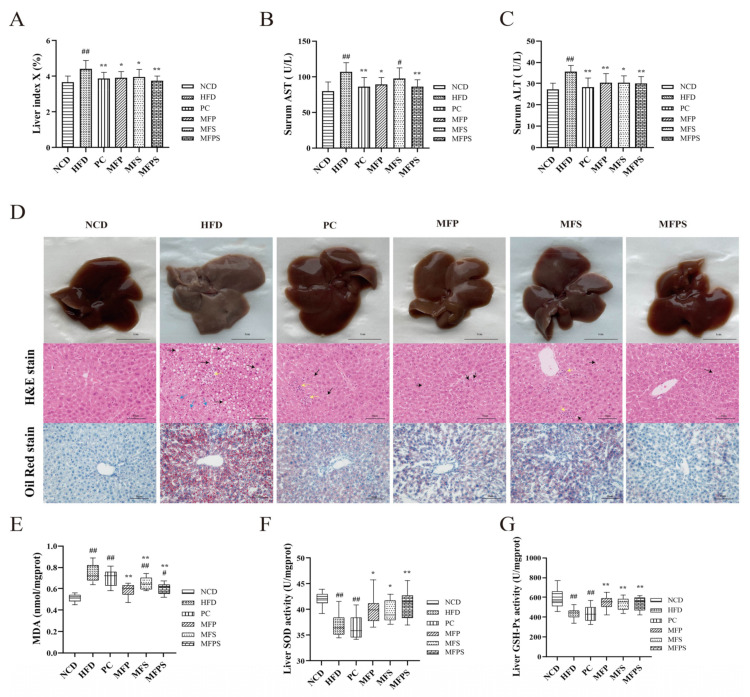
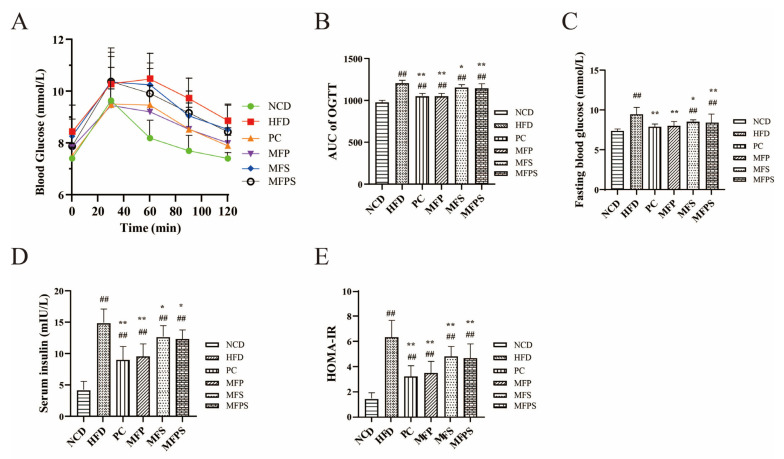
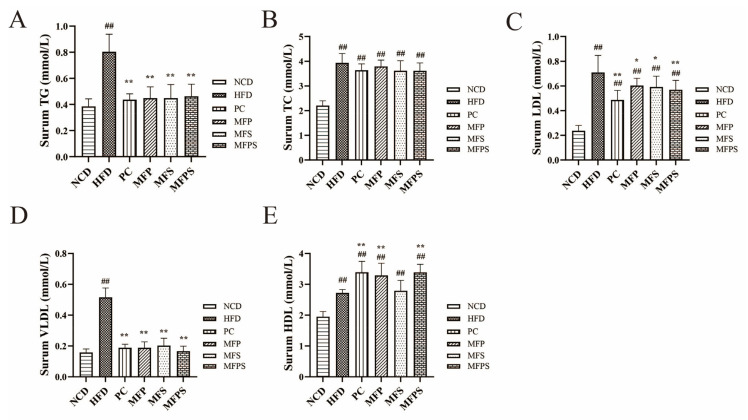
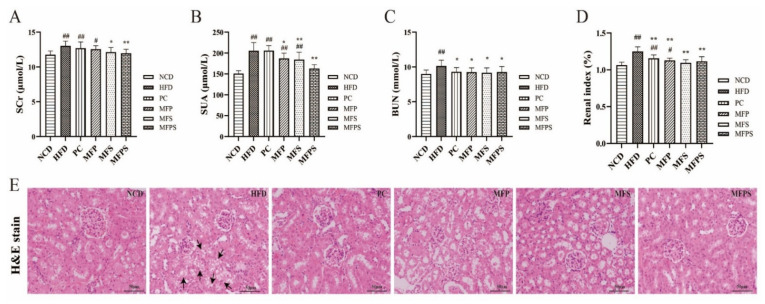
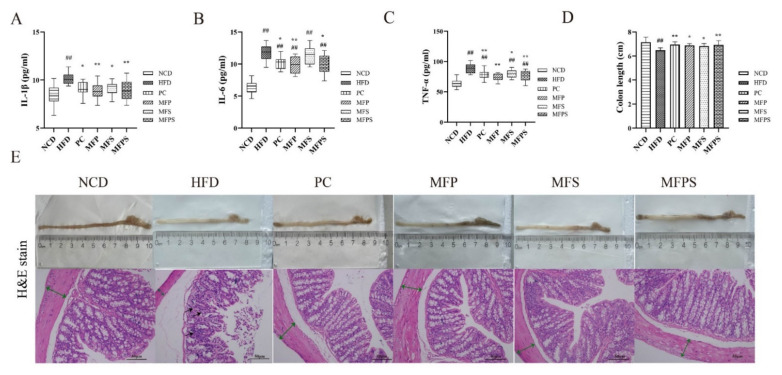
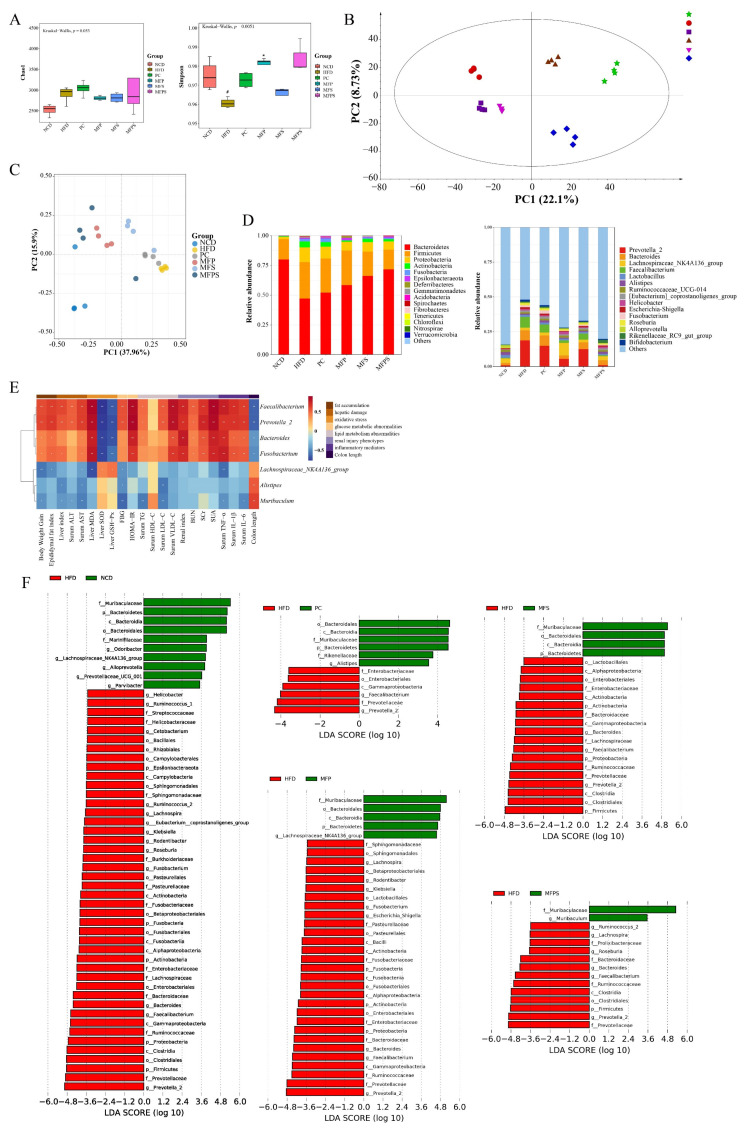
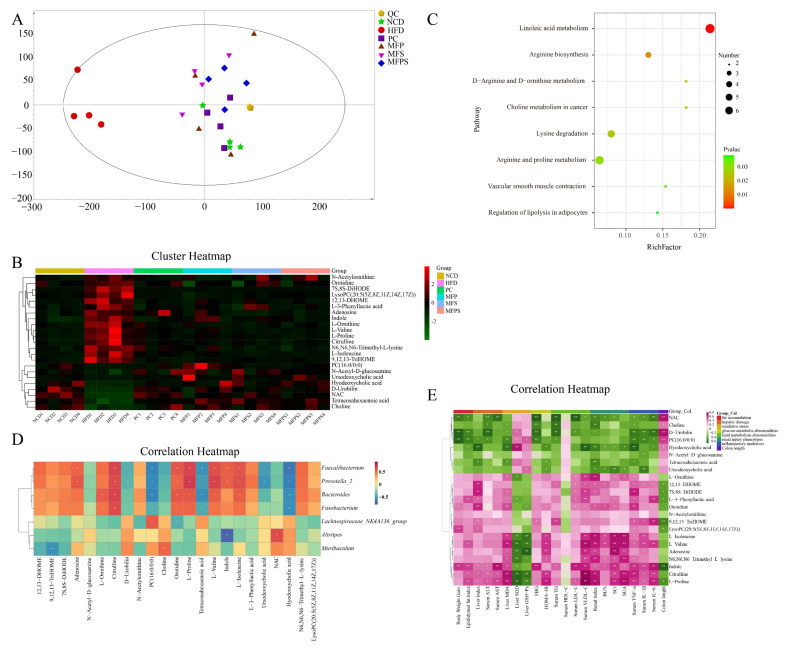
Morus alba L. fruit, a medicinal and edible fruit in East Asia, showed potential health-promoting effects against metabolic syndrome (MetS). However, both the protective effects and mechanisms of different fractions extracted from Morus alba L. fruit against MetS remain unclear. Additionally, the gut microbiota and its metabolites are regarded as key factors in the development of MetS. This study aimed to investigate the potential role of polyphenols and polysaccharides derived from Morus alba L. fruit against MetS in high-fat diet (HFD)-fed mice, individually and in combination, focusing on remodeling effects on gut microbiota and metabolite profiles. In the study, polyphenols and polysaccharides derived from Morus alba L. fruit improved the traditional pharmacodynamic parameters of MetS, including reductions in body weight (BW) and fat accumulation, improvement in insulin resistance, regulation of dyslipidemia, prevention of pathological changes in liver, kidney and proximal colon tissue, and suppressive actions against oxidative stress. In particular, the group treated with polyphenols and polysaccharides in combination showed better efficacy. The relative abundance of beneficial bacterial genera Muribaculum and Lachnospiraceae_NK4A136_group were increased to various degrees, while opportunistic pathogens such as Prevotella_2, Bacteroides, Faecalibacterium and Fusobacterium were markedly decreased after treatments. Moreover, fecal metabolite profiles revealed 23 differential metabolites related to treatments with polyphenols and polysaccharides derived from Morus alba L. fruit, individually and in combination. Altogether, these results demonstrated that polyphenols and polysaccharides derived from Morus alba L. fruit attenuated MetS in HFD-fed mice, and improved the gut microbiota composition and fecal metabolite profiles.
Keywords: Morus alba L. fruit; gut microbiota; metabolic syndrome; polyphenols; polysaccharides; untargeted fecal metabolomics.
Conflict of interest statement
The authors declare no conflict of interest.
Figures
Similar articles
-
Gut microbiota from Mori fructus (Morus alba L.) polyphenols and polysaccharides-dosed mice activates the PPARα/PGC-1α signaling pathway to mitigate HFD-induced metabolic syndrome in mice.Sci Rep. 2025 Aug 1;15(1):28137. doi: 10.1038/s41598-025-13715-8. Sci Rep. 2025. PMID: 40750814 Free PMC article.
-
Improvement on metabolic syndrome in high fat diet-induced obese mice through modulation of gut microbiota by sangguayin decoction.J Ethnopharmacol. 2020 Jan 10;246:112225. doi: 10.1016/j.jep.2019.112225. Epub 2019 Sep 8. J Ethnopharmacol. 2020. PMID: 31509781
-
Pomegranate fruit pulp polyphenols reduce diet-induced obesity with modulation of gut microbiota in mice.J Sci Food Agric. 2022 Mar 30;102(5):1968-1977. doi: 10.1002/jsfa.11535. Epub 2021 Sep 24. J Sci Food Agric. 2022. PMID: 34514612
-
Clinical potential and mechanistic insights of mulberry (Morus alba L.) leaves in managing type 2 diabetes mellitus: Focusing on gut microbiota, inflammation, and metabolism.J Ethnopharmacol. 2023 Apr 24;306:116143. doi: 10.1016/j.jep.2023.116143. Epub 2023 Jan 9. J Ethnopharmacol. 2023. PMID: 36632855 Review.
-
Structures, bioactivities and future prospective of polysaccharides from Morus alba (white mulberry): A review.Food Chem. 2018 Apr 15;245:899-910. doi: 10.1016/j.foodchem.2017.11.084. Epub 2017 Nov 23. Food Chem. 2018. PMID: 29287458 Review.
Cited by
-
Prokinetic Activity of Mulberry Fruit, Morus alba L.Nutrients. 2023 Apr 14;15(8):1889. doi: 10.3390/nu15081889. Nutrients. 2023. PMID: 37111108 Free PMC article.
-
Effect of vacuum freeze drying and hot air drying on dried mulberry fruit quality.PLoS One. 2023 Jun 23;18(6):e0283303. doi: 10.1371/journal.pone.0283303. eCollection 2023. PLoS One. 2023. PMID: 37352305 Free PMC article.
-
Metabolomics and nutrient intake reveal metabolite-nutrient interactions in metabolic syndrome: insights from the Korean Genome and Epidemiology Study.Nutr J. 2025 Aug 19;24(1):128. doi: 10.1186/s12937-025-01189-3. Nutr J. 2025. PMID: 40830960 Free PMC article.
-
Morus alba: natural and valuable effects in weight loss management.Front Clin Diabetes Healthc. 2024 Oct 25;5:1395688. doi: 10.3389/fcdhc.2024.1395688. eCollection 2024. Front Clin Diabetes Healthc. 2024. PMID: 39544693 Free PMC article. Review.
-
Anti-Obesity Effects of the Larval Powder of Steamed and Lyophilized Mature Silkworms in a Newly Designed Adult Mouse Model.Foods. 2023 Sep 28;12(19):3613. doi: 10.3390/foods12193613. Foods. 2023. PMID: 37835266 Free PMC article.
References
-
- Ma H., Hu Y., Zhang B., Shao Z., Roura E., Wang S. Tea polyphenol-gut microbiota interactions: Hints on improving the metabolic syndrome in a multi-element and multi-target manner. Food Sci. Hum. Wellness. 2022;11:11–21. doi: 10.1016/j.fshw.2021.07.002. - DOI
Grants and funding
LinkOut - more resources
Full Text Sources
Medical
Miscellaneous
