. 2022 Jun 7;23(12):6384.
doi: 10.3390/ijms23126384.

Lowering n-6/ n-3 Ratio as an Important Dietary Intervention to Prevent LPS-Inducible Dyslipidemia and Hepatic Abnormalities in ob/ob Mice

Affiliations

Lowering n-6/ n-3 Ratio as an Important Dietary Intervention to Prevent LPS-Inducible Dyslipidemia and Hepatic Abnormalities in ob/ob Mice

Seohyun Park et al. Int J Mol Sci. .

Abstract

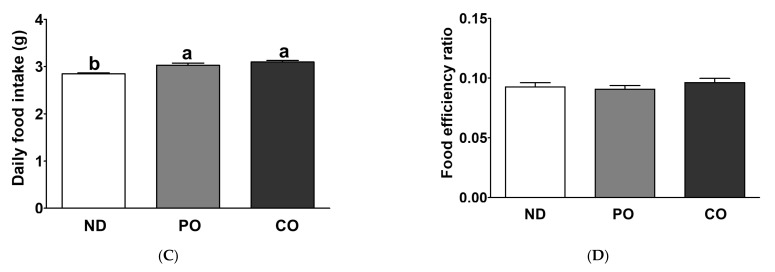
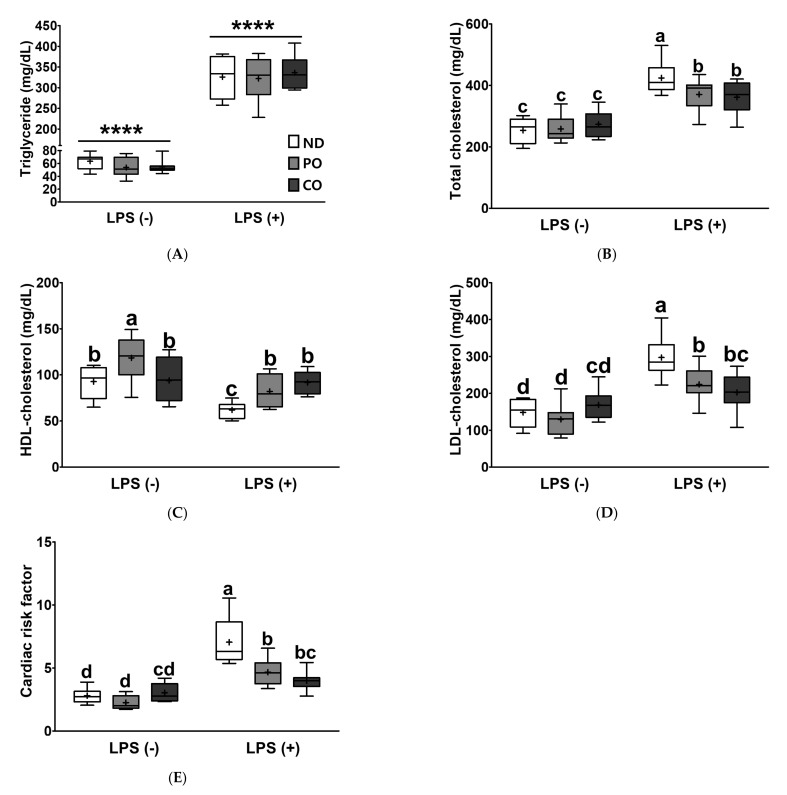
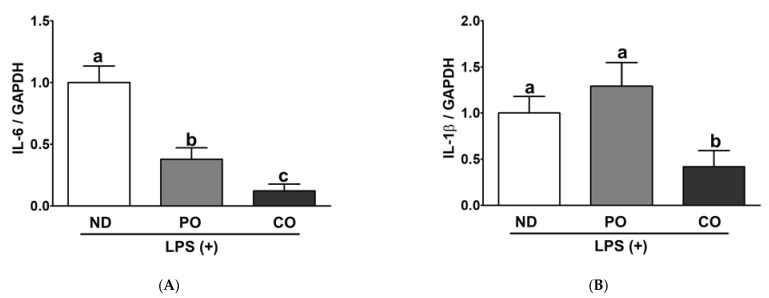
Obesity is closely associated with low-grade chronic and systemic inflammation and dyslipidemia, and the consumption of omega-3 polyunsaturated fatty acids (n-3 PUFAs) may modulate obesity-related disorders, such as inflammation and dyslipidemia. An emerging research question is to understand the dietary intervention strategy that is more important regarding n-3 PUFA consumption: (1) a lower ratio of n-6/n-3 PUFAs or (2) a higher amount of n-3 PUFAs consumption. To understand the desirable dietary intervention method of n-3 PUFAs consumption, we replaced lard from the experimental diets with either perilla oil (PO) or corn oil (CO) to have identical n-3 amounts in the experimental diets. PO had a lower n-6/n-3 ratio, whereas CO contained higher amounts of PUFAs; it inherently contained relatively lower n-3 but higher n-6 PUFAs than PO. After the 12-week dietary intervention in ob/ob mice, dyslipidemia was observed in the normal chow and CO-fed ob/ob mice; however, PO feeding increased the high density lipoprotein-cholesterol (HDL-C) level; further, not only did the HDL-C level increase, the low density lipoprotein-cholesterol (LDL-C) and triglyceride (TG) levels also decreased significantly after lipopolysaccharide (LPS) injection. Consequently, extra TG accumulated in the liver and white adipose tissue (WAT) of normal chow- or CO-fed ob/ob mice after LPS injection; however, PO consumption decreased serum TG accumulation in the liver and WAT. PUFAs replacement attenuated systemic inflammation induced by LPS injection by increasing anti-inflammatory cytokines but inhibiting pro-inflammatory cytokine production in the serum and WAT. PO further decreased hepatic inflammation and fibrosis in comparison with the ND and CO. Hepatic functional biomarkers (aspartate aminotransferase (AST) and alanine transaminase (ALT) levels) were also remarkably decreased in the PO group. In LPS-challenged ob/ob mice, PO and CO decreased adipocyte size and adipokine secretion, with a reduction in phosphorylation of MAPKs compared to the ND group. In addition, LPS-inducible endoplasmic reticulum (ER) and oxidative stress decreased with consumption of PUFAs. Taken together, PUFAs from PO and CO play a role in regulating obesity-related disorders. Moreover, PO, which possesses a lower ratio of n-6/n-3 PUFAs, remarkably alleviated metabolic dysfunction in LPS-induced ob/ob mice. Therefore, an interventional trial considering the ratio of n-6/n-3 PUFAs may be desirable for modulating metabolic complications, such as inflammatory responses and ER stress in the circulation, liver, and/or WAT.

Keywords: cardiac risk factor; dyslipidemia; inflammation; obesity; perilla oil and corn oil; polyunsaturated fatty acids.


Conflict of interest statement

The authors declare no conflict of interest.

Figures

Figure 1
Figure 1
Partial replacement of dietary fat with PO or CO on body weight change, food intake, energy intake and food efficiency ratio in ob/ob mice. Mice were fed either an ND or an ND partially replaced with PO or CO for 12 weeks (n = 16 per group). (A) Body weight changes; (B) body weight gain (final BW—initial BW); (C) daily food intake; (D) food efficiency ratio. Values are presented as the mean ± standard deviation. Data were analyzed using one-way ANOVA followed by Tukey’s post hoc test. *, ** and *** denotes a significant main effect of diet at p < 0.05, p < 0.01 and p < 0.001, respectively. Labeled means without a common letter differ (p < 0.05). ND, normal diet; PO, perilla oil replacement; CO, corn oil replacement; BW, body weight.
Figure 1
Figure 1
Partial replacement of dietary fat with PO or CO on body weight change, food intake, energy intake and food efficiency ratio in ob/ob mice. Mice were fed either an ND or an ND partially replaced with PO or CO for 12 weeks (n = 16 per group). (A) Body weight changes; (B) body weight gain (final BW—initial BW); (C) daily food intake; (D) food efficiency ratio. Values are presented as the mean ± standard deviation. Data were analyzed using one-way ANOVA followed by Tukey’s post hoc test. *, ** and *** denotes a significant main effect of diet at p < 0.05, p < 0.01 and p < 0.001, respectively. Labeled means without a common letter differ (p < 0.05). ND, normal diet; PO, perilla oil replacement; CO, corn oil replacement; BW, body weight.
Figure 2
Figure 2
Partial replacement of dietary fat with PO or CO on the fasting glucose and insulin levels in ob/ob mice. Mice were fed either an ND or an ND partially replaced with PO or CO for 12 weeks (n = 16 per group). Mice were injected glucose by oral gavage and blood glucose levels were measured at 0, 15, 30, 60 and 120 min after glucose injection; oral glucose tolerance test (OGTT) (1 g/kg body weight). Insulin tolerance test (ITT) was performed after feeding the experimental diet and blood glucose levels were measured at 15, 30, 60, 120 min after insulin administration (1 U/kg body weight). (A) OGTT at 11 weeks; (B) area under the curve (AUC) of OGTT; (C) ITT at 11 weeks; (D) AUC of ITT. Values are presented as the mean ± standard deviation. Data were analyzed using one-way ANOVA followed by Tukey’s post hoc test.
Figure 2
Figure 2
Partial replacement of dietary fat with PO or CO on the fasting glucose and insulin levels in ob/ob mice. Mice were fed either an ND or an ND partially replaced with PO or CO for 12 weeks (n = 16 per group). Mice were injected glucose by oral gavage and blood glucose levels were measured at 0, 15, 30, 60 and 120 min after glucose injection; oral glucose tolerance test (OGTT) (1 g/kg body weight). Insulin tolerance test (ITT) was performed after feeding the experimental diet and blood glucose levels were measured at 15, 30, 60, 120 min after insulin administration (1 U/kg body weight). (A) OGTT at 11 weeks; (B) area under the curve (AUC) of OGTT; (C) ITT at 11 weeks; (D) AUC of ITT. Values are presented as the mean ± standard deviation. Data were analyzed using one-way ANOVA followed by Tukey’s post hoc test.
Figure 3
Figure 3
Partial replacement of dietary fat with PO or CO and LPS challenge on the liver and adipose tissue weights in ob/ob mice. Mice were fed either an ND or an ND partially replaced with PO or CO for 12 weeks and then treated with PBS or LPS (1 mg/kg) for 24 h (n = 8 per group). (A) Liver weight; (B) white adipose tissue (WAT) weight; (C) epididymal adipose tissue (EAT) weight; (D) mesenteric adipose tissue (MAT) weight; (E) retroperitoneal adipose tissue (RAT) weight; (F) perirenal adipose tissue (PAT) weight. Values are presented as box and whisker plots representing 8 mice per group. Data were analyzed using two-way ANOVA followed by Tukey’s post hoc test (LPS × Diet interaction). LPS, lipopolysaccharide; PBS, phosphate-buffered saline.
Figure 3
Figure 3
Partial replacement of dietary fat with PO or CO and LPS challenge on the liver and adipose tissue weights in ob/ob mice. Mice were fed either an ND or an ND partially replaced with PO or CO for 12 weeks and then treated with PBS or LPS (1 mg/kg) for 24 h (n = 8 per group). (A) Liver weight; (B) white adipose tissue (WAT) weight; (C) epididymal adipose tissue (EAT) weight; (D) mesenteric adipose tissue (MAT) weight; (E) retroperitoneal adipose tissue (RAT) weight; (F) perirenal adipose tissue (PAT) weight. Values are presented as box and whisker plots representing 8 mice per group. Data were analyzed using two-way ANOVA followed by Tukey’s post hoc test (LPS × Diet interaction). LPS, lipopolysaccharide; PBS, phosphate-buffered saline.
Figure 4
Figure 4
Partial replacement of dietary fat with PO or CO and LPS challenge on serum lipid profiles in ob/ob mice. Mice were fed either an ND or an ND partially replaced with PO or CO for 12 weeks and then treated with PBS or LPS (1 mg/kg) for 24 h (n = 8 per group). (A) Triglyceride levels; (B) total cholesterol levels; (C) high density lipoprotein (HDL)-cholesterol levels; (D) low density lipoprotein (LDL)-cholesterol levels; (E) cardiac risk factor (CRF). Values are presented as box and whisker plots representing 8 mice per group. Data were analyzed using two-way ANOVA followed by Tukey’s post hoc test (LPS × Diet interaction). Asterisk indicates a significant main effect for LPS (****p < 0.0001). Labeled means without a common letter differ (p < 0.05).
Figure 5
Figure 5
Partial replacement of dietary fat with PO or CO and LPS challenge on the pro/anti-inflammatory cytokines, chemokine in serum. Mice were fed either an ND or an ND partially replaced with PO or CO for 12 weeks and then treated with PBS or LPS (1 mg/kg) for 24 h (n = 8 per group). (A) Interleukin (IL)-1β levels; (B) tumor necrosis factor (TNF)-α levels; (C) IL-10 levels; (D) C-X-C Motif Chemokine Ligand 1 (CXCL-1) levels. Values are presented as box and whisker plots representing 8 mice per group. Data were analyzed using two-way ANOVA followed by Tukey’s post hoc test (LPS × Diet interaction). Labeled means without a common letter differ (p < 0.05).
Figure 6
Figure 6
Partial replacement of dietary fat with PO or CO and LPS challenge on lipid contents and histology analysis in liver. Mice were fed either an ND or an ND partially replaced with PO or CO for 12 weeks and then treated with LPS (1 mg/kg) for 24 h (n = 8 per group). (A) Hepatic triglyceride (TG) levels; (B) hepatic total cholesterol (TC) levels; (C) H&E staining of liver tissue (bar = 50 μm, 20 × magnification); (D) histological scores of liver tissue. Values are presented as box and whisker plots representing 8 mice per group. Data were analyzed using one-way ANOVA followed by Tukey’s post hoc test. Black arrow represents lipid droplet and red arrow represents lobular inflammation. Labeled means without a common letter differ (p < 0.05).
Figure 6
Figure 6
Partial replacement of dietary fat with PO or CO and LPS challenge on lipid contents and histology analysis in liver. Mice were fed either an ND or an ND partially replaced with PO or CO for 12 weeks and then treated with LPS (1 mg/kg) for 24 h (n = 8 per group). (A) Hepatic triglyceride (TG) levels; (B) hepatic total cholesterol (TC) levels; (C) H&E staining of liver tissue (bar = 50 μm, 20 × magnification); (D) histological scores of liver tissue. Values are presented as box and whisker plots representing 8 mice per group. Data were analyzed using one-way ANOVA followed by Tukey’s post hoc test. Black arrow represents lipid droplet and red arrow represents lobular inflammation. Labeled means without a common letter differ (p < 0.05).
Figure 7
Figure 7
Partial replacement of dietary fat with PO or CO and LPS challenge on hepatic function parameters in serum. Mice were fed either an ND or an ND partially replaced with PO or CO for 12 weeks and then treated with LPS (1 mg/kg) for 24 h (n = 8 per group). (A) Aspartate aminotransferase (AST) activity; (B) alanine aminotransferase (ALT) activity; (C) alkaline phosphatase (ALP) activity. Values are presented as box and whisker plots representing 8 mice per group. Data were analyzed using one-way ANOVA followed by Tukey’s post hoc test. Labeled means without a common letter differ (p < 0.05).
Figure 8
Figure 8
Partial replacement of dietary fat with PO or CO and LPS challenge on lipid contents and histology analysis in EAT. Mice were fed either an ND or an ND partially replaced with PO or CO for 12 weeks and then treated with LPS (1 mg/kg) for 24 h (n = 8 per group). (A) Triglyceride (TG) levels in EAT; (B) total cholesterol (TC) levels in EAT. (C) H&E staining of adipose tissue (bar = 50 μm, 20× magnification); (D) adipocyte area (mm2). Values are presented as box and whisker plots representing 8 mice per group. Data were analyzed using one-way ANOVA followed by Tukey’s post hoc test. Labeled means without a common letter differ (p < 0.05).
Figure 8
Figure 8
Partial replacement of dietary fat with PO or CO and LPS challenge on lipid contents and histology analysis in EAT. Mice were fed either an ND or an ND partially replaced with PO or CO for 12 weeks and then treated with LPS (1 mg/kg) for 24 h (n = 8 per group). (A) Triglyceride (TG) levels in EAT; (B) total cholesterol (TC) levels in EAT. (C) H&E staining of adipose tissue (bar = 50 μm, 20× magnification); (D) adipocyte area (mm2). Values are presented as box and whisker plots representing 8 mice per group. Data were analyzed using one-way ANOVA followed by Tukey’s post hoc test. Labeled means without a common letter differ (p < 0.05).
Figure 9
Figure 9
Partial replacement of dietary fat with PO or CO and LPS challenge on pro/anti-inflammatory cytokines, chemokine in EAT. Mice were fed either an ND or an ND partially replaced with PO or CO for 12 weeks and then treated with LPS (1 mg/kg) for 24 h (n = 8 per group). (A) Interleukin (IL)-1β levels; (B) C-X-C Motif Chemokine Ligand 1 (CXCL-1) levels; (C) IL-10 levels. Values are presented as box and whisker plots representing 8 mice per group. Data were analyzed using one-way ANOVA followed by Tukey’s post hoc test. Labeled means without a common letter differ (p < 0.05).
Figure 10
Figure 10
Partial replacement of dietary fat with PO or CO and LPS challenge on mRNA expression related to inflammation in EAT. Mice were fed either an ND or an ND partially replaced with PO or CO for 12 weeks and then treated with LPS (1 mg/kg) for 24 h (n = 8 per group). (A) Interleukin (IL)-6 levels; (B) IL-1β levels; (C) tumor necrosis factor (TNF)-α levels. The expression of each protein was normalized to a value for glyceraldehyde 3 phosphate dehydrogenase (GAPDH). Relative expression of each gene was quantified by using the 2−ΔΔCT method. Values are presented as the mean ± standard deviation. Data were analyzed using one-way ANOVA followed by Tukey’s post hoc test. Labeled means without a common letter differ (p < 0.05).
Figure 10
Figure 10
Partial replacement of dietary fat with PO or CO and LPS challenge on mRNA expression related to inflammation in EAT. Mice were fed either an ND or an ND partially replaced with PO or CO for 12 weeks and then treated with LPS (1 mg/kg) for 24 h (n = 8 per group). (A) Interleukin (IL)-6 levels; (B) IL-1β levels; (C) tumor necrosis factor (TNF)-α levels. The expression of each protein was normalized to a value for glyceraldehyde 3 phosphate dehydrogenase (GAPDH). Relative expression of each gene was quantified by using the 2−ΔΔCT method. Values are presented as the mean ± standard deviation. Data were analyzed using one-way ANOVA followed by Tukey’s post hoc test. Labeled means without a common letter differ (p < 0.05).
Figure 11
Figure 11
Partial replacement of dietary fat with PO or CO and LPS challenge on the protein expression of inflammatory responses in EAT. Mice were fed either an ND or an ND partially replaced with PO or CO for 12 weeks and then treated with LPS (1 mg/kg) for 24 h (n = 8 per group). (A) Representative Western blot images; (B) phospho-extracellular signal-regulated kinase (p-ERK) levels; (C) phospho-c-Jun N-terminal kinase (p-JNK) levels; (D) binding immunoglobulin protein (BiP) levels; (E) C/EBP homologous protein (CHOP) levels; (F) heme oxygenase 1 (HO-1) levels. The expression of each protein was normalized to a value for β-actin, the internal control of protein content. Values are presented as the mean ± standard deviation. Data were analyzed using one-way ANOVA followed by Tukey’s post hoc test. Labeled means without a common letter differ (p < 0.05).
Figure 11
Figure 11
Partial replacement of dietary fat with PO or CO and LPS challenge on the protein expression of inflammatory responses in EAT. Mice were fed either an ND or an ND partially replaced with PO or CO for 12 weeks and then treated with LPS (1 mg/kg) for 24 h (n = 8 per group). (A) Representative Western blot images; (B) phospho-extracellular signal-regulated kinase (p-ERK) levels; (C) phospho-c-Jun N-terminal kinase (p-JNK) levels; (D) binding immunoglobulin protein (BiP) levels; (E) C/EBP homologous protein (CHOP) levels; (F) heme oxygenase 1 (HO-1) levels. The expression of each protein was normalized to a value for β-actin, the internal control of protein content. Values are presented as the mean ± standard deviation. Data were analyzed using one-way ANOVA followed by Tukey’s post hoc test. Labeled means without a common letter differ (p < 0.05).

Similar articles

Cited by

References

    1. Bhurosy T., Jeewon R. Overweight and obesity epidemic in developing countries: A problem with diet, physical activity, or socioeconomic status? Sci. World J. 2014;2014:964236. doi: 10.1155/2014/964236. - DOI - PMC - PubMed
    1. James P.T., Leach R., Kalamara E., Shayeghi M. The worldwide obesity epidemic. Obes. Res. 2001;9((Suppl. S4)):228S–233S. doi: 10.1038/oby.2001.123. - DOI - PubMed
    1. Agha M., Agha R. The rising prevalence of obesity: Part A: Impact on public health. Int. J. Surg. Oncol. 2017;2:e17. doi: 10.1097/IJ9.0000000000000017. - DOI - PMC - PubMed
    1. Nuttall F.Q. Body Mass Index: Obesity, BMI, and Health: A Critical Review. Nutr. Today. 2015;50:117–128. doi: 10.1097/NT.0000000000000092. - DOI - PMC - PubMed
    1. Bae J.C., Cho N.H., Suh S., Kim J.H., Hur K.Y., Jin S.M., Lee M.K. Cardiovascular disease incidence, mortality and case fatality related to diabetes and metabolic syndrome: A community-based prospective study (Ansung-Ansan cohort 2001-12) J. Diabetes. 2015;7:791–799. doi: 10.1111/1753-0407.12248. - DOI - PubMed

LinkOut - more resources