. 2022 Jun 7;23(12):6399.
doi: 10.3390/ijms23126399.

Neuroprotective Effect of Bcl-2 on Lipopolysaccharide-Induced Neuroinflammation in Cortical Neural Stem Cells

Affiliations

Neuroprotective Effect of Bcl-2 on Lipopolysaccharide-Induced Neuroinflammation in Cortical Neural Stem Cells

Shin-Young Park et al. Int J Mol Sci. .

Abstract

Neuroinflammation is involved in the pathogenesis of neurodegenerative diseases due to increased levels of pro-inflammatory cytokines in the central nervous system (CNS). Chronic neuroinflammation induced by neurotoxic molecules accelerates neuronal damage. B-cell lymphoma 2 (Bcl-2) is generally accepted to be an important anti-apoptotic factor. However, the role of Bcl-2 in neuroprotection against neuroinflammation remains to be determined. The purpose of this study was to investigate the neuroprotective effect of Bcl-2 on lipopolysaccharide (LPS)-induced neuroinflammation in cortical neural stem cells (NSCs). LPS decreased mRNA and protein levels of Tuj-1, a neuron marker, and also suppressed neurite outgrowth, indicating that LPS results in inhibition of neuronal differentiation of NSCs. Furthermore, LPS treatment inhibited Bcl-2 expression during neuronal differentiation; inhibition of neuronal differentiation by LPS was rescued by Bcl-2 overexpression. LPS-induced pro-inflammatory cytokines, including interleukin (IL)-6 and tumor necrosis factor alpha (TNF-α), were decreased by Bcl-2 overexpression. Conversely, Bcl-2 siRNA increased the LPS-induced levels of IL-6 and TNF-α, and decreased neuronal differentiation of NSCs, raising the possibility that Bcl-2 mediates neuronal differentiation by inhibiting the LPS-induced inflammatory response in NSC. These results suggest that Bcl-2 has a neuroprotective effect by inhibiting the LPS-induced inflammatory response in NSCs.

Keywords: B-cell lymphoma 2; lipopolysaccharide; neural stem cells; neuroinflammation; neuronal differentiation.


Conflict of interest statement

The authors declare no conflict of interest.

Figures

Figure 1
Figure 1
Effect of LPS stimulation on neuronal differentiation in NSCs. During the growth of isolated NSCs, bFGF was present (+bFGF, proliferation condition) to prevent differentiation and promote proliferation. In order to induce the neuronal differentiation, bFGF was removed (-bFGF, differentiation condition). (A) Cell viability in LPS-treated NSCs. NSCs were treated with LPS at 10 ng, 100 ng, 500 ng, 1 μg, 2 μg, or 5 μg/mL for 1 day in the absence of bFGF. The cells were collected for analysis for cell viability and performed using the Cell counting Kit-8. Absorbance was measured at 450 nm, and all experiments were performed in triplicate. Cytotoxic activity is expressed as the percentage of cell viability using the formula: cytotoxicity (%) = (1 − A450 of target cells/A450 of control cells) × 100; n = 3. Data are shown as means ± SD. (B,C) NSCs were treated with LPS (1 μg/mL) for 3 days in the absence of bFGF. They were stained with anti-Tuj1 (green) and DAPI (blue). Scale bar: 100 μm. (C) Neurite lengths were measured in randomly selected fields using three independent experiments, with n = 3 per group. Data are shown as means ± SD. * p < 0.05 compared with –bFGF control. (D) The cells were treated with LPS (1 μg/mL) for 12 h in the absence of bFGF. The Tuj1 mRNA level was analyzed using RT-PCR (upper panel) and real time-RT-PCR (graph); n = 3. Data are shown as means ± SD. * p < 0.05 compared with–bFGF control. (E) The cells were treated with LPS (1 μg/mL) for 1 day in the absence of bFGF. Western blotting was performed using anti-Tuj1 or anti-calnexin antibodies to detect the respective protein bands (upper panel). Band intensity (graph) was quantified with Quantity Ones® software. Data are shown as means ± SD. * p < 0.05 compared with –bFGF control. (F) The cells were treated with LPS (1 μg/mL) for 12 h in the absence of bFGF. The mRNA levels of IL-6 and TNF-α were analyzed by real-time RT-PCR; n = 3. Data are shown as means ± SD. * p < 0.05 compared with –bFGF control, for IL-6 and TNF-α, respectively. Statistical significances were assessed by one-way ANOVA with a post hoc Tukey’s test.
Figure 2
Figure 2
Effect of Bcl-2 overexpression on LPS-induced neuronal damage in NSCs. (A,B) NSCs were treated with LPS (1 μg/mL) for 1 day in the absence of bFGF. (A) Western blotting was performed using anti-Tuj1, anti-Bcl-2, or anti-calnexin antibodies to detect the respective protein bands. (B) Band intensity was quantified with Quantity Ones® software. Data are shown as means ± SD. * p < 0.05 compared with –bFGF control. (C,D) MSCV-IRES-EGFP or rBcl-2-MSCV-IRES-EGFP was transfected into the NSCs for 48 h, then the cells were treated with LPS (1 μg/mL) for 1 day in the absence of bFGF. (C) Western blotting was performed using anti-Tuj1, anti-Bcl-2, or anti-calnexin antibodies to detect the respective protein bands. (D) Band intensity was quantified with Quantity Ones® software. Data are shown as means ± SD. * p < 0.05 compared with –bFGF/Vector/LPS control. # p < 0.05 compared with –bFGF/Vector control. (E,F) MSCV-IRES-EGFP or rBcl-2-MSCV-IRES-EGFP was transfected into the NSCs for 48 h, and the cells were treated with LPS (1 μg/mL) for 3 days in the absence of bFGF. The NSCs were stained with anti-Tuj1(green) and DAPI (blue). Scale bar: 100 μm. (F) Neurite lengths were measured in randomly selected fields using three independent experiments; n = 3 per group. Data are shown as means ± SD. * p < 0.05 compared with –bFGF/Vector/LPS control. # p < 0.05 compared with –bFGF/Vector control. Statistical significances were assessed by one-way ANOVA with a post hoc Tukey’s test.
Figure 3
Figure 3
Effect of Bcl-2 overexpression on LPS-induced IL-6 and TNF-α production in NSCs. (A) MSCV-IRES-EGFP or rBcl-2-MSCV-IRES-EGFP was transfected into the NSCs for 48 h, and the cells were treated with LPS (1 μg/mL) for 12 h in the absence of bFGF. The mRNA levels of IL-6 and TNF-α were analyzed by real-time RT-PCR; n = 3. Data are shown as mean ± SD. * p < 0.05 compared with –bFGF/Vector/LPS control, for IL-6 and TNF-α respectively. (B,C) MSCV-IRES-EGFP or rBcl-2-MSCV-IRES-EGFP was transfected into the NSCs for 48 h, and the cells were treated with LPS (1 μg/mL) for 24 h in the absence of bFGF. The levels of IL-6 (B) and TNF-α (C) were measured by ELISA. Data are shown as means ± SD. * p < 0.05 compared with –bFGF/Vector/LPS control. Statistical significances were assessed by one-way ANOVA with a post hoc Tukey’s test.
Figure 4
Figure 4
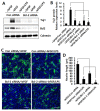
Effect of Bcl-2 depletion on LPS-induced neuronal damage in NSCs. (A,B) Control siRNA or Bcl-2 siRNA was transfected into the NSCs for 72 h, and then the cells were treated with LPS (1 μg/mL) for 1 day in the absence of bFGF. (A) Western blotting was performed using anti-Tuj1, anti-Bcl-2, or anti-calnexin antibodies to detect the respective protein bands. (B) Band intensity was quantified with Quantity Ones® software. Data are shown as means ± SD. * p < 0.05 compared with –bFGF/control siRNA/LPS. # p < 0.05 compared with –bFGF/control siRNA. (C,D) Control siRNA or Bcl-2 siRNA was transfected into the NSCs for 72 h, and then the cells were treated with LPS (1 μg/mL) for 3 days in the absence of bFGF. The NSCs were stained with anti-Tuj1(green) and DAPI (blue). Scale bar: 100 μm. (D) Neurite lengths were measured in randomly selected fields using three independent experiments; n = 3 per group. Data are shown as means ± SD. * p < 0.05 compared with –bFGF/control siRNA/LPS. # p < 0.05 compared with –bFGF/control siRNA. Statistical significances were assessed by one-way ANOVA with a post hoc Tukey’s test.
Figure 5
Figure 5
Effect of Bcl-2 depletion on LPS-induced IL-6 and TNF-α production in NSCs. (A) Control siRNA or Bcl-2 siRNA was transfected into the NSCs for 72 h, and then the cells were treated with LPS (1 μg/mL) for 12 h in the absence of bFGF. The mRNA levels of IL-6 and TNF-α were analyzed by real-time RT-PCR; n = 3. Data are shown as means ± SD. * p < 0.05 compared with –bFGF/control siRNA/LPS, for IL-6 and TNF-α, respectively. (B,C) Control siRNA or Bcl-2 siRNA was transfected into the NSCs for 72 h, and then the cells were treated with LPS (1 μg/mL) for 24 h in the absence of bFGF. The levels of IL-6 (B) and TNF-α (C) were measured by ELISA. Data are shown as means ± SD. * p < 0.05 compared with –bFGF/control siRNA/LPS. (D) The proposed model for Bcl-2-mediated neuronal differentiation in LPS-treated NSCs. The model suggests that Bcl-2 plays a neuroprotective role in LPS-induced neuroinflammation of NSCs, resulting in neuronal differentiation. Statistical significances were assessed by one-way ANOVA with a post hoc Tukey’s test.

Similar articles

Cited by

References

    1. Heneka M.T., Kummer M.P., Latz E. Innate immune activation in neurodegenerative disease. Nat. Rev. Immunol. 2014;14:463–477. doi: 10.1038/nri3705. - DOI - PubMed
    1. Chen W.W., Zhang X., Huang W.J. Role of neuroinflammation in neurodegenerative diseases (Review) Mol. Med. Rep. 2016;13:3391–3396. doi: 10.3892/mmr.2016.4948. - DOI - PMC - PubMed
    1. Brown G.C. The endotoxin hypothesis of neurodegeneration. J. Neuroinflamm. 2019;16:180. doi: 10.1186/s12974-019-1564-7. - DOI - PMC - PubMed
    1. Catorce M.N., Gevorkian G. LPS-induced Murine Neuroinflammation Model: Main Features and Suitability for Pre-clinical Assessment of Nutraceuticals. Curr. Neuropharmacol. 2016;14:155–164. doi: 10.2174/1570159X14666151204122017. - DOI - PMC - PubMed
    1. Teeling J.L., Perry V.H. Systemic infection and inflammation in acute CNS injury and chronic neurodegeneration: Underlying mechanisms. Neuroscience. 2009;158:1062–1073. doi: 10.1016/j.neuroscience.2008.07.031. - DOI - PubMed

MeSH terms

LinkOut - more resources