. 2022 Jun 9;23(12):6448.
doi: 10.3390/ijms23126448.

The Identification of Broomcorn Millet bZIP Transcription Factors, Which Regulate Growth and Development to Enhance Stress Tolerance and Seed Germination

Affiliations

The Identification of Broomcorn Millet bZIP Transcription Factors, Which Regulate Growth and Development to Enhance Stress Tolerance and Seed Germination

Peipei An et al. Int J Mol Sci. .

Abstract

Broomcorn millet (Panicum miliaceum L.) is a water-efficient and highly salt-tolerant plant. In this study, the salt tolerance of 17 local species of broomcorn millet was evaluated through testing based on the analysis of the whitening time and the germination rate of their seeds. Transcriptome sequencing revealed that PmbZIP131, PmbZIP125, PmbZIP33, PmABI5, PmbZIP118, and PmbZIP97 are involved in seed germination under salt stress. Seedling stage expression analysis indicates that PmABI5 expression was induced by treatments of high salt (200 mM NaCl), drought (20% W/V PEG6000), and low temperature (4 °C) in seedlings of the salt-tolerant variety Y9. The overexpression of PmABI5 significantly increases the germination rate and root traits of Arabidopsis thaliana transgenic lines, with root growth and grain traits significantly enhanced compared to the wild type (Nipponbare). BiFC showed that PmABI5 undergoes homologous dimerization in addition to forming a heterodimer with either PmbZIP33 or PmbZIP131. Further yeast one-hybrid experiments showed that PmABI5 and PmbZIP131 regulate the expression of PmNAC1 by binding to the G-box in the promoter. These results indicate that PmABI5 can directly regulate seed germination and seedling growth and indirectly improve the salt tolerance of plants by regulating the expression of the PmNAC1 gene through the formation of heterodimers with PmbZIP131.

Keywords: NAC transcription factor; bZIP transcription factor; gene family analysis; root development; stress response.


Conflict of interest statement

The authors declare no conflict of interest.

Figures
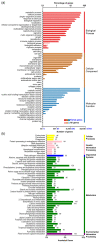
Figure 1
Figure 1
GO, KOG, NR, and KEGG annotation. (a) GO annotation to demonstrate the possible functional classifications of broomcorn millet genes. The lighter bars correspond to all genes (black), and the darker bars to differentially expressed genes (DEGs, blue). The genes were categorized into three main types: “biological process”, “cellular component”, and “molecular function”. (b) KEGG annotation showed that most of the genes were in the metabolism category. The genes were grouped into “cellular process”, “genetic information processing”, “organismal systems”, “metabolism”, and “environmental information processing”. (c) KOG annotation grouped all genes into 25 functional classifications. The number of genes annotated for this function and the percentage of total genes are shown in square brackets. (d) nr annotation showed that most of the sequenced broomcorn millet genes are highly similar to corresponding genes in Setaria italica and Sorghum bicolor.
Figure 1
Figure 1
GO, KOG, NR, and KEGG annotation. (a) GO annotation to demonstrate the possible functional classifications of broomcorn millet genes. The lighter bars correspond to all genes (black), and the darker bars to differentially expressed genes (DEGs, blue). The genes were categorized into three main types: “biological process”, “cellular component”, and “molecular function”. (b) KEGG annotation showed that most of the genes were in the metabolism category. The genes were grouped into “cellular process”, “genetic information processing”, “organismal systems”, “metabolism”, and “environmental information processing”. (c) KOG annotation grouped all genes into 25 functional classifications. The number of genes annotated for this function and the percentage of total genes are shown in square brackets. (d) nr annotation showed that most of the sequenced broomcorn millet genes are highly similar to corresponding genes in Setaria italica and Sorghum bicolor.
Figure 2
Figure 2
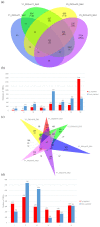
Venn analysis and bar charts of DEGs during salt stresses. (a) Venn diagram of DEGs due to 250 mM salt treatment. (b) Number of upregulated and downregulated genes corresponding to each part of (a). (c) Venn of DEGs caused by salt resistance. (d) Number of upregulated and downregulated genes corresponding to each part of (c). I–V indicate overlapped DEGs between Y1_CK2 vs. Y1_NA2, Y1_CK3 vs. Y1_NA3, Y9_CK2 vs. Y9_NA2 and Y9_CK3 vs. Y9_NA3; Y1_CK2 vs. Y1_NA2 and Y9_CK2 vs. Y9_NA2; Y1_CK3 vs. Y1_NA3, Y9_CK2 vs. Y9_NA2 and Y9_CK3 vs. Y9_NA3; Y9_CK2 vs. Y9_NA2 and Y9_CK3 vs. Y9_NA3; Y1_CK3 vs. Y1_NA3 and Y9_CK3 vs. Y9_NA3, respectively, in (a,b). VI–VIII indicate unique DEGs in group Y9_CK2 vs. Y9_NA2, Y1_CK3 vs. Y1_NA3 and Y9_CK3 vs. Y9_NA3, respectively. i–vi indicate unique DEGs in group Y1_CK1 vs. Y9_CK1, Y1_CK2 vs. Y9_CK2, Y1_CK3 vs. Y9_CK3, Y1_NA3 vs. Y9_NA3, Y1_NA2 vs. Y9_NA2 and Y1_NA1 vs. Y9_NA1, respectively, in (c,d).
Figure 3
Figure 3
GO enrichment and KEGG enrichment of DEGs (Y9_CK3 vs. Y9_NA3). (a) Top 20 GO term DEGs were enriched in three main categories: “biological process”, “cellular component”, and “molecular function”. (b) KEGG enrichment of DEGs. The horizontal axis represents enrichment factor, and the vertical axis represents Q-value. Different markers represent different pathways.
Figure 4
Figure 4
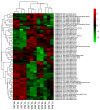
Heatmap of TFs involved in seed germination under salt stress. Heatmap of TFs were clustered by columns. Y9, Y1 represent Yumi 9 and Yumi 1, respectively. CK represents control, NA represents salt stress (250 mM NaCl). 1, 2, 3 represent the three periods. Y9_CK1 refers to Yumi 9 germination under RO water in the first period. The treatments and varieties are similarly indicated in the remaining labels. The information on the righthand side of the heatmap corresponds to the gene ID and annotation.
Figure 5
Figure 5
Expression pattern of PmbZIPs in the seedling stage. Error bars are SD based on three biological replicates and three technical repeats. *: p value < 0.05. (a) Expression levels of PmbZIP33 in Y1. The horizontal axis represents treatment with RO water (CK), 100 μM ABA (ABA), 200 mM NaCl (NaCl), 4 °C cold incubation (Cold), 42 °C heat stress (Heat), and 20% PEG6000 (PEG). (b) Expression levels of PmbZIP131 in Y1. (c) Expression levels of PmbABI5 in Y1. (d) Expression levels of PmbZIP33 in Y9. (e) Expression levels of PmbZIP131 in Y9. (f) Expression levels of PmbABI5 in Y9.
Figure 6
Figure 6
Subcellular localization of PmbZIPs. Marker was an endoplasmic reticulum (ER) marker protein; the positive control was pCAMBIA2300-eGFP. Red color indicates ER marker, green color indicates eGFP signal. Scale bars = 50 μM.
Figure 7
Figure 7
Bimolecular fluorescence complementation of PmbZIPs. Yellow color indicates YFP signal. Scale bars = 50 μM.
Figure 8
Figure 8
Identification of root traits of PmABI5 Arabidopsis overexpressing transgenic lines. (a) OE:PmABI5 Root Phenotype on Day 8 of germination. (b) OE:PmABI5 Root Phenotype on Day 14 of germination. (c) Mean values of OE:PmABI5 root length, number of lateral roots, root surface area, and average root diameter. Error bars indicate standard deviation, sample size of PmABI5 corresponds to the 9 transgenic Arabidopsis lines in Figure 8b, sample size of Col 0 corresponds to the 3 Arabidopsis lines in Figure 8b.
Figure 9
Figure 9
Identification of root traits of transgenic Arabidopsis PmABI5-overexpressing lines. (a) OE:PmABI5 alleviates plant stress. (b) 15-day-old OE:PmABI5 and Col-0. Scale bars = 1 cm. (c) The leaf phenotype of germinated 6-week OE:PmABI5. Scale bars = 2 cm. (d) The whole plant phenotype of germinated 6-week OE:PmABI5. (e) Root phenotype of PmABI5 rice overexpression lines. Scale bars = 1 cm.
Figure 10
Figure 10
Single hybridization of PmABI5 with G-box in yeast. (a) Structures of G-box and g-box in the pAbAi vector. Letters in red represent the three copies of G-box (CACGTG) and the mutanted sequence g-box (CATTTG). (b) Effector and reporter constructs used in yeast one-hybrid assay. (c) PmABI5 and PmbZIP131 bind directly to G-box.
Figure 11
Figure 11
External seed morphological characteristics of the 17 broomcorn millet populations considered in this study: (a) Jinmi 4; (b) Jinmi 9; (c) Longmi 7; (d) Longmi 8; (e) Neimi 5; (f) Neimi 6; (g) Ningmi 10; (h) Ningmi 11; (i) Qingmi 1; (j) Qingmi 2; (k) Yumi 9 (Y9); (l) Yumi 8; (m) Tianmi 1; (n) Xingmi 1; (o) Yanmi 7; (p) Yanmi 8; (q) Yumi 1 (Y1).

References

    1. FAOSTAT Food Balance. 1993–2013 and 2010–2019. [(accessed on 16 November 2021)]. Available online: https://www.fao.org/faostat/en/#data/FBSH.
    1. Ritchie H., Roser M. Crop Yields. Our World in Data. 2018. [(accessed on 16 November 2021)]. Available online: https://ourworldindata.org/
    1. Allakhverdiev S.I., Kreslavski V.D., Klimov V.V., Los D.A., Carpentier R., Mohanty P. Heat stress: An overview of molecular responses in photosynthesis. Photosynth. Res. 2008;98:541–550. doi: 10.1007/s11120-008-9331-0. - DOI - PubMed
    1. Halford N.G., Curtis T.Y., Chen Z., Huang J. Effects of abiotic stress and crop management on cereal grain composition: Implications for food quality and safety. J. Exp. Bot. 2014;66:1145–1156. doi: 10.1093/jxb/eru473. - DOI - PMC - PubMed
    1. Gong Z., Xiong L., Shi H., Yang S., Herrera-Estrella L.R., Xu G., Chao D.-Y., Li J., Wang P.-Y., Qin F., et al. Plant abiotic stress response and nutrient use efficiency. Sci. China Life Sci. 2020;63:635–674. doi: 10.1007/s11427-020-1683-x. - DOI - PubMed

MeSH terms

Substances

LinkOut - more resources