. 2022 Jun 13;23(12):6586.
doi: 10.3390/ijms23126586.

Manual Therapy Facilitates Homeostatic Adaptation to Bone Microstructural Declines Induced by a Rat Model of Repetitive Forceful Task

Affiliations

Manual Therapy Facilitates Homeostatic Adaptation to Bone Microstructural Declines Induced by a Rat Model of Repetitive Forceful Task

Mary F Barbe et al. Int J Mol Sci. .

Abstract

The effectiveness of manual therapy in reducing the catabolic effects of performing repetitive intensive force tasks on bones has not been reported. We examined if manual therapy could reduce radial bone microstructural declines in adult female Sprague-Dawley rats performing a 12-week high-repetition and high-force task, with or without simultaneous manual therapy to forelimbs. Additional rats were provided 6 weeks of rest after task cessation, with or without manual therapy. The control rats were untreated or received manual therapy for 12 weeks. The untreated TASK rats showed increased catabolic indices in the radius (decreased trabecular bone volume and numbers, increased osteoclasts in these trabeculae, and mid-diaphyseal cortical bone thinning) and increased serum CTX-1, TNF-α, and muscle macrophages. In contrast, the TASK rats receiving manual therapy showed increased radial bone anabolism (increased trabecular bone volume and osteoblast numbers, decreased osteoclast numbers, and increased mid-diaphyseal total area and periosteal perimeter) and increased serum TNF-α and muscle macrophages. Rest, with or without manual therapy, improved the trabecular thickness and mid-diaphyseal cortical bone attributes but not the mineral density. Thus, preventive manual therapy reduced the net radial bone catabolism by increasing osteogenesis, while rest, with or without manual therapy, was less effective.

Keywords: massage therapy; osteoblast; osteoclasts; overuse injury; repetitive motion disorder; work-related musculoskeletal disorders.


Conflict of interest statement

The authors declare no conflict of interest. The content is solely the responsibility of the authors and does not necessarily represent the official views of the National Institutes of Health.

Figures

Figure 1
Figure 1
Experimental design. Abbreviations: control rats (Control); control rats that received manual therapy for 12 weeks (Control+MT); 12-week TASK rats (TASK); TASK rats that simultaneously received manual therapy for 12 weeks (TASK+MT); TASK rats that rested for 6 weeks after task cessation (TASK-R), TASK rats that rested for 6 weeks after task cessation while receiving manual therapy treatment of their upper limbs three times per week (TASK-MTR). n# = number of rats per group; wks = weeks.
Figure 2
Figure 2
Micro-computerized tomography (MicroCT) of distal radial metaphyseal trabecular bone. (AG) Percent bone volume normalized to total volume (% BV/TV), trabecular number (Tb.N), trabecular separation (Tb.Sp), trabecular thickness (Tb.Th), bone surface density (bone surface normalized to bone volume; BS/BV), degree of anisotropy (DA), trabecular bone mineral density (BMD). Mean ± 95% confidence intervals (CIs) shown. (H) Representative transaxial and coronal images of the middle region of the trabecular zone of the distal radial metaphysis for each group. The transaxial view is shown from the top near the growth plate. Abbreviations: control rats (Control); 12-week TASK rats (TASK); TASK rats that rested for 6 weeks after task cessation (TASK-R); control rats that received manual therapy for 12 weeks (Control+MT); TASK rats that simultaneously received manual therapy for 12 weeks (TASK+MT); TASK rats that rested for 6 weeks after task cessation while receiving manual therapy treatment of their upper limbs three times per week (TASK-MTR). # and ##: p < 0.05 and p < 0.01, respectively, compared to TASK group. * and **: p < 0.05 and p < 0.01, respectively, compared between groups as shown.
Figure 3
Figure 3
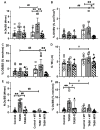
Static histomorphometry of osteoblast and osteoclast parameters in the distal radial metaphyseal trabecular bone. This was performed in a region located 150 μm below the chondro-osseous junction of the secondary spongiosa and 50 μm in from the surrounding cortical bone. (AF) Number of osteoblasts per bone surface (N.Ob/BS), percent osteoid volume normalized to bone volume (% OV/BV), percent osteoid surface normalized to bone surface (% OS/BS), osteoid width (O.Wi), number of osteoclasts per bone surface (N.Oc/BS), percent osteoclast surface normalized to bone surface (% Oc.S/BS). Mean ± 95% confidence intervals (CIs) shown. Abbreviations: control rats (Control); 12-week TASK rats (TASK); TASK rats that rested for 6 weeks after task cessation (TASK-R); control rats that received manual therapy for 12 weeks (Control+MT); TASK rats that simultaneously received manual therapy for 12 weeks (TASK+MT); TASK rats that rested for 6 weeks after task cessation while receiving manual therapy treatment of their upper limbs three times per week (TASK-MTR). # and ##: p < 0.05 and p < 0.01, respectively, compared to the TASK group. * and **: p < 0.05 and p < 0.01, respectively, compared between groups as shown.
Figure 4
Figure 4
MicroCT of the mid-diaphyseal cortical bone of the radius. (AF) Total area (Tt.Ar), cortical bone area (Ct.Ar), percent cortical area normalized to total area (% Ct.Ar/Tt.Ar), cortical thickness (Ct.Th), marrow area (Ma.Ar), periosteal perimeter (Ps.Pm). (G) Representative transaxial images of the mid-diaphysis of the radius. (H) Cortical bone tissue mineral density (TMD). Mean ± 95% confidence intervals (CIs) shown. Abbreviations: control rats (Control); 12-week TASK rats (TASK); TASK rats that rested for 6 weeks after task cessation (TASK-R); control rats that received manual therapy for 12 weeks (Control+MT); TASK rats that simultaneously received manual therapy for 12 weeks (TASK+MT); TASK rats that rested for 6 weeks after task cessation while receiving manual therapy treatment of their upper limbs three times per week (TASK-MTR). # and ##: p < 0.05 and p < 0.01, respectively, compared to the TASK group. * and **: p < 0.05 and p < 0.01, respectively, compared between groups as shown.
Figure 5
Figure 5
Serum levels of bone turnover and inflammation biomarkers. (A) Osteocalcin. (B) C-telopeptide of type I collagen (CTX-1). (C) Tumor necrosis factor-alpha (TNF-α). Abbreviations: control rats (Control); 12-week TASK rats (TASK); TASK rats that rested for 6 weeks after task cessation (TASK-R); control rats that received manual therapy for 12 weeks (Control+MT); TASK rats that simultaneously received manual therapy for 12 weeks (TASK+MT); TASK rats that rested for 6 weeks after task cessation while receiving manual therapy treatment of their upper limbs three times per week (TASK-MTR). Mean ± 95% confidence intervals (CIs) shown. ##: p < 0.01, compared to the TASK group; * and **: p < 0.05 and p < 0.01, respectively, compared between groups as shown.
Figure 6
Figure 6
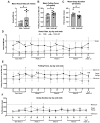
Voluntary task outcomes. Data are shown only for rats performing the task immediately before the time of tissue collection (TASK and TASK+MT). (A) Mean reach rate (mean reaches per minute) across weeks. (B) Mean pulling force on the lever bar across weeks. (C) Mean grasp duration (mean time rat spent holding the lever bar) across weeks. (DF) Mean reach rate, mean pulling force, and mean grasp duration, respectively, shown for selected days (the four sessions of each day were averaged) and weeks (1, 3, 6, 9, and 12). Abbreviations: 12-week TASK rats (TASK); TASK rats that simultaneously received manual therapy for 12 weeks (TASK+MT). Mean ± 95% confidence intervals (CIs) shown. * and **: p < 0.05 and p < 0.01, respectively, compared to TASK group.
Figure 7
Figure 7
Assays of flexor digitorum muscle and Pearson’s correlations. (A) Number (#) of CD68 immunopositive macrophages in muscle. (B) Pearson’s correlation between # CD68+ cells in muscle and mean pulling force during the final two weeks of task performance. (C) Cross-section area (CSA) of flexor digitorum muscle at its widest point in mid-forearm. (D) Pearson’s correlation between the muscle CSA and mean pulling force during the final two weeks of task performance. Mean ± 95% confidence intervals (CIs) shown. Abbreviations: control rats (Control); 12-week TASK rats (TASK); TASK rats that rested for 6 weeks after task cessation (TASK-R); control rats that received manual therapy for 12 weeks (Control+MT); TASK rats that simultaneously received manual therapy for 12 weeks (TASK+MT); TASK rats that rested for 6 weeks after task cessation while receiving manual therapy treatment of their upper limbs three times per week (TASK-MTR). ##: p < 0.01, compared to the TASK group; **: p < 0.01, compared between groups as shown.

Similar articles

Cited by

References

    1. Epstein S., Sparer E.H., Tran B.N., Ruan Q.Z., Dennerlein J.T., Singhal D., Lee B.T. Prevalence of Work-Related Musculoskeletal Disorders Among Surgeons and Interventionalists: A Systematic Review and Meta-analysis. JAMA Surg. 2018;153:e174947. doi: 10.1001/jamasurg.2017.4947. - DOI - PMC - PubMed
    1. Wang P.C., Rempel D.M., Hurwitz E.L., Harrison R.J., Janowitz I., Ritz B.R. Self-reported pain and physical signs for musculoskeletal disorders in the upper body region among Los Angeles garment workers. Work. 2009;34:79–87. doi: 10.3233/WOR-2009-0904. - DOI - PubMed
    1. Panush R.S. Occupational and Recreational Musculoskeletal Disorders. In: Firestein G.S., Budd R.C., Gariel S.E., McInnes I.B., O’Dell J.R., editors. Kelley and Firestein’s Textbook of Rheumatology. Elsevier; Philadelpia, PA, USA: 2017.
    1. NIOSH National Manufacturing Agenda—June 2010. [(accessed on 23 October 2011)]; Available online: http://www.cdc.gov/niosh/nora/comment/agendas/manuf/
    1. Kjaer M. Role of extracellular matrix in adaptation of tendon and skeletal muscle to mechanical loading. Physiol. Rev. 2004;84:649–698. doi: 10.1152/physrev.00031.2003. - DOI - PubMed

Substances

LinkOut - more resources