. 2022 Jun 13;23(12):6592.
doi: 10.3390/ijms23126592.

Distinct Roles of NANOS1 and NANOS3 in the Cell Cycle and NANOS3-PUM1-FOXM1 Axis to Control G2/M Phase in a Human Primordial Germ Cell Model

Affiliations

Distinct Roles of NANOS1 and NANOS3 in the Cell Cycle and NANOS3-PUM1-FOXM1 Axis to Control G2/M Phase in a Human Primordial Germ Cell Model

Erkut Ilaslan et al. Int J Mol Sci. .

Abstract

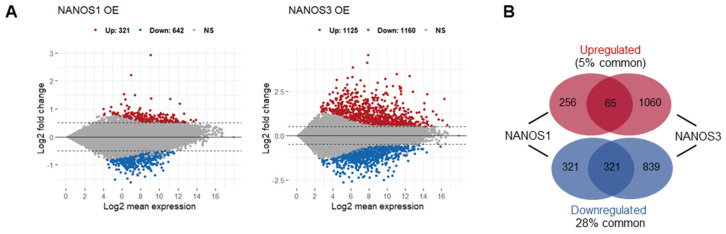
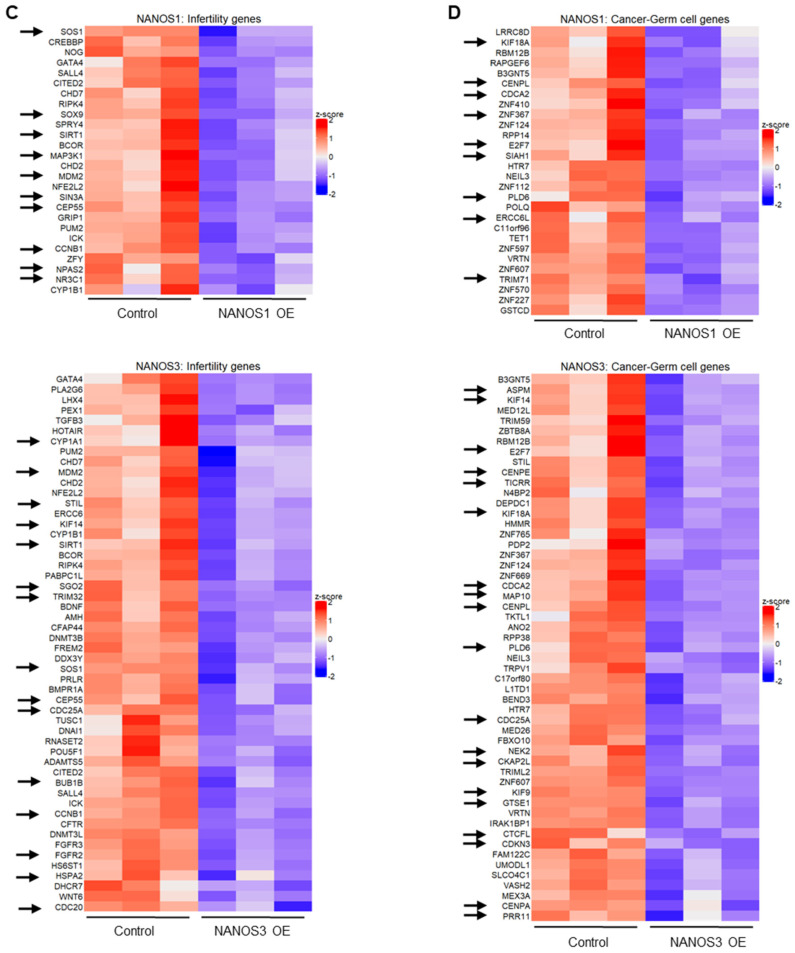
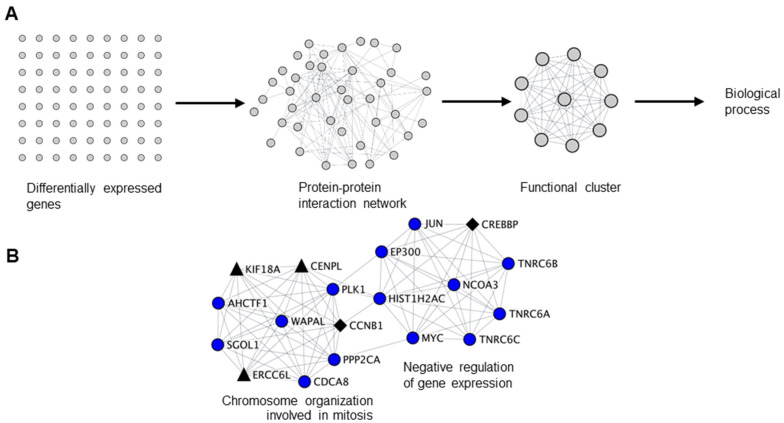
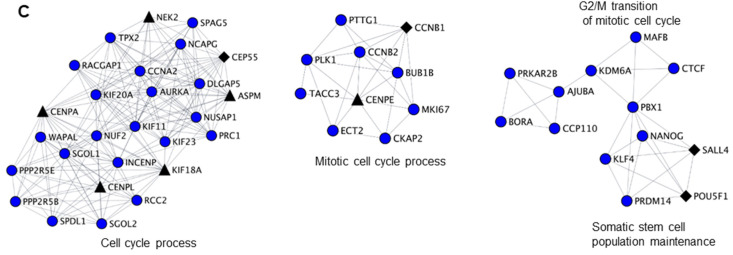
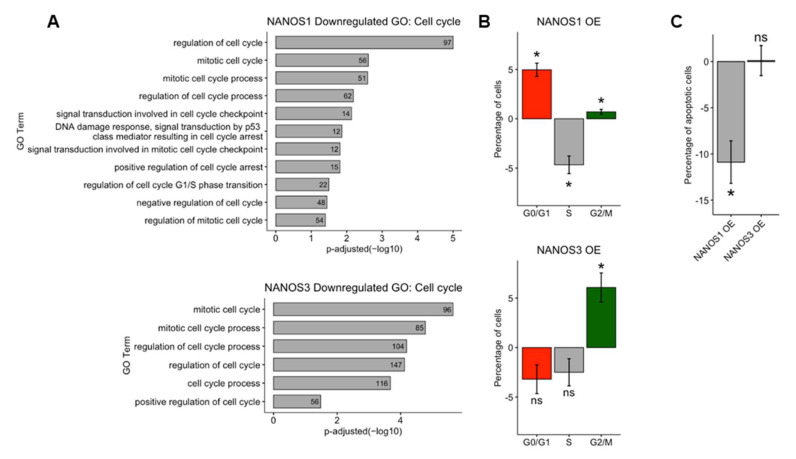
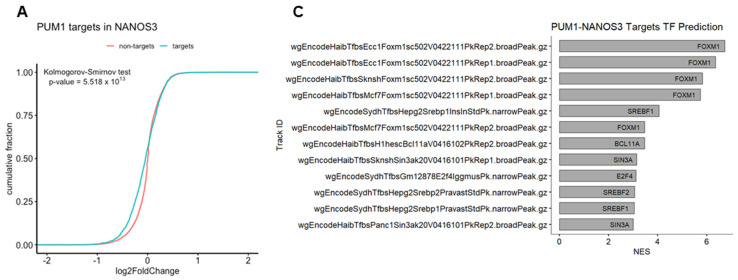
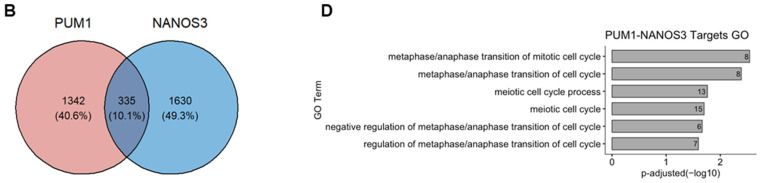
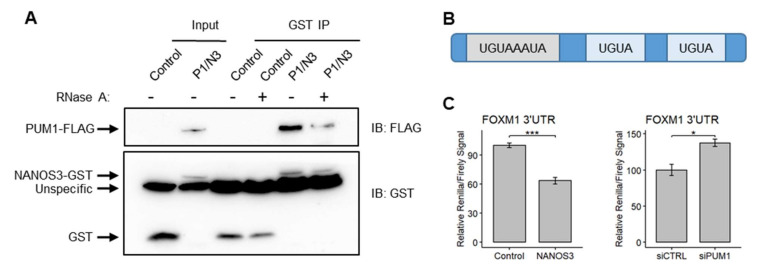
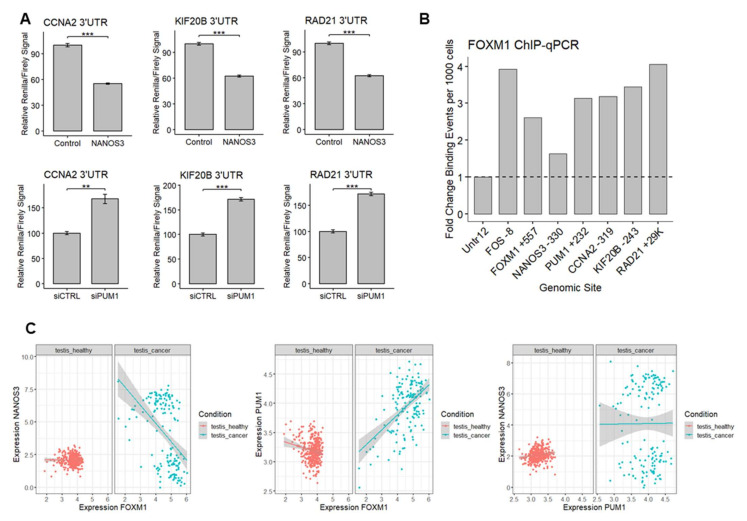
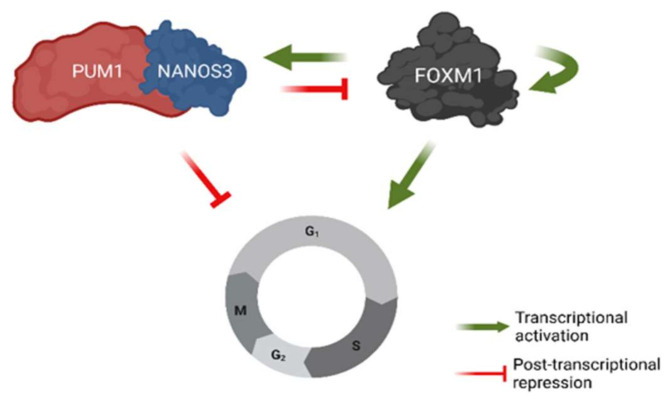
Nanos RNA-binding proteins are critical factors of germline development throughout the animal kingdom and their dysfunction causes infertility. During evolution, mammalian Nanos paralogues adopted divergent roles in germ cell biology. However, the molecular basis behind this divergence, such as their target mRNAs, remains poorly understood. Our RNA-sequencing analysis in a human primordial germ cell model-TCam-2 cell line revealed distinct pools of genes involved in the cell cycle process downregulated upon NANOS1 and NANOS3 overexpression. We show that NANOS1 and NANOS3 proteins influence different stages of the cell cycle. Namely, NANOS1 is involved in the G1/S and NANOS3 in the G2/M phase transition. Many of their cell cycle targets are known infertility and cancer-germ cell genes. Moreover, NANOS3 in complex with RNA-binding protein PUM1 causes 3'UTR-mediated repression of FOXM1 mRNA encoding a transcription factor crucial for G2/M phase transition. Interestingly, while NANOS3 and PUM1 act as post-transcriptional repressors of FOXM1, FOXM1 potentially acts as a transcriptional activator of NANOS3, PUM1, and itself. Finally, by utilizing publicly available RNA-sequencing datasets, we show that the balance between FOXM1-NANOS3 and FOXM1-PUM1 expression levels is disrupted in testis cancer, suggesting a potential role in this disease.

Keywords: FOXM1; NANOS1; NANOS3; PUM1; cell cycle; germ cell cancer; human primordial germ cells.


Conflict of interest statement

The authors declare no conflict of interest. The funders had no role in the design of the study; in the collection, analyses, or interpretation of data; in the writing of the manuscript, or in the decision to publish the results.

Figures

Figure 1
Figure 1
Transcriptomic changes upon NANOS1 and NANOS3 overexpression in TCam-2 cell line. (A) RNA-Sequencing (RNA-Seq) upon NANOS1 (left panel) and NANOS3 (right panel) overexpression visualized as MA-plots. Differentially expressed genes were filtered with log2FC ≥ 0.5 for upregulated and ≤ −0.5 for downregulated genes. Adjusted p-value ≤ 0.01 was considered as significant. (B) Venn diagram showing common and distinct differentially expressed genes between NANOS1 and NANOS3 overexpression. (C) Expression level of infertility genes downregulated upon NANOS1 (upper heatmap) and NANOS3 (lower heatmap) overexpression visualized as heatmaps with z-score scaling. (D) Cancer-germ cell genes downregulated upon NANOS1 (upper heatmap) and NANOS3 (lower heatmap) overexpression. Genes involved in cell cycle are marked by arrows.
Figure 1
Figure 1
Transcriptomic changes upon NANOS1 and NANOS3 overexpression in TCam-2 cell line. (A) RNA-Sequencing (RNA-Seq) upon NANOS1 (left panel) and NANOS3 (right panel) overexpression visualized as MA-plots. Differentially expressed genes were filtered with log2FC ≥ 0.5 for upregulated and ≤ −0.5 for downregulated genes. Adjusted p-value ≤ 0.01 was considered as significant. (B) Venn diagram showing common and distinct differentially expressed genes between NANOS1 and NANOS3 overexpression. (C) Expression level of infertility genes downregulated upon NANOS1 (upper heatmap) and NANOS3 (lower heatmap) overexpression visualized as heatmaps with z-score scaling. (D) Cancer-germ cell genes downregulated upon NANOS1 (upper heatmap) and NANOS3 (lower heatmap) overexpression. Genes involved in cell cycle are marked by arrows.
Figure 2
Figure 2
Biological clustering analysis (BCA) reveals cell cycle related functions for NANOS1 and NANOS3. (A) Workflow for biological clustering analysis (BCA). High confidence (score ≥ 0.9) protein–protein interaction networks of differentially expressed genes are created using the STRING database followed by cluster detection by MCODE. Further, these clusters were subjected to gene ontology (GO) search for the corresponding biological process. (B) NANOS1 and (C) NANOS3 downregulated cell cycle cluster containing infertility (shown in black diamonds, Supplementary Table S3) and cancer-germ cell genes (shown in black triangles, Supplementary Table S4).
Figure 2
Figure 2
Biological clustering analysis (BCA) reveals cell cycle related functions for NANOS1 and NANOS3. (A) Workflow for biological clustering analysis (BCA). High confidence (score ≥ 0.9) protein–protein interaction networks of differentially expressed genes are created using the STRING database followed by cluster detection by MCODE. Further, these clusters were subjected to gene ontology (GO) search for the corresponding biological process. (B) NANOS1 and (C) NANOS3 downregulated cell cycle cluster containing infertility (shown in black diamonds, Supplementary Table S3) and cancer-germ cell genes (shown in black triangles, Supplementary Table S4).
Figure 3
Figure 3
Distinct phenotypic effects of NANOS1 and NANOS3 overexpression on the cell cycle. (A) Cell cycle related biological processes downregulated upon NANOS1 (top panel) and NANOS3 (bottom panel) overexpression identified in GO analysis. (B) Cell cycle analysis by propidium iodide staining followed by flow cytometry analysis upon NANOS1 (top panel) and NANOS3 (bottom panel) overexpression. (C) Apoptosis analysis by Annexin-V staining followed by flow cytometry analysis upon NANOS1 and NANOS3 overexpression. Standard error is visualized as error bars. * = p-value ≤ 0.05.
Figure 4
Figure 4
FOXM1 and TAF1 act as transcription factors for NANOS1 and NANOS3 downregulated genes. (A) Cumulative distribution analysis of differentially expressed genes upon NANOS3 RNA-Seq. Common differentially expressed mRNA distribution shown in blue and labeled as targets. The rest of the differentially expressed genes are shown in red and labeled as non-targets. (B) Common differentially expressed genes that are repressed by both NANOS3 and PUM1 identified as downregulated (log2FC < 0) upon NANOS3 overexpression and upregulated (log2FC > 0) upon PUM1 knockdown. (C) iRegulon transcription factor prediction analysis for NANOS3/PUM1 common repressed genes. (D) Cell cycle related biological processes identified by gene ontology enrichment analysis for NANOS3-PUM1 common repressed genes.
Figure 4
Figure 4
FOXM1 and TAF1 act as transcription factors for NANOS1 and NANOS3 downregulated genes. (A) Cumulative distribution analysis of differentially expressed genes upon NANOS3 RNA-Seq. Common differentially expressed mRNA distribution shown in blue and labeled as targets. The rest of the differentially expressed genes are shown in red and labeled as non-targets. (B) Common differentially expressed genes that are repressed by both NANOS3 and PUM1 identified as downregulated (log2FC < 0) upon NANOS3 overexpression and upregulated (log2FC > 0) upon PUM1 knockdown. (C) iRegulon transcription factor prediction analysis for NANOS3/PUM1 common repressed genes. (D) Cell cycle related biological processes identified by gene ontology enrichment analysis for NANOS3-PUM1 common repressed genes.
Figure 5
Figure 5
FOXM1 mRNA is regulated by the NANOS3/PUM1 post-transcriptional complex through its’ 3′UTR. (A) Western-blot visualization of GST pull-down of NANOS3 with and without RNase A. (B) Schematic representation of FOXM1 3′UTR containing the Pumilio binding element (PBE-UGUAHAUA) and 2 PBE-like motifs (containing core UGUA motif). (C) Dual luciferase assay to measure Renilla/Firefly ratio upon PUM1 knockdown and NANOS3 overexpression using 3′UTR of FOXM1 in the downstream of Renilla ORF. Standard error is visualized as error bars. * = p-value ≤ 0.05, *** = p-value ≤ 0.001.
Figure 6
Figure 6
The NANOS3–PUM1–FOXM1 axis coordinates the expression of the cell cycle genes. (A) Dual luciferase assay to measure Renilla/Firefly ratio upon PUM1 knockdown and NANOS3 overexpression using 3′UTR of CCNA2, KIF20B, and RAD21 in the downstream of Renilla ORF. (B) Relative fold change of FOXM1 binding events per 1000 cells for the promoter region of the target genes measured by ChIP-qPCR. (C) Differential correlation analysis of NANOS3, PUM1, and FOXM1 in publicly available healthy testis (GTEx) and testicular cancer datasets (TCGA). Each dot represents a single GTEx or TCGA dataset. Expression values are transformed as log(expression +1). Standard error is visualized as error bars. ** = p-value ≤ 0.01, *** = p-value ≤ 0.001.
Figure 7
Figure 7
Model of NANOS3-PUM1-FOXM1 axis regulating G2/M phase of the cell cycle in TCam-2 cell line. Created with BioRender.com.

Similar articles

Cited by

References

    1. Mercer M., Jang S., Ni C., Buszczak M. The Dynamic Regulation of mRNA Translation and Ribosome Biogenesis During Germ Cell Development and Reproductive Aging. Front. Cell Dev. Biol. 2021;9:710186. doi: 10.3389/fcell.2021.710186. - DOI - PMC - PubMed
    1. Khalaj K., Miller J.E., Fenn C.R., Ahn S., Luna R.L., Symons L., Monsanto S.P., Koti M., Tayade C. RNA-Binding Proteins in Female Reproductive Pathologies. Am. J. Pathol. 2017;187:1200–1210. doi: 10.1016/j.ajpath.2017.01.017. - DOI - PubMed
    1. Pereira B., Billaud M., Almeida R. RNA-Binding Proteins in Cancer: Old Players and New Actors. Trends Cancer. 2017;3:506–528. doi: 10.1016/j.trecan.2017.05.003. - DOI - PubMed
    1. Yao L., Cong R., Ji C., Zhou X., Luan J., Meng X., Song N. RNA-Binding Proteins Play an Important Role in the Prognosis of Patients with Testicular Germ Cell Tumor. Front. Genet. 2021;12:610291. doi: 10.3389/fgene.2021.610291. - DOI - PMC - PubMed
    1. Lehmann R., Nusslein-Volhard C. The maternal gene nanos has a central role in posterior pattern formation of the Drosophila embryo. Development. 1991;112:679–691. doi: 10.1242/dev.112.3.679. - DOI - PubMed