. 2022 Jun 14;23(12):6619.
doi: 10.3390/ijms23126619.

Coronin1C Is a GDP-Specific Rab44 Effector That Controls Osteoclast Formation by Regulating Cell Motility in Macrophages

Affiliations

Coronin1C Is a GDP-Specific Rab44 Effector That Controls Osteoclast Formation by Regulating Cell Motility in Macrophages

Yu Yamaguchi et al. Int J Mol Sci. .

Abstract

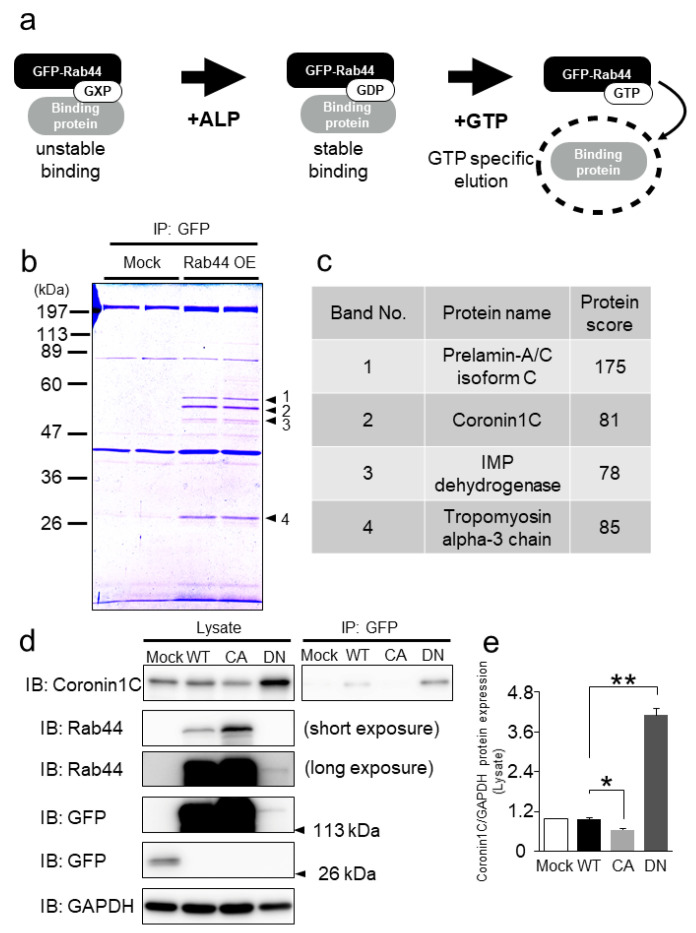
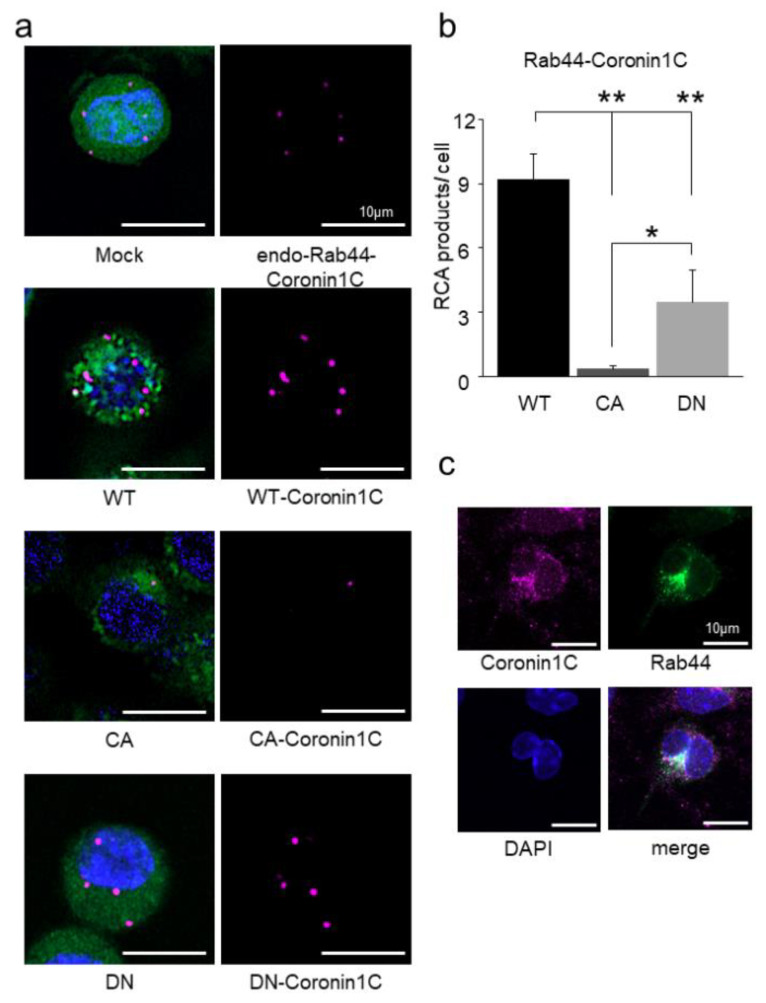
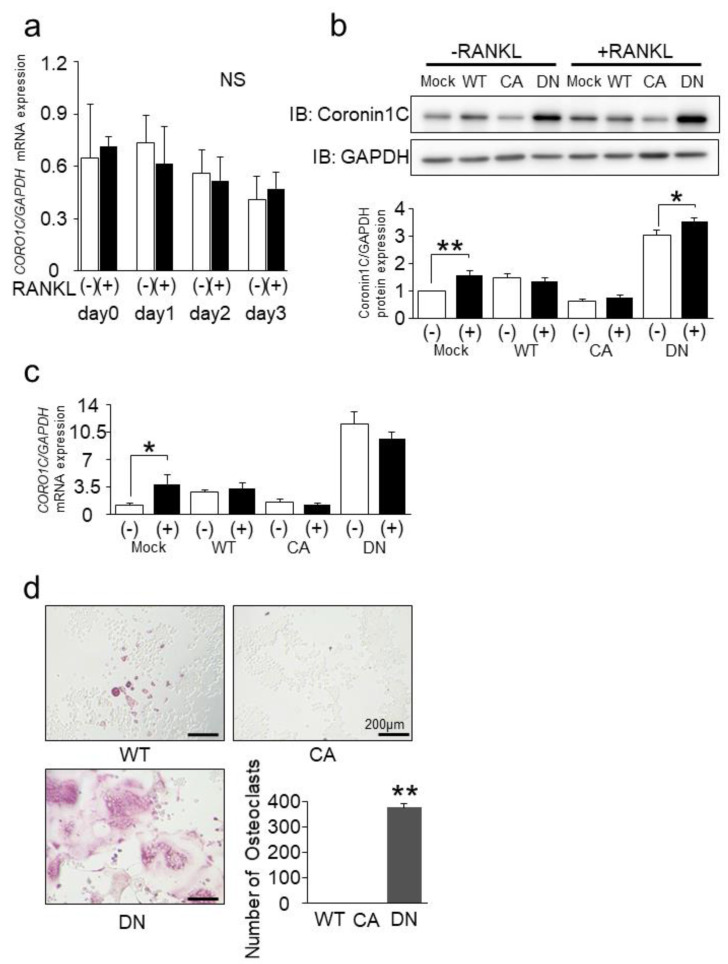
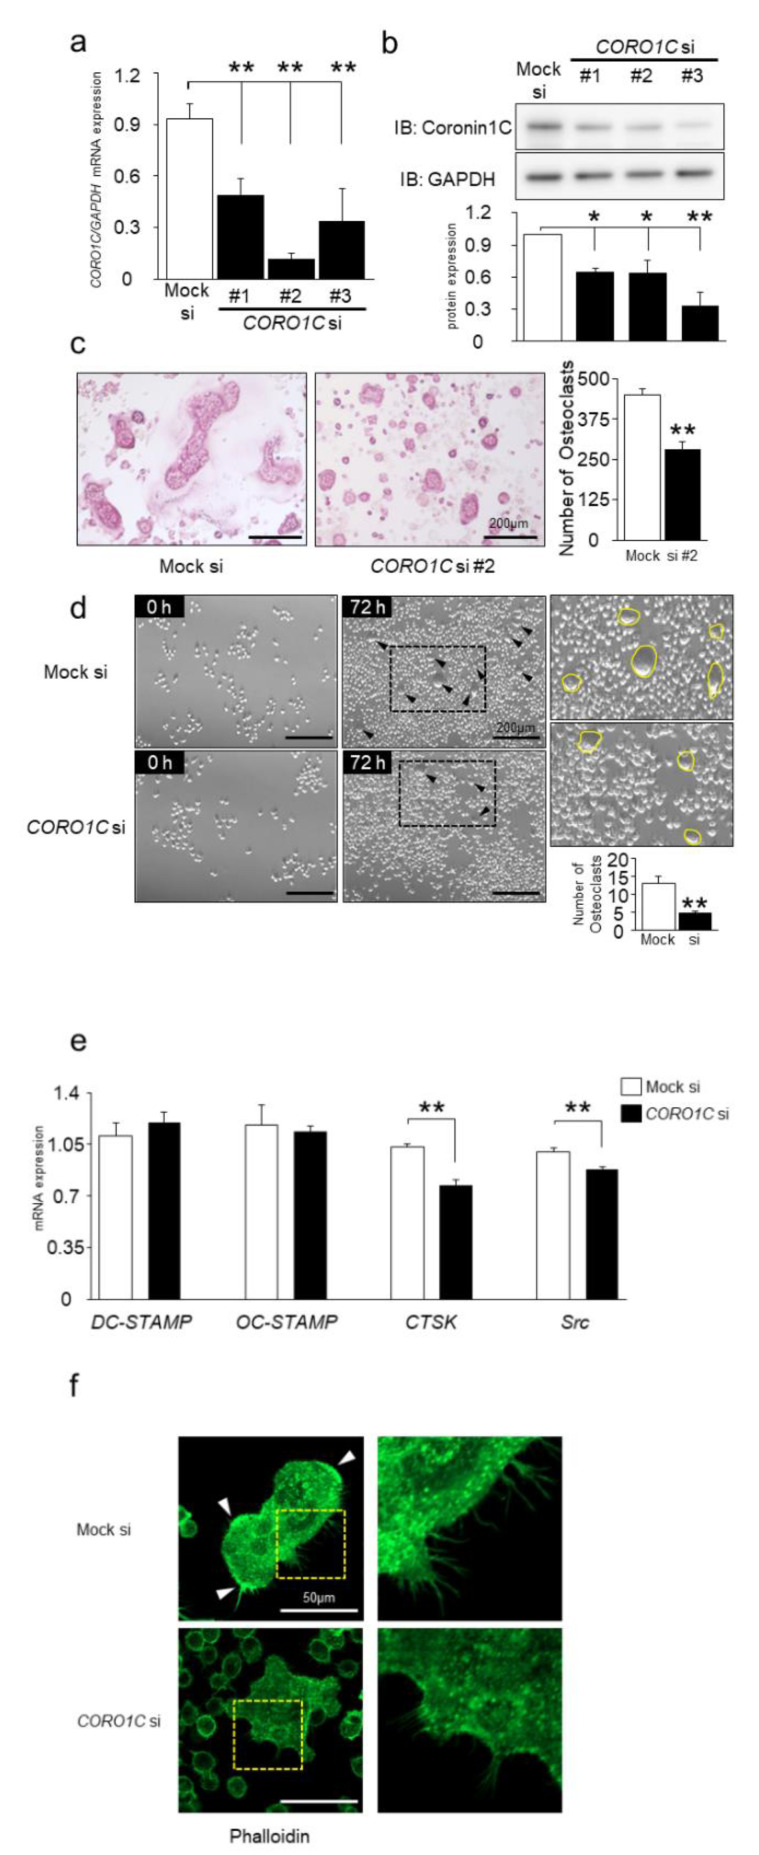
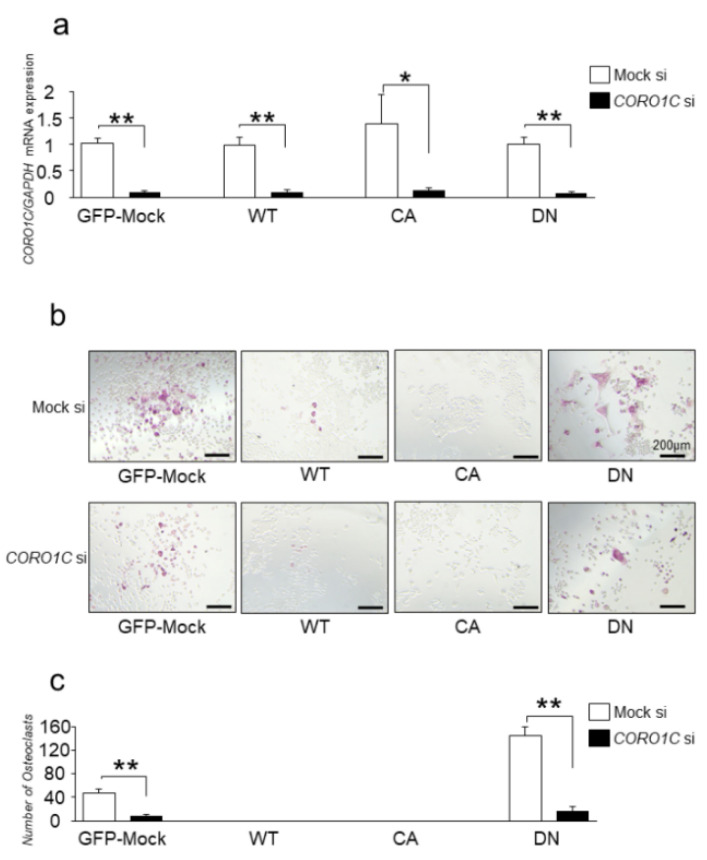
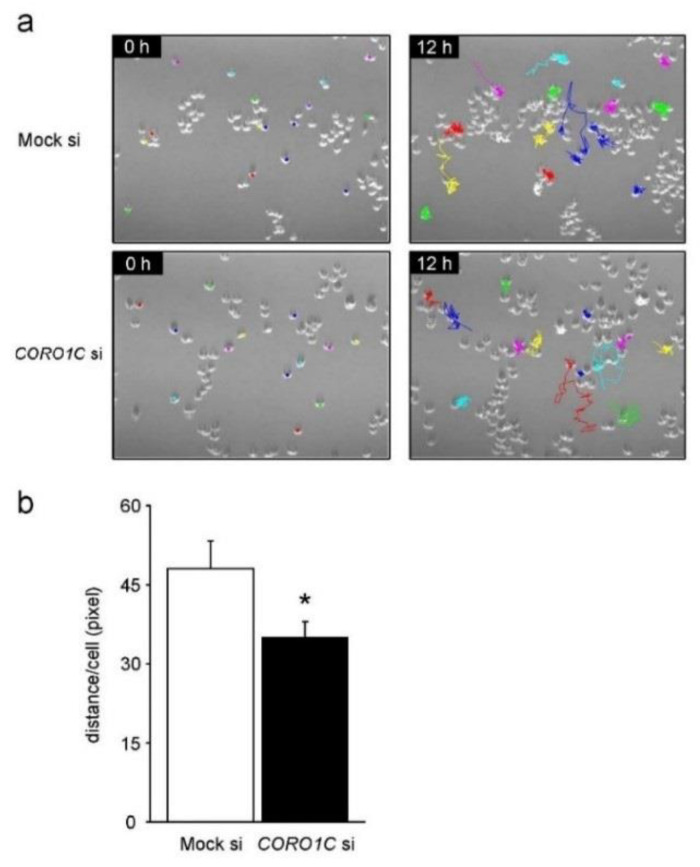
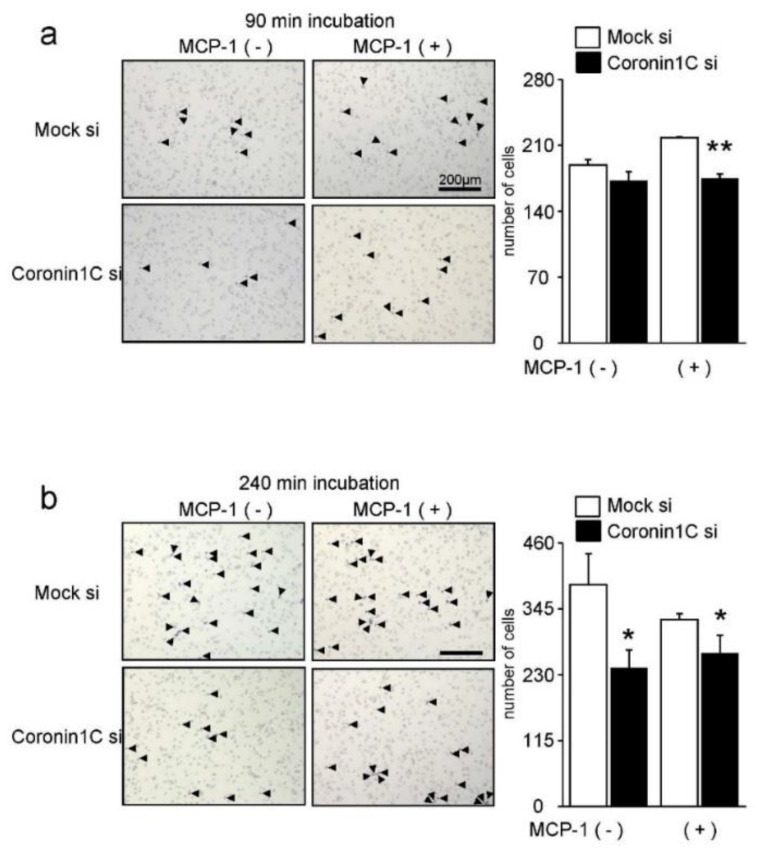
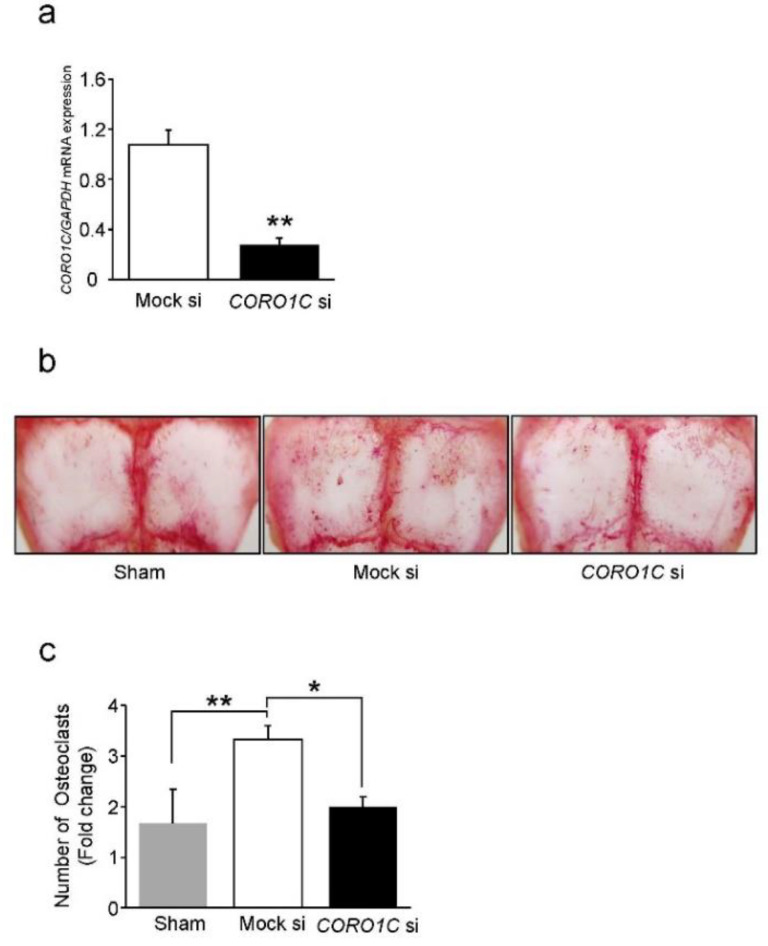
Osteoclasts are multinucleated bone-resorbing cells that are formed by the fusion of macrophages. Recently, we identified Rab44, a large Rab GTPase, as an upregulated gene during osteoclast differentiation that negatively regulates osteoclast differentiation. However, the molecular mechanisms by which Rab44 negatively regulates osteoclast differentiation remain unknown. Here, we found that the GDP form of Rab44 interacted with the actin-binding protein, Coronin1C, in murine macrophages. Immunoprecipitation experiments revealed that the interaction of Rab44 and Coronin1C occurred in wild-type and a dominant-negative (DN) mutant of Rab44, but not in a constitutively active (CA) mutant of Rab44. Consistent with these findings, the expression of the CA mutant inhibited osteoclast differentiation, whereas that of the DN mutant enhanced this differentiation. Using a phase-contrast microscope, Coronin1C-knockdown osteoclasts apparently impaired multinuclear formation. Moreover, Coronin1C knockdown impaired the migration and chemotaxis of RAW-D macrophages. An in vivo experimental system demonstrated that Coronin1C knockdown suppresses osteoclastogenesis. Therefore, the decreased cell formation and fusion of Coronin1C-depleted osteoclasts might be due to the decreased migration of Coronin1C-knockdown macrophages. These results indicate that Coronin1C is a GDP-specific Rab44 effector that controls osteoclast formation by regulating cell motility in macrophages.

Keywords: Coronin1C; Rab44; cell motility; effector; osteoclast differentiation.


Conflict of interest statement

The authors declare no conflict of interest.

Figures

Figure 1
Figure 1
Identification of Coronin1C as a GDP-specific Rab44-interacting protein in mouse macrophage RAW-D cells. (a) Schematic of GDP-bound Rab44-interacting proteins. Rab44 binds to and dissociates from GEF in the presence of GTP or GDP (GXP) in cellular lysates (unstable binding). The addition of ALP (25U) removed GXP and maintained the binding between GEF and Rab44 (stable binding). When GTP (5 mM) was added, GDP-specific Rab44 interacting proteins were extracted (GTP-specific elution). (b) CBB staining of the GDP-bound Rab44-interacting proteins. Immunoprecipitation (IP) was performed using beads with GFP antibody in RAW-D cells expressing GFP protein only (mock) or Rab44 tagged with GFP (Rab44 OE). The eluates (same protein amounts) were subjected to SDS-PAGE detected by CBB staining. (c) The four proteins were identified by MALDI-TOF-MS using Mascot Search. Prelamin-A/C was detected as band #1, Coronin1C was band #2, IMP dehydrogenase was band #3, and Tropomyosin α3 chain was band #4. Protein scores greater than 65 were considered significant (p < 0.05). (d) Western blot analysis of immunoprecipitation (IP) experiments with GFP antibody in RAW-D cells expressing GFP protein only (Mock), Rab44 tagged with GFP (WT), a constitutively active (CA) mutant (Q596L), and a dominantly negative (DN) mutant (T551N). Cell lysates or IP samples using a GFP antibody were subjected to SDS-PAGE followed by Western blotting with antibodies against Coronin1c, Rab44, GFP, and GAPDH. GAPDH was used as the loading control. (e) Quantitative analysis of proteins in cell lysates by relative chemiluminescence intensity measured with ImageJ. Measurements were normalized to those of mock without RANKL stimulation. * p < 0.05, ** p < 0.01; compared to WT with or without RANKL stimulation, respectively.
Figure 2
Figure 2
Proximity ligation assay of the interaction between Rab44 and Coronin1C. (a) Detection of proximity ligation signals between Rab44 and Coronin1C in RAW-D cells using a confocal microscope. GFP proteins in Rab44 (WT, CA, DN) with GFP tag expressing cells were fluorescently detected as green, rolling circle amplification (RCA) products of Rab44 and Coronin1C were detected as magenta, and DAPI was detected as Blue (nuclei). Bar: 50 μm. (b) Quantitative analysis of the number of the RCA products in a cell using ImageJ software. Data are expressed as mean ± SD (n = 4). * p <0.05, ** p <0.01. (c) Localization of Rab44 and Coronin1C in bone marrow-derived macrophages (BMMs) using confocal microscopy. BMMs were cultured in M-CSF (30 ng/mL) and RANKL (100 ng/mL) for three days, followed by immunofluorescent staining with Rab44 and Coronin1c antibodies. Coronin1C (Magenta), Rab44 (Green), and the nuclei (Blue).
Figure 3
Figure 3
Expression and localization of Coronin1c during osteoclast differentiation. (a) qPCR analysis of CORO1C mRNA expression levels in RANKL stimulated RAW-D cells during osteoclast differentiation. The data are expressed as the mean ± SD of the values from three independent experiments. No significant differences were found. (b) RAW-D cells expressing mock, WT, and CA were cultured in the presence or absence of RANKL (100 ng/mL) for 3 days. Cell lysates from the expressing RAW-D cells were subjected to SDS-PAGE followed by Western blotting with antibodies against Coronin1C, and GAPDH. GAPDH was used as the loading control. Quantitative analysis of proteins in cell lysates by relative chemiluminescence intensity measured with ImageJ. Measurements were normalized to those of mock without RANKL stimulation. * p < 0.05, ** p < 0.01; compared to Mock with or without RANKL stimulation, respectively. (c) The mRNA expression levels of Coronin1C in mock, WT, CA expressed RAW-D cells after treatment with or without RANKL for 3 days were analyzed by qPCR. * p < 0.05; compared with the mock cells. (d) TRAP staining of multinucleated cells derived from WT, CA-mutant, and DN-mutant expressing cells treated with RANKL for 3 days. Bar: 200 μm. The number of TRAP-positive multinucleated osteoclasts was counted. ** p < 0.01; compared to WT-expressing cells.
Figure 4
Figure 4
Effects of Coronin1C knockdown on osteoclast differentiation. (a) For knockdown efficiency, RAW-D cells were transfected with 3 types of CORO1C siRNA (Coronin1C si), followed by stimulation with RANKL (100 ng/mL) for 3 days. The Coronin1C mRNA levels were analyzed by qPCR. ** p < 0.01; compared with the mock cells. (b) The Coronin1C protein levels of 3 types were analyzed by Western blot. Quantitative analysis of proteins in cell lysates by relative chemiluminescence intensity measured with ImageJ. Measurements were normalized by Mock si. * p < 0.05, ** p < 0.01; compared to Mock si. (c) TRAP staining of multinucleated cells derived from Coronin1C si and the Mock si cells treated with RANKL for 4 days. ** p < 0.01; (d) Time-lapse images at 0 h and 72 h of Mock si (upper) and CORO1C si cells (lower). The arrowheads point to multinucleated cells. The magnified images on the right are images of the area circled by the dotted line in the 72-h images. Cells bordered in yellow are multinucleated cells. The number of multinucleated cells was counted. ** p < 0.01; compared to mock si cells. (e) Comparison of mRNA levels of various osteoclast marker genes in CORO1C si and the Mock si cells. RAW-D cells were cultured with RANKL (100 ng/mL) for 3 days. After mRNA isolation from these cells, RT-PCR was performed. ** p < 0.01, compared with the Mock si cells. (f) Phalloidin staining of multinucleated cells derived from Coronin1C si and the Mock si cells treated with RANKL for 3 days. The arrowheads point to lamellipodia in cells. The area enclosed by the yellow dotted line has been enlarged and is shown to the right. The enlarged photos show filopodia.
Figure 5
Figure 5
Effects of Coronin1C knockdown and Rab44 overexpression on osteoclast differentiation. (a) GFP-Mock, WT, CA and DN expressed RAW-D cells were transfected with CORO1C siRNA (Coronin1C si), followed by stimulation with RANKL (100 ng/mL) for 3 days. The Coronin1C mRNA levels were analyzed by qPCR. * p < 0.05; ** p < 0.01; compared with the mock cells. (b) TRAP staining of the GFP-mock, WT, CA and DN expressed RAW-D cells transfected with Coronin1C si and the Mock si cells after stimulation with RANKL for 3 days. (c) The number of TRAP-positive multinucleated osteoclasts, which contained three or more nuclei, was counted. ** p < 0.01; compared to mock cells.
Figure 6
Figure 6
Migration of the mock and Coronin1C-knockdown RAW-D cells. (a) Mock and Coronin1C-knockdown RAW-D cells seeded onto a 6-well plate were analyzed by time-lapse video microscopy. Micrographs of time-lapse imaging showing cell tracks. Representative plots of approximately 15 cells of mock and Coronin1C-knockdown RAW-D cell migration tracks for a total duration of 12 h/track. The data and pictures are representative of three independent experiments. (b) The distance traveled between positions (path length) of 100 cells. * p < 0.05, compared with the mock cells.
Figure 7
Figure 7
Chemotaxis of the Mock and Coronin1C-knockdown RAW-D cells. Chemotaxis was evaluated using a Transwell chamber. The cells in the 24-well chambers were treated with or without MCP-1 (0.1 nM) at 37 °C for 90 min (a) or 240 min (b). The cells that migrated from the upper to the lower well were fixed and stained with hematoxylin solution. The number of cells was counted by light microscopy. The arrowheads indicate cells. * p <0.05, ** p < 0.01; compared with the mock si.
Figure 8
Figure 8
Effects of Coronin1C knockdown on osteoclastogenesis in vivo. Mouse calvaria were implanted with collagen sponges that were pretreated with mock or CORO1C siRNA. Sham mice underwent only periosteal avulsion of the calvaria bone. The next day, RANKL was added to the collagen sponges. The calvaria were sacrificed on day 6 for mRNA collection (a) and TRAP staining (b,c). (a) The CORO1C mRNA levels were analyzed by qPCR. ** p < 0.01; compared with the mock si. (b) TRAP-stained images of multinucleated cells induced to Sham and Mock si, CORO1C si calvaria treated with RANKL for 6 days. (c) The number of TRAP-positive cells was counted and normalized to Sham. * p < 0.05, ** p < 0.01 (n = 3).

Similar articles

Cited by

References

    1. Boyle W.J., Simonet W.S., Lacey D.L. Osteoclast differentiation and activation. Nature. 2003;423:337–342. doi: 10.1038/nature01658. - DOI - PubMed
    1. Takayanagi H., Kim S., Koga T., Nishina H., Isshiki M., Yoshida H., Saiura A., Isobe M., Yokochi T., Inoue J., et al. Induction and activation of the transcription factor NFATc1 (NFAT2) integrate RANKL signaling in terminal differentiation of osteoclasts. Dev. Cell. 2002;3:889–901. doi: 10.1016/S1534-5807(02)00369-6. - DOI - PubMed
    1. Lacombe J., Karsenty G., Ferron M. Regulation of lysosome biogenesis and functions in osteoclasts. Cell Cycle. 2013;12:2744–2752. doi: 10.4161/cc.25825. - DOI - PMC - PubMed
    1. Oikawa T., Kuroda Y., Matsuo K. Regulation of osteoclasts by membrane-derived lipid mediators. Cell. Mol. Life Sci. 2013;70:3341–3353. doi: 10.1007/s00018-012-1238-4. - DOI - PMC - PubMed
    1. Okusha Y., Tran M.T., Itagaki M., Sogawa C., Eguchi T., Okui T., Kadowaki T., Sakai E., Tsukuba T., Okamoto K. Rab11A Functions as a Negative Regulator of Osteoclastogenesis through Dictating Lysosome-Induced Proteolysis of c-fms and RANK Surface Receptors. Cells. 2020;9:2384. doi: 10.3390/cells9112384. - DOI - PMC - PubMed

LinkOut - more resources