. 2022 Jun 14;23(12):6641.
doi: 10.3390/ijms23126641.

Comparative Analysis of the Cytotoxic Effect of a Complex of Selenium Nanoparticles Doped with Sorafenib, "Naked" Selenium Nanoparticles, and Sorafenib on Human Hepatocyte Carcinoma HepG2 Cells

Affiliations

Comparative Analysis of the Cytotoxic Effect of a Complex of Selenium Nanoparticles Doped with Sorafenib, "Naked" Selenium Nanoparticles, and Sorafenib on Human Hepatocyte Carcinoma HepG2 Cells

Elena G Varlamova et al. Int J Mol Sci. .

Abstract

Despite the use of sorafenib as one of the most effective drugs for the treatment of liver cancer, its significant limitations remain-poor solubility, the need to use high doses with the ensuing complications on healthy tissues and organs, and the formation of cell resistance to the drug. At the same time, there is more and more convincing evidence of the anticancer effect of selenium-containing compounds and nanoparticles. The aim of this work was to develop a selenium-sorafenib nanocomplex and study the molecular mechanisms of its anticancer effect on human hepatocyte carcinoma cells, where nanoselenium is not only a sorafenib transporter, but also an active compound. We have created a selenium-sorafenib nanocomplex based on selenium nanoparticles with size 100 nm. Using vitality tests, fluorescence microscopy, and PCR analysis, it was possible to show that selenium nanoparticles, both by themselves and doped with sorafenib, have a pronounced pro-apoptotic effect on HepG2 cells with an efficiency many times greater than that of sorafenib (So). "Naked" selenium nanoparticles (SeNPs) and the selenium-sorafenib nanocomplex (SeSo), already after 24 h of exposure, lead to the induction of the early stages of apoptosis with the transition to the later stages with an increase in the incubation time up to 48 h. At the same time, sorafenib, at the studied concentrations, began to exert a proapoptotic effect only after 48 h. Under the action of SeNPs and SeSo, both classical pathways of apoptosis induction and ER-stress-dependent pathways involving Ca2+ ions are activated. Thus, sorafenib did not cause the generation of Ca2+ signals by HepG2 cells, while SeNPs and SeSo led to the activation of the Ca2+ signaling system of cells. At the same time, the selenium-sorafenib nanocomplex turned out to be more effective in activating the Ca2+ signaling system of cells, inducing apoptosis and ER stress by an average of 20-25% compared to "naked" selenium nanoparticles. Our data on the mechanisms of action and the created nanocomplex are promising as a platform for the creation of highly selective and effective drugs with targeted delivery to tumors.

Keywords: apoptosis; calcium signaling; cancer; gene expression; necrosis; selenium nanoparticles; selenium–sorafenib nanocomplex; sorafenib.


Conflict of interest statement

The authors declare no conflict of interest.

Figures

Figure 1
Figure 1
Proliferation assay of human hepatocarcinoma (HepG2) cells after 24-h exposure to various concentrations of sorafenib (So), selenium nanoparticles (SeNPs), and selenium–sorafenib nanocomplex (SeSo) performed by MTT assay. The optical density at 590 nm was measured, and the values of the respective untreated cells were defined as 100%. Mean values ± standard errors (SE) were determined by analysis of data from at least three independent experiments. Comparison of experimental groups regarding control, n/s—data not significant (p > 0.05), * p < 0.05, *** p < 0.001. n = 3.
Figure 2
Figure 2
Pro-apoptotic effect of 24-h incubation of HepG2 cells with various concentrations of sorafenib (So), selenium nanoparticles (SeNPs), and selenium–sorafenib nanocomplex (SeSo). (AC) X-axis: the intensity of PI fluorescence; Y-axis: the intensity of Hoechst 33342 fluorescence. Cells were stained with the probes after 24 h incubation with different concentrations of compounds. (D–F) Comparison of the effect of different concentrations of So (D), SeNPs (E), and SeSo (F) on HepG2 cell survival after 24 h incubation. Panel (D) is a calculation (technical replicate) of the data (mean ± SE) presented in panels (AC), performed in 4 repetitions. n = 4. Cell images are shown in Supplementary Figures S1–S3.
Figure 3
Figure 3
Pro-apoptotic effect of 48-h incubation of HepG2 cells with various concentrations of sorafenib (So), selenium nanoparticles (SeNPs), and selenium–sorafenib nanocomplex (SeSo). (AC) X-axis: the intensity of PI fluorescence; Y-axis: the intensity of Hoechst 33342 fluorescence. Cells were stained with the probes after 48 h incubation with different concentrations of compounds. (DF) Comparison of the effects of different concentrations of So (D), SeNPs (E), and SeSo (F) on HepG2 cell survival after 48 h incubation. Panel (D) is a calculation (technical replicate) of the data (mean ± SE) presented in panels (AC), performed in 4 repetitions. n = 4. Cell images are presented in Supplementary Figures S4–S6.
Figure 4
Figure 4
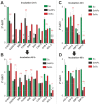
Expression analysis of genes encoding pro-apoptotic proteins (A,B) and ER-stress proteins (C,D) involved in apoptosis activation in HepG2 cells after 24 and 48-h incubation with 3 µg/mL of sorafenib (So), selenium nanoparticles (SeNPs), and selenium–sorafenib nanocomplex (SeSo). The level of expression in control cells was taken as 1. Statistical significance was assessed using paired t-test. Comparison of experimental groups with control is indicated by black asterisks. Unlabeled columns—significant values. n/s—data not significant (p > 0.05), * p < 0.05, ** p < 0.01. Significance comparisons between SeNPs and SeSo are indicated in red. n = 3.
Figure 5
Figure 5
Registration of Ca2+-dynamics in HepG2 cells upon application of various concentrations of sorafenib (So, AC), SeNPs (DF), and SeSo (GI). At the end of the experiment, 10 μM ATP was added. The figure shows the Ca2+-signals of individual cells. Number of parallel coverslips with cell cultures in each analysis = 4. n (number of cell culture passages) = 3.
Figure 6
Figure 6
Dose-dependent change in the amplitude of Ca2+ signals in response to the application of SeNPs or SeSo to the HepG2 cells. Dependence of the amplitude of Ca2+ responses of HepG2 cells on the increase of SeNPs or SeSo concentration and its approximation by a sigmoid function. Each point represents the average value of the cell Ca2+-signal amplitude in one experiment ± SE. Cellular Ca2+-signals are shown in Figure 5. To plot dose dependences, we used the results of Ca2+-dynamic measurements on three independent cell cultures. Ca2+ signals for the application of all the concentrations shown in the figure are presented in Supplementary Figure S7. n (repetition for each point) = 6.
Figure 7
Figure 7
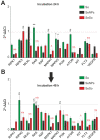
Analysis of the expression of genes encoding signal kinases in HepG2 cells after 24 (A) and 48 (B) hours of treatment with 3 µg/mL So, SeNPs, and SeSo. The level of expression in control cells was taken as 1. Statistical significance was assessed using paired t-test. Comparison of experimental groups with control is indicated by black asterisks. Unlabeled columns—significant values. n/s—data not significant (p > 0.05), * p < 0.05, ** p < 0.01. Significance comparisons between SeNPs and SeSo are indicated in red. n = 3.
Figure 8
Figure 8
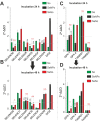
Analysis of the expression of genes encoding selenium-containing proteins in HepG2 cells after 24 (A,C) and 48 (B,D) hours of treatment with 3 µg/mL So, SeNPs, and SeSo. The level of expression in control cells was taken as 1. Statistical significance was assessed using paired t-test. Comparison of experimental groups with control is indicated by black asterisks. Unlabeled columns—significant values. n/s—data not significant (p > 0.05), * p < 0.05, ** p < 0.01. Significance comparisons between SeNPs and SeSo are indicated in red. n = 3.
Figure 9
Figure 9
Western blot analysis of selenoproteins and pro-apoptotic proteins content in HepG2 cells after 48 h treatment with 3 µg/mL So, SeNPs, and SeSo. (A) Western blot analysis of protein content. (B) Quantification of proteins content in the samples. Comparison of treated groups vs Control (intact cells): *** p <0.001 (not marked). Comparison So-treated vs SeSo-treated experimental groups marked by red. SeNPs-treated vs SeSo-treated cell marked by green. n/s—data not significant (p > 0.05), * p < 0.05, ** p < 0.01, and *** p < 0.001. n = 3.
Figure 10
Figure 10
Size and morphology of selenium nanoparticles obtained by laser ablation and selenium–sorafenib noncomplex. (A) Evolution of the hydrodynamic diameter distribution of selenium nanoparticles before (SeNPs) and after sorption of sorafenib molecules (SeSo). (B) TEM micrographs of selenium nanoparticles preparation. Scale bar—1 μm.

Similar articles

Cited by

References

    1. Ferlay J., Soerjomataram I., Dikshit R., Eser S., Mathers C., Rebelo M., Parkin D.M., Forman D., Bray F. Cancer incidence and mortality worldwide: Sources, methods and major patterns in GLOBOCAN 2012. Int. J. Cancer. 2015;136:E359–E386. doi: 10.1002/ijc.29210. - DOI - PubMed
    1. Lencioni R., de Baere T., Soulen M.C., Rilling W.S., Geschwind J.F.H. Lipiodol transarterial chemoembolization for hepatocellular carcinoma: A systematic review of efficacy and safety data. Hepatology. 2016;64:106–116. doi: 10.1002/hep.28453. - DOI - PubMed
    1. Chen F., Fang Y., Zhao R., Le J., Zhang B., Huang R., Chen Z., Shao J. Evolution in medicinal chemistry of sorafenib derivatives for hepatocellular carcinoma. Eur. J. Med. Chem. 2019;179:916–935. doi: 10.1016/j.ejmech.2019.06.070. - DOI - PubMed
    1. Wilhelm S.M., Carter C., Tang L., Wilkie D., McNabola A., Rong H., Chen C., Zhang X., Vincent P., McHugh M., et al. BAY 43-9006 exhibits broad spectrum oral antitumor activity and targets the RAF/MEK/ERK pathway and receptor tyrosine kinases involved in tumor progression and angiogenesis. Cancer Res. 2004;64:7099–7109. doi: 10.1158/0008-5472.CAN-04-1443. - DOI - PubMed
    1. Yang S., Zhang B., Gong X., Wang T., Liu Y., Zhang N. In vivo biodistribution, biocompatibility, and efficacy of Sorafenib-loaded lipid-based nanosuspensions evaluated experimentally in cancer. Int. J. Nanomed. 2016;11:2329–2343. - PMC - PubMed

LinkOut - more resources