. 2022 Jun 18;23(12):6811.
doi: 10.3390/ijms23126811.

Elevated Alpha 1(I) to Alpha 2(I) Collagen Ratio in Dermal Fibroblasts Possibly Contributes to Fibrosis in Systemic Sclerosis

Affiliations

Elevated Alpha 1(I) to Alpha 2(I) Collagen Ratio in Dermal Fibroblasts Possibly Contributes to Fibrosis in Systemic Sclerosis

Soichiro Sawamura et al. Int J Mol Sci. .

Abstract

Systemic sclerosis (SSc) is characterized by excessive collagen deposition in the skin and internal organs. Activated fibroblasts are the key effector cells for the overproduction of type I collagen, which comprises the α1(I) and α2(I) chains encoded by COL1A1 and COL1A2, respectively. In this study, we examined the expression patterns of α1(I) and α2(I) collagen in SSc fibroblasts, as well as their co-regulation with each other. The relative expression ratio of COL1A1 to COL1A2 in SSc fibroblasts was significantly higher than that in control fibroblasts. The same result was observed for type I collagen protein levels, indicating that α2(I) collagen is more elevated than α2(I) collagen. Inhibition or overexpression of α1(I) collagen in control fibroblasts affected the α2(I) collagen levels, suggesting that α1(I) collagen might act as an upstream regulator of α2(I) collagen. The local injection of COL1A1 small interfering RNA in a bleomycin-induced SSc mouse model was found to attenuate skin fibrosis. Overall, our data indicate that α2(I) collagen is a potent regulator of type I collagen in SSc; further investigations of the overall regulatory mechanisms of type I collagen may help understand the aberrant collagen metabolism in SSc.

Keywords: extracellular matrix; fibroblast; fibrosis; metabolism; systemic sclerosis; type I collagen.


Conflict of interest statement

The authors declare no conflict of interest.

Figures

Figure 1
Figure 1
Relative ratio of type 1 procollagen in control and systemic sclerosis (SSc) dermal fibroblasts. (A) Relative ratios of COL1A1 to COL1A2 mRNA were determined using real-time PCR in control, and SSc fibroblasts stimulated with or without TGF-β (n = 3 per group). (B) Control and SSc fibroblast lysates were subjected to immunoblotting. The graph shows the relative ratio of the type I collagen α1 chain to the α2 chain between control and SSc fibroblasts using densitometry (n = 4 per group). Each graph presents the mean ± standard deviation. The mean value in the control group was set as 1. * p < 0.05.
Figure 2
Figure 2
COL1A1 silencing affects COL1A2 transcript levels in fibroblasts. (A) Relative mRNA levels of type 1 procollagen in control fibroblasts transfected with COL1A1 or COL1A2 siRNA were determined using real-time PCR. The mean values in the control siRNA treatment were set as 1 (n = 3 per group). * p < 0.05 versus the control. (B) Protein levels of type I collagen in control fibroblasts transfected with COL1A1 or COL1A2 siRNA are shown. The graph shows the mean relative type I collagen levels. The mean value in control siRNA was set as 1 (n = 3 per group). * p < 0.05 versus the control. (C) Control fibroblasts transfected with COL1A1 or control siRNA were incubated for 12 h after treatment with 2.5 μg/mL actinomycin D. COL1A2 mRNA expression was analyzed using real-time PCR (and normalized to GAPDH). The values in untreated fibroblasts were set as 100% (n = 3 per group). * p < 0.05.
Figure 3
Figure 3
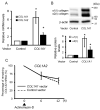
COL1A1 overexpression affects COL1A2 transcript levels in fibroblasts. (A) Relative mRNA levels of type 1 procollagen in control fibroblasts treated with virus-containing medium with a control or COL1A1 expression vector were determined using real-time PCR. The mean value of the control vector was set as 1 (n = 3 per group). * p < 0.05 versus the control (B) Protein levels of type I collagen in control fibroblasts treated with virus-containing medium with a control or COL1A1 expression vector are shown. The graph shows the mean relative type I collagen levels. The mean value in the control vector was set as 1 (n = 3 per group). * p < 0.05 versus the control. (C) Control fibroblasts transfected with virus-containing medium with a control or COL1A1 expression vector were incubated for 12 h after treatment with 2.5 μg/mL actinomycin D. COL1A2 mRNA expression was analyzed using real-time PCR (and normalized to GAPDH). The values in untreated fibroblasts were set as 100% (n = 3 per group). * p < 0.05.
Figure 4
Figure 4
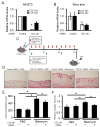
COL1A1 silencing ameliorates skin fibrosis in a bleomycin-induced SSc mouse model. (A) Relative mRNA levels of type 1 procollagen in NIH3T3 cells transfected with COL1A1 or COL1A2 siRNA were determined using real-time PCR. The mean values of the control siRNA treatment were set as 1 (n = 3 per group). * p < 0.05 versus the control. (B) Relative mRNA levels of procollagen in mice skin injected with COL1A1 or control siRNA were determined using real-time PCR. The mean values in the control siRNA treatment were set as 1 (n = 5 per group). * p < 0.05 versus the control. (C) The protocol for (D) to (F) is shown. Bleomycin or PBS were injected intradermally into the back skin of C57BL/6 mice every other day for three weeks. COL1A1 or control siRNA mixed with atelocollagen were also injected into the back skin once weekly (for a total of three times). The back skin was obtained on the day after final bleomycin injection (D). Mouse skin sections were stained with hematoxylin and eosin. Representative results are shown. Scale bar = 200 μm. (E) Graph showing the results of dermal thickness (n = 5 per group) (F) Collagen content in mouse skin was measured using a hydroxyproline assay. Values are normalized relative to the PBS control group (n = 5 per group). * p < 0.05.

References

    1. Korn J. Immunologic aspects of scleroderma. Curr. Opin. Rheumatol. 1989;1:479–484. doi: 10.1097/00002281-198901040-00011. - DOI - PubMed
    1. Mauch C., Kreig T. Fibroblast-matrix interactions and their role in the pathogenesis of fibrosis. Rheum. Dis. Clin. N. Am. 1990;16:93–107. doi: 10.1016/S0889-857X(21)01042-5. - DOI - PubMed
    1. Trojanowska M., LeRoy E.C., Eckes B., Krieg T. Pathogenesis of fibrosis: Type 1 collagen and the skin. J. Mol. Med. 1998;76:266–274. doi: 10.1007/s001090050216. - DOI - PubMed
    1. Roberts A.B., Sporn M.B., Assoian R.K., Smith J.M., Roche N.S., Wakefield L.M., Heine U.I., Liotta L.A., Falanga V., Kehrl J.H., et al. Transforming growth factor type beta: Rapid induction of fibrosis and angiogenesis in vivo and stimulation of collagen formation in vitro. Proc. Natl. Acad. Sci. USA. 1986;83:4167–4171. doi: 10.1073/pnas.83.12.4167. - DOI - PMC - PubMed
    1. Roberts A.B., Heine U.I., Flanders K.C., Sporn M.B. Transforming growth factor-beta. Major role in regulation of extracellular matrix. Ann. N. Y. Acad. Sci. 1990;580:225–232. doi: 10.1111/j.1749-6632.1990.tb17931.x. - DOI - PubMed

LinkOut - more resources