. 2022 Jun 20;23(12):6855.
doi: 10.3390/ijms23126855.

Microtube Array Membrane Encapsulated Cell Therapy: A Novel Platform Technology Solution for Treatment of Alzheimer's Disease

Affiliations

Microtube Array Membrane Encapsulated Cell Therapy: A Novel Platform Technology Solution for Treatment of Alzheimer's Disease

Shu-Mei Chen et al. Int J Mol Sci. .

Abstract

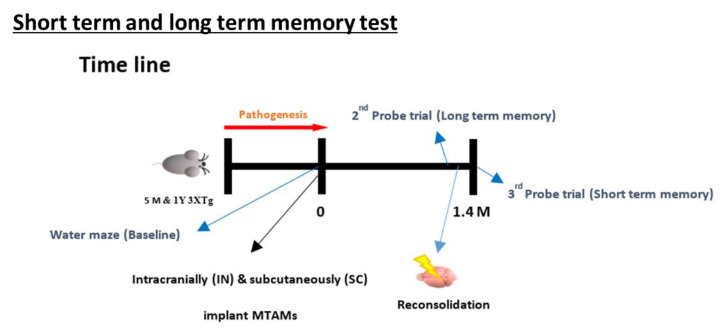
Alzheimer's disease is the most frequent form of dementia in aging population and is presently the world's sixth largest cause of mortality. With the advancement of therapies, several solutions have been developed such as passive immunotherapy against these misfolded proteins, thereby resulting in the clearance. Within this segment, encapsulated cell therapy (ECT) solutions that utilize antibody releasing cells have been proposed with a multitude of techniques under development. Hence, in this study, we utilized our novel and patented Microtube Array Membranes (MTAMs) as an encapsulating platform system with anti-pTau antibody-secreting hybridoma cells to study the impact of it on Alzheimer's disease. In vivo results revealed that in the water maze, the mice implanted with hybridoma cell MTAMs intracranially (IN) and subcutaneously (SC) showed improvement in the time spent the goal quadrant and escape latency. In passive avoidance, hybridoma cell loaded MTAMs (IN and SC) performed significantly well in step-through latency. At the end of treatment, animals with hybridoma cell loaded MTAMs had lower phosphorylated tau (pTau) expression than empty MTAMs had. Combining both experimental results unveiled that the clearance of phosphorylated tau might rescue the cognitive impairment associated with AD.

Keywords: Alzheimer’s disease (AD); encapsulated cell therapy; microtube array membrane (MTAMs); neurodegenerative disease; passive immunotherapy.


Conflict of interest statement

The authors declare no conflict of interest.

Figures

Figure 1
Figure 1
(AF) Transverse view of the SEM images of electrospun PSF MTAMs at increasing magnification (50×, 200×, 500×, 1000×, 5000× and 10,000×) and (G,H) Top view of the SEM images at a magnification 1000× and 5000×. The lumen dimensions of the electrospun PSF MTAMs were about 77.54 ± 4.3 µm × 35.64 ± 4.2 µm (height × width), with a lumen wall thickness of about 4.70 ± 0.3 µm, and a pore size of 167.75 ± 50 nm. (IK) Distribution of the MTAM length, width and pore size. (L) Optical microscopy images of the hybridoma cells cultured on TCPs, as reference. (M,N) Optical microscopy images of the PSF MTAMs loaded with hybridoma. (O) Distribution size of the hybridoma that were loaded in the PSF MTAMs which averages around 14.4 ± 0.4 µm in diameter (n = 6).
Figure 2
Figure 2
(AL) Fluorescence microscopy (4× magnification) of Live-Dead stain of hybridoma cells loaded within PSF MTAMs at day 1 (AC), day 3 (DF), day 5 (GI) and day 7 (JL). (M) Total fluorescence density of hybridoma cells loaded within the PSF MTAMs at day 7, which revealed significantly higher live hybridoma cells than the dead hybridoma cells. (N) Overall viability of hybridoma cells assayed with MTT assay which revealed statistically significant increase between the readings on day 0 versus the viability on day 7. Two-way ANOVA with Sidak’s multiple comparisons tests. * p < 0.05, ** p < 0.01, *** p < 0.001. Error bars in data represented +/SD (n = 3).
Figure 3
Figure 3
(A) In vitro cell viability of hybridoma cells loaded within PSF MTAMs quantified via MTT assay. At day 0, the cell density loaded within the PSF MTAMs were 2 × 10⁴/10 µL. At day 7, 14 and 21 the registered viability increased to 231 ± 5%, 346 ± 26%, and 340 ± 21%, respectively. (B) Concentration of IgG2b antibody detected within the culture medium of various culture settings at day 21. One-way ANOVA with Tukey’s multiple comparisons tests: Significant impact p-value ** p < 0.01, *** p < 0.001, **** p < 0.0001. Error bars in data represented +/SD. (n = 6) (C) Hybridoma supernatant (anti-tau IgG2b)-immunoreactivity in the pyramidale layer of the hippocampus in human tau (1N4R) transgenic mice. Note the strong immunoreactivity in neurons and neurites. Scale: 50 µm. (D) Immunoblotting using the hybridoma supernatant (anti-tau IgG2b) on different protein samples: 1. six recombinant tau isoforms (0N3R, 1N3R; 0N4R; 1N4R; 2N3R; 2N4R); 2: human healthy control brain homogenate; 3: Alzheimer’s disease patient brain homogenate; note the typical tau triplet (asterisks); 4: mouse brain homogenate; 5: human tau (1N4R) transgenic mouse brain homogenate; 6: lysate of SY5Y neuroblastoma cell transfected with a fragment of tau protein (amino acids 1–265) indicating that the epitope is in the amino-terminal part of the protein. Molecular weight (arrows) is given on the left of the blot. (E) Images of the implanted PSF MTAM loaded with hybridoma cells. (F) In vivo assay of the IgG2b antibody at day 90. Animal model with PSF MTAMs loaded with hybridoma cells registered a concentration of 0.25 ± 0.07 mg/mL, which was statistically significantly greater than the animal model with the empty PSF MTAMs.
Figure 4
Figure 4
Morris water maze escape latency of the respective models. (A) Design of the Morris water maze. The respective study groups were assessed with this system, namely wild-type (without treatment), intracranially (IN) implanted empty PSF MTAMs, subcutaneously (SC) implanted empty PSF MTAMs, IN implanted hybridoma loaded PSF MTAMs, and SC implanted hybridoma loaded PSF MTAMs. (B) Escape latency of the respective mouse model study groups analyzed with Two-way ANOVA Tukey’s multiple comparisons tests (Empty MTAMs vs cell loaded: IN group p-value = 0.37; SC group p-value = 0.58). (C) Travel time in the goal quadrant (long term memory testing): mouse models of the study groups with IN and SC implanted with hybridoma PSF MTAMs registered a value of 33 ± 11 s and 46 ± 10 s respectively (baseline). After 1.4 months, this value reduced to 31 ± 4 s and 36 ± 8 s respectively. (D) Travel time in the goal quadrant (short term memory testing): the mouse models receiving hybridoma cell loaded PSF MTAMs that were implanted IN and SC registered a reading of 30 ± 12 s and 31 ± 22 s respectively, after 1.4 months of treatment.
Figure 5
Figure 5
Passive avoidance test mouse models of day 1 to day 3 (baseline) and day 46 of the respective study groups. On day 3, wild-type mouse models registered a step through latency of 229 ± 84 s when compared to the 3xTg mouse with empty PSF MTAM implanted which registered a reading of 61 ± 103 s. At day 46, a statistically significantly different step through latency was observed when comparing the 3xTg mouse with empty PSF MTAM implanted and those implanted with hybridoma cell loaded MTAMs implanted; registering a reading of, intracranial implantation: 41 ± 39 s; vs 205 ± 124 s and subcutaneous implantation 50 ± 55 s vs 190 ± 112 s respectively (3xTg mouse implanted with empty MTAMs versus those implanted with cell loaded MTAMs). Two-way ANOVA with Tukey’s multiple comparisons tests. Significant impact p-value * p < 0.05, ** p < 0.01. Error bars in data represented +/SD. Wild-type, n = 7, empty MTAMs IN and SC, n = 5 and n = 2; hybridoma cell loaded MTAMs IN and SC, n = 7 and n = 2.
Figure 6
Figure 6
(A) Immunohistochemistry of hybridoma cell loaded PSF MTAMs. The nucleus of the hybridoma cells were stained blue from the hematoxylin dye, while the IgG2b antibodies were stained brown. (B) Contrary to (A), the lack of blue/brown staining were observed within the empty PSF MTAMs. (CE) Tissue section of the brain of mouse models of; (C) Wild-type C57BL/6J mice without treatment (n = 5), (D) Triple-transgenic (3xTg) mice with empty PSF MTAM (IN; n = 3), and (E) Triple-transgenic (3xTg) mice with hybridoma cell loaded PSF MTAM (IN; n = 4), along with the corresponding magnified images. IgG2b antibodies appeared to be brown within nucleus, and blue when not within nucleus (counterstained by hematoxylin dye). (FH) Percentage of IgG2b positive signal in a single cell (y-axis) with hematoxylin signal (x-axis); and (IK) percentages of IgG2b positive signal in a single cell per IgG2b positive area. (L) Graph depicting the IgG2b positive signal in a single cell with the Triple-transgenic (3xTg) mice with hybridoma cell loaded PSF MTAM (IN) registering the highest percentage of 18 ± 10% as opposed to those in the wild-type C57BL/6J mice without treatment with a percentage of 7 ± 2%; and (M) The corresponding IgG2b antibody distribution in total area.
Figure 7
Figure 7
(AC) Tissue section of the brain of mouse models of wild-type C57BL/6J mice without treatment (n = 5), Triple-transgenic (3xTg) mice with empty PSF MTAM (IN; n = 3), and Triple-transgenic (3xTg) mice with hybridoma cell loaded PSF MTAM (IN; n = 4) along with the corresponding magnified sections. P-Tau (detected via Ser199/Ser202 antibodies) appeared to be brown in color. (DF) Percentage of P-Tau positive signal in a single cell (y-axis) with hematoxylin signal (x-axis); and (GI) percentages of P-Tau positive signal in a single cell per P-Tau positive area. (J) Graph depicting the P-Tau positive signal in a single cell with the Triple-transgenic (3xTg) mice with empty PSF MTAM (IN) registering the highest percentage of 15 ± 11% as opposed to those in the wild-type C57BL/6J mice (6 ± 3%) and Triple-transgenic (3xTg) mice with hybridoma cell loaded PSF MTAM (IN) (10 ± 3%) respectively. (K) The corresponding IgG2b antibody distribution in total area. (L) The total Tau levels of the respective study groups.
Figure 8
Figure 8
(A) Western blot of the respective study groups of the cortex and hippocampus regions targeting the P-Tau protein (79 kDa) and beta-actin (49 kDa). (B) Triple-transgenic (3xTg) mice with hybridoma cell loaded PSF MTAM (IN) registered a P-Tau/Beta Actin loading control value at 0.41 ± 0.23 (cortex) and 0.24 ± 0.14 (hippocampus), respectively. Conversely, Triple-transgenic (3xTg) mice with empty PSF MTAM (IN) study group registered the highest values at 0.48 ± 0.17 (cortex) and 0.51 ± 0.11 (hippocampus), respectively, while the wild-type C57BL/6J mice without treatment registered the lowest corresponding values at 0.15 ± 0 (cortex) and 0.16 ± 0.06 (hippocampus).
Figure 9
Figure 9
Overview of the animal model timeline. (Bottom) Overview on the memory timeline leading up to the Morris water maze for the examination of the short term and long term memory of the respective mice model.
Figure 10
Figure 10
Timeline leading up to the test of the short-term and long-term memory test of the MWM. The procedure involves the training of the mice from day 1–6 based on distal spatial cues to locate the platform where the mice are placed in different random quadrant for it to search for the platform; assessed by the escape latency and time in quadrants in which submerged platform is located in. With these values as the baseline, a probe test was carried out at 1.4 months later where the submerged platform was removed and the above-mentioned tests were repeated. Within 24 h of conducting the long-term memory test, a reconsolidation process was carried out by replacing the submerged platform and repeating the steps outlined in the baseline section. After 24 h, another probe test was carried out again by removing the submerged. The escape latency and time in quadrant at this time will form the basis for the short-term memory [48].

Similar articles

Cited by

References

    1. Alzheimer’s Association 2019 Alzheimer’s disease facts and figures. Alzheimer’s Dement. 2019;15:321–387. doi: 10.1016/j.jalz.2019.01.010. - DOI - PubMed
    1. Hebert L.E., Weuve J., Scherr P.A., Evans D.A. Alzheimer disease in the United States (2010–2050) estimated using the 2010 census. Neurology. 2013;80:1778–1783. doi: 10.1212/WNL.0b013e31828726f5. - DOI - PMC - PubMed
    1. Osimani A., Berger A., Friedman J., Porat-Katz B.-S., Abarbanel J.M. Neuropsychology of vitamin B₁₂ deficiency in elderly dementia patients and control subjects. J. Geriatr. Psychiatry Neurol. 2005;18:33–38. doi: 10.1177/0891988704272308. - DOI - PubMed
    1. Chai B., Gao F., Wu R., Dong T., Gu C., Lin Q., Zhang Y. Vitamin D deficiency as a risk factor for dementia and Alzheimer’s disease: An updated meta-analysis. BMC Neurol. 2019;19:284. doi: 10.1186/s12883-019-1500-6. - DOI - PMC - PubMed
    1. Ferrer I., Gomez-Isla T., Puig B., Freixes M., Ribe E., Dalfo E., Avila J.J.C.A.R. Current advances on different kinases involved in tau phosphorylation, and implications in Alzheimer’s disease and tauopathies. Curr. Alzheimer Res. 2005;2:3–18. doi: 10.2174/1567205052772713. - DOI - PubMed