. 2022 Jun 20;23(12):6872.
doi: 10.3390/ijms23126872.

IgG from Adult Atopic Dermatitis (AD) Patients Induces Nonatopic Neonatal Thymic Gamma-Delta T Cells (γδT) to Acquire IL-22/IL-17 Secretion Profile with Skin-Homing Properties and Epigenetic Implications Mediated by miRNA

Affiliations

IgG from Adult Atopic Dermatitis (AD) Patients Induces Nonatopic Neonatal Thymic Gamma-Delta T Cells (γδT) to Acquire IL-22/IL-17 Secretion Profile with Skin-Homing Properties and Epigenetic Implications Mediated by miRNA

Beatriz Oliveira Fagundes et al. Int J Mol Sci. .

Abstract

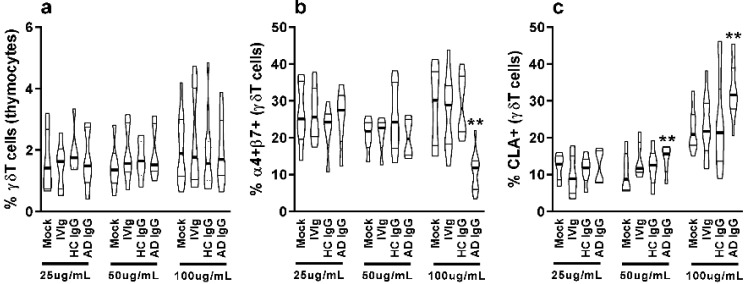
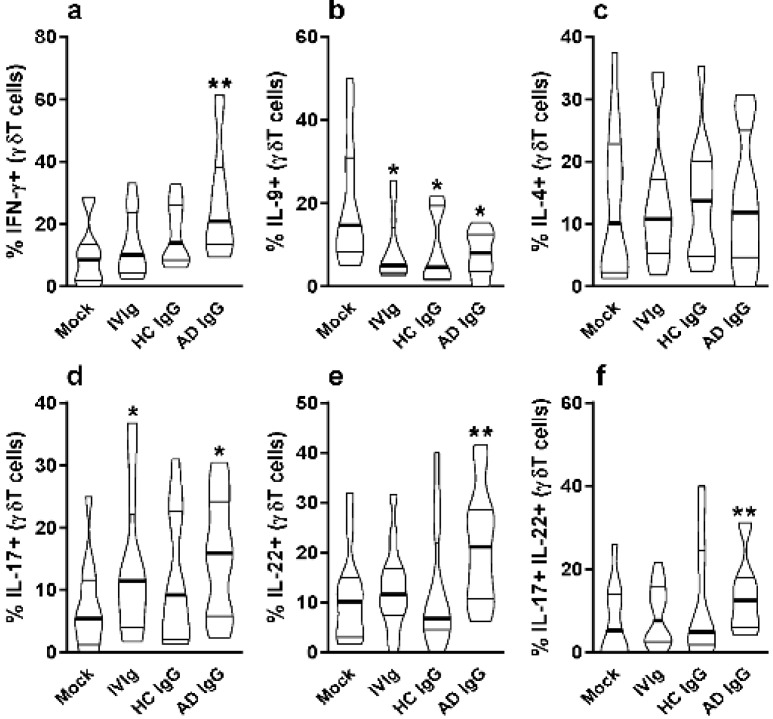
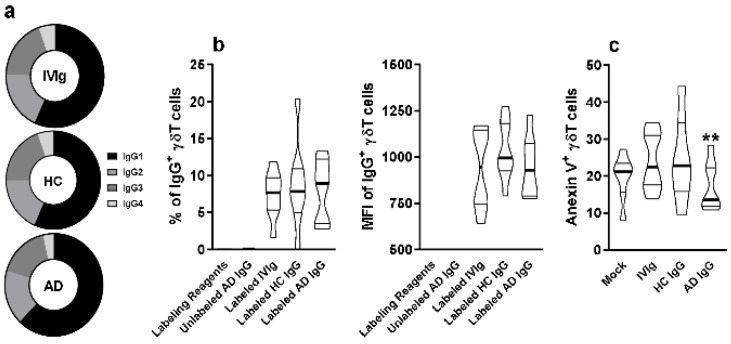
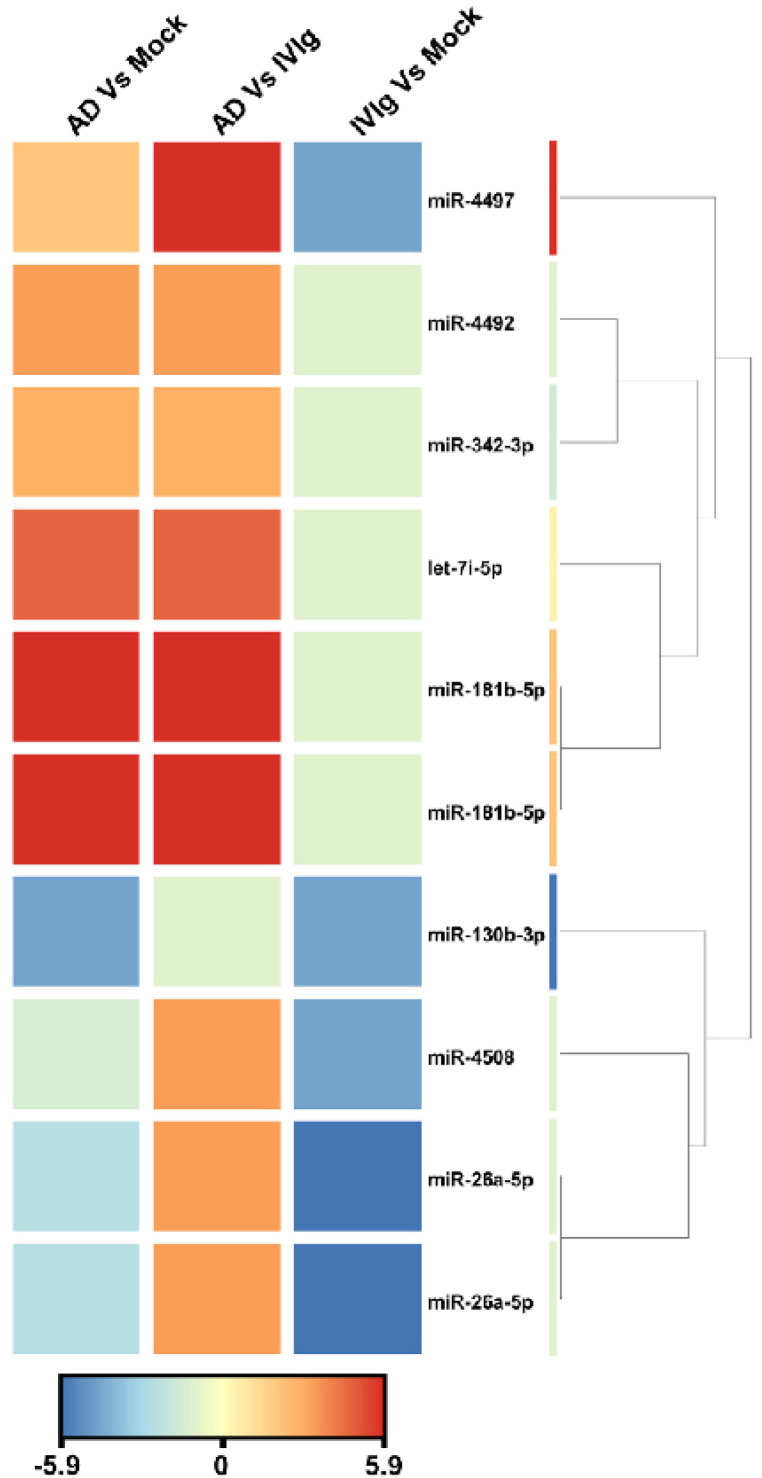
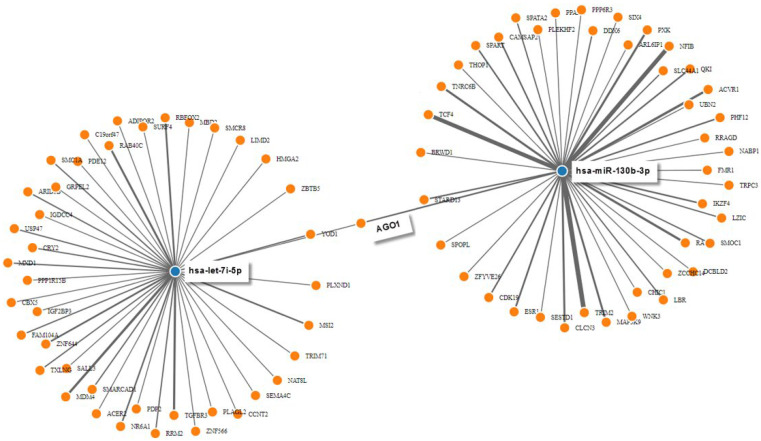
γδT cells mature in the human thymus, and mainly produce IL-17A or IFN-γ, but can also produce IL-22 and modulate a variety of immune responses. Here, we aimed to evaluate whether IgG from AD patients (AD IgG) can functionally modulate thymic nonatopic γδT cells. Thymic tissues were obtained from 12 infants who had not had an atopic history. Thymocytes were cultured in mock condition, or in the presence of either AD IgG or therapeutic intravenous IgG (IVIg). Following these treatments, intracellular cytokine production, phenotype, and microRNA expression profiles were investigated. AD IgG could downregulate α4β7, upregulate CLA, and induce the production of IFN-γ, IL-17, and IL-22 in γδT cells. Although both AD IgG and IVIg could directly interact with γδT cell membranes, AD IgG could reduce γδT cell apoptosis. AD IgG could upregulate nine miRNAs compared to IVIg, and six when compared to the mock condition. In parallel, some miRNAs were downregulated. Target gene prediction and functional analysis indicated that some target genes were enriched in the negative regulation of cellular transcription. This study shows that AD IgG influences the production of IL-17 and IL-22 by intrathymic nonatopic γδT cells, and demonstrates epigenetic implications mediated by miRNAs.

Keywords: IL-17; IL-22; IgG; atopic dermatitis; human; miRNA; p-bodies; thymus; γδT cells.


Conflict of interest statement

The authors declare no conflict of interest.

Figures

Figure 1
Figure 1
Purified adult AD IgG’s effect on the homing phenotype of infant nonatopic intra-thymic γδT cells. Thymocytes from children under 7 days old (n = 12) were evaluated after 6 days in culture in RPMI medium supplemented with FCS in the absence (mock) or presence of 25, 50, or 100 µg/mL of commercially used purified IgG (IVIg), or IgG purified from health controls (HC IgG) or IgG purified from adult AD patients (AD IgG). Flow cytometry was used to determine the frequency of γδT (CD3+γδTCR+) cells (a) or the expression of α4+β7+ (b) and CLA (c) in γδT (CD3+γδTCR+). Violin plots depict the distribution of values from lowest to highest, with thick lines representing quartiles, and bold lines representing the mean. ** p ≤ 0.05 when compared to Mock, IVIg, and HC IgG conditions.
Figure 2
Figure 2
Effect of purified adult AD IgG on the cytokine production of infant nonatopic intra-thymic γδT cells. Thymocytes from children under 7 days old (n = 12) were evaluated after 6 days in culture in RPMI medium supplemented with FCS in the absence (mock) or presence of 100 µg/mL of commercially used purified IgG (IVIg) or IgG purified from health controls (HC IgG) or IgG purified from adult AD patients (AD IgG). Flow cytometry was used to determine the intracellular production of IFN-γ (a), IL-9 (b), IL-4 (c), IL-17 (d), IL-22 (e) or the coproduction of IL-17 and IL-22 (f) were evaluated in γδT (CD3+γδTCR+) cells. Violin plots shows the distribution of values from lowest to highest, with thick lines representing quartiles and bold lines representing the mean. * p ≤ 0.05 when compared to the mock condition. ** p ≤ 0.05 when compared to the Mock, IVIg, and HC IgG conditions.
Figure 3
Figure 3
Evaluation of IgG subclass frequency and their direct interaction with thymic γδT cells. (a) Frequency of IgG1, IgG2, IgG3, and IgG4 isotypes in IVIg and purified AD IgG was evaluated. Thymocytes from children under 7 days old (n = 12) were incubated for 30 min with labeling kit reagents (Without IgG), unlabeled AD IgG, labeled IVIg, labeled HC IgG, or labeled AD IgG. (b) Frequency and (c) intensity of IgG staining (IgG+) or (c) frequency of Anexin V staining (Anexin V+) on thymic γδT (CD3+γδTCR+) cells. Pie charts represent the frequency of each IgG isotype within the total amount of detected IgG. Violin plots represents values distribution from minimum to maximum, thick lines represent quartiles, and bold lines represent the mean. ** p ≤ 0.05 when compared to the Mock, IVIg, and HC IgG conditions.
Figure 4
Figure 4
Unsupervised hierarchical clustering of significantly dysregulated miRNAs and samples from the Illumina deep sequencing data. The heat map contains 10 miRNAs differentially expressed in AD vs. Mock control, AD vs. IVIg, and IVIg vs. mock control. The miRNA clustering tree is displayed on the right. The color scale indicates the relative expression levels of miRNA across all samples. Red indicates that the expression levels are higher than the mean, whereas blue indicates that the expression levels are lower than the mean. Each row represents one mature miRNA, and each column represents one sample. AD: thymocytes stimulated by IgG from patients with atopic dermatitis; IVIg: thymocytes stimulated by therapeutic intravenous IgG.
Figure 5
Figure 5
Predicted interaction between miRNAs and target genes. MiRNA-target gene interactions were generated manually by intersecting individual networks generated from miRWalk target gene prediction data. Only hsa-miR-130b-3p and hsa-let-7i-5p are displayed for clarity. Blue dots represent miRNAs that interact with their target genes, which are represented by orange dots.

Similar articles

Cited by

References

    1. Ferreira L.M. Gammadelta T cells: Innately adaptive immune cells? Int. Rev. Immunol. 2013;32:223–248. doi: 10.3109/08830185.2013.783831. - DOI - PubMed
    1. Brenner M.B., McLean J., Dialynas D.P., Strominger J.L., Smith J.A., Owen F.L., Seidman J.G., Ip S., Rosen F., Krangel M.S. Identification of a putative second T-cell receptor. Nature. 1986;322:145–149. doi: 10.1038/322145a0. - DOI - PubMed
    1. Lanier L.L., Serafini A.T., Ruitenberg J.J., Cwirla S., Federspiel N.A., Phillips J.H., Allison J.P., Weiss A. The gamma T-cell antigen receptor. J. Clin. Immunol. 1987;7:429–440. doi: 10.1007/BF00915052. - DOI - PubMed
    1. Satyanarayana K., Hata S., Devlin P., Roncarolo M.G., De Vries J.E., Spits H., Strominger J.L., Krangel M.S. Genomic organization of the human T-cell antigen-receptor alpha/delta locus. Proc. Natl. Acad. Sci. USA. 1988;85:8166–8170. doi: 10.1073/pnas.85.21.8166. - DOI - PMC - PubMed
    1. de Sousa T.R., Victor J.R. Natural Self-Ligand Gamma Delta T Cell Receptors (γδTCRs) Insight: The Potential of Induced IgG. Vaccines. 2020;8:436. doi: 10.3390/vaccines8030436. - DOI - PMC - PubMed

LinkOut - more resources