. 2022 Jun 20;23(12):6873.
doi: 10.3390/ijms23126873.

Adaptation of Oxidative Phosphorylation Machinery Compensates for Hepatic Lipotoxicity in Early Stages of MAFLD

Affiliations

Adaptation of Oxidative Phosphorylation Machinery Compensates for Hepatic Lipotoxicity in Early Stages of MAFLD

Pia Fahlbusch et al. Int J Mol Sci. .

Abstract

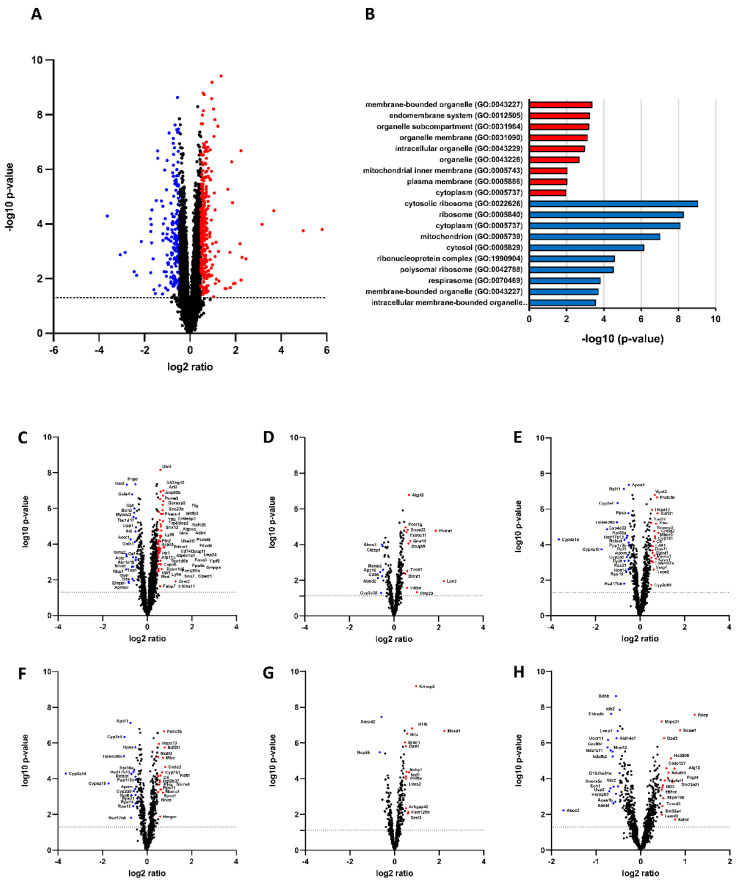
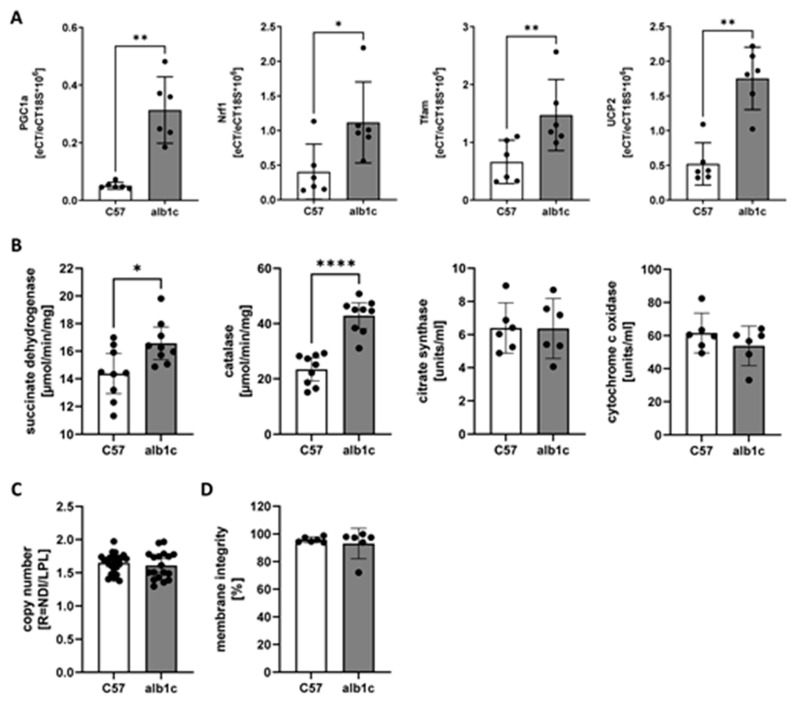
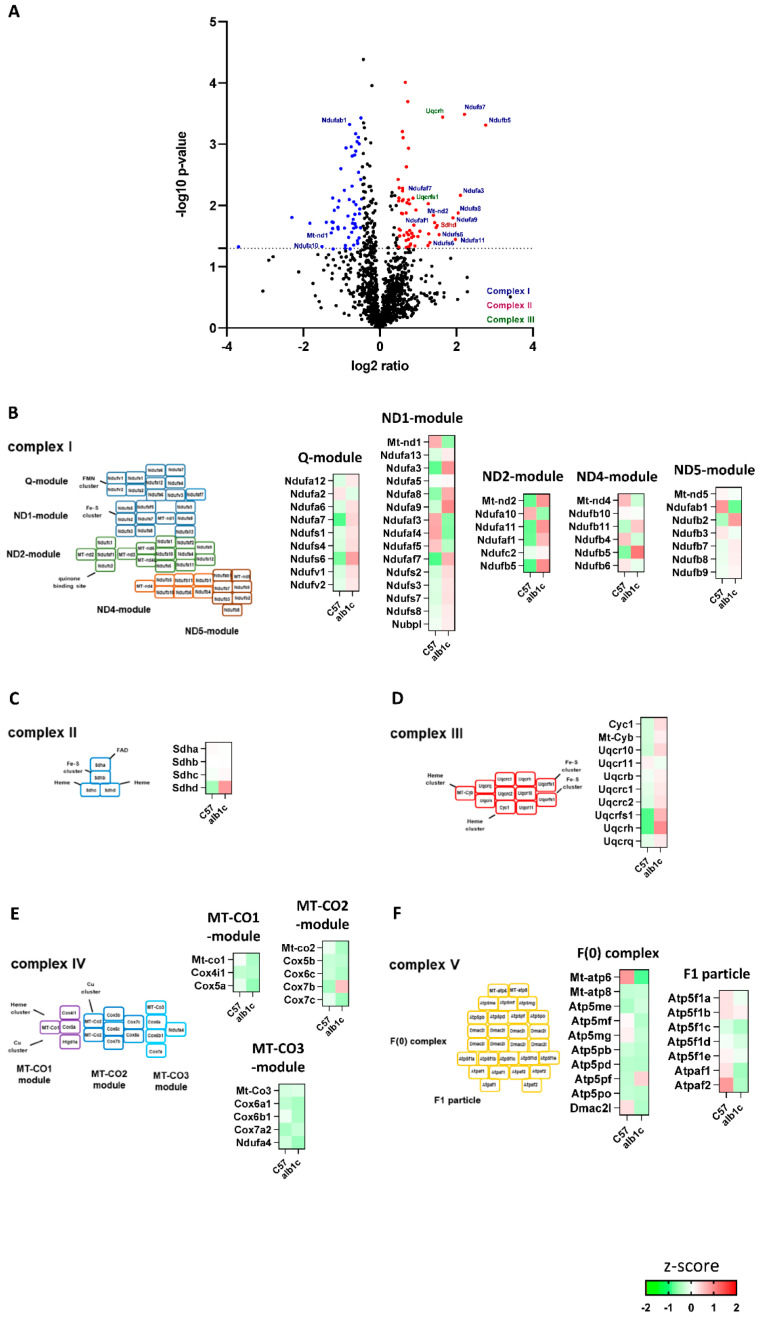
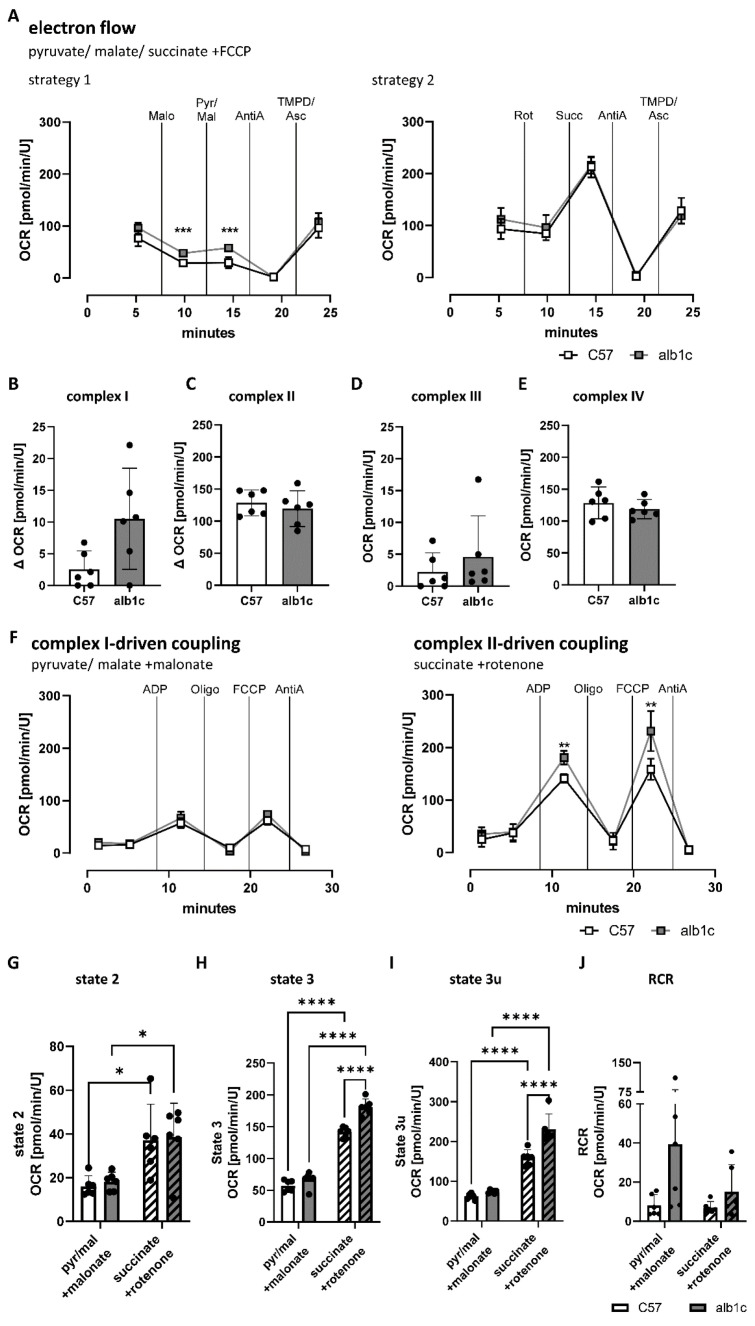
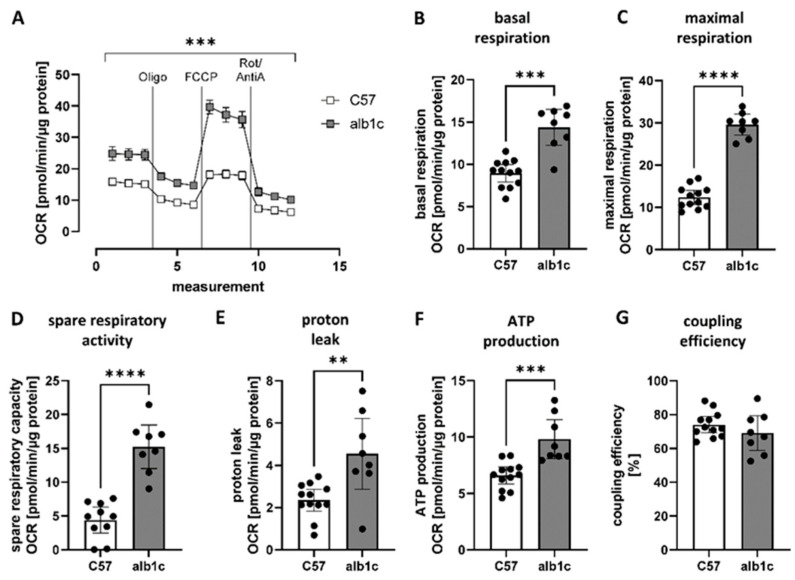
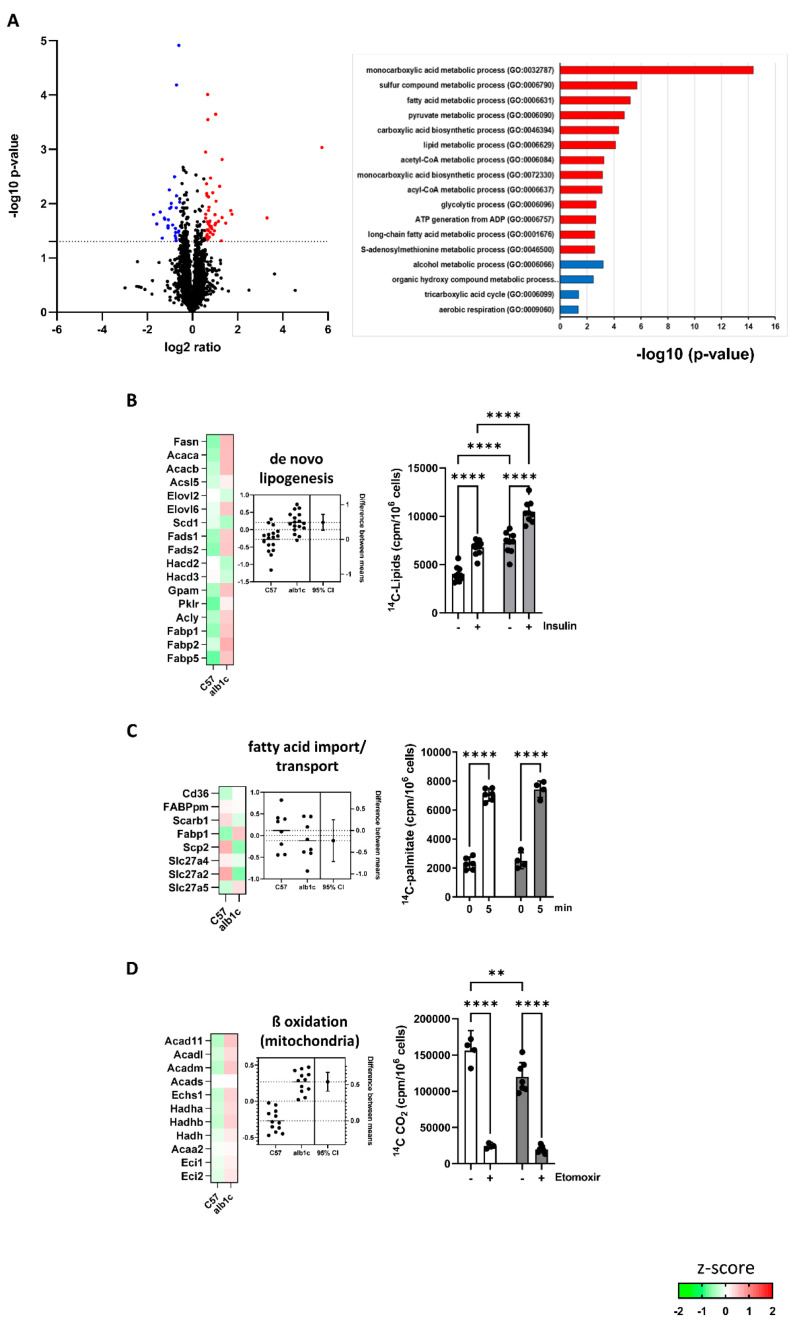
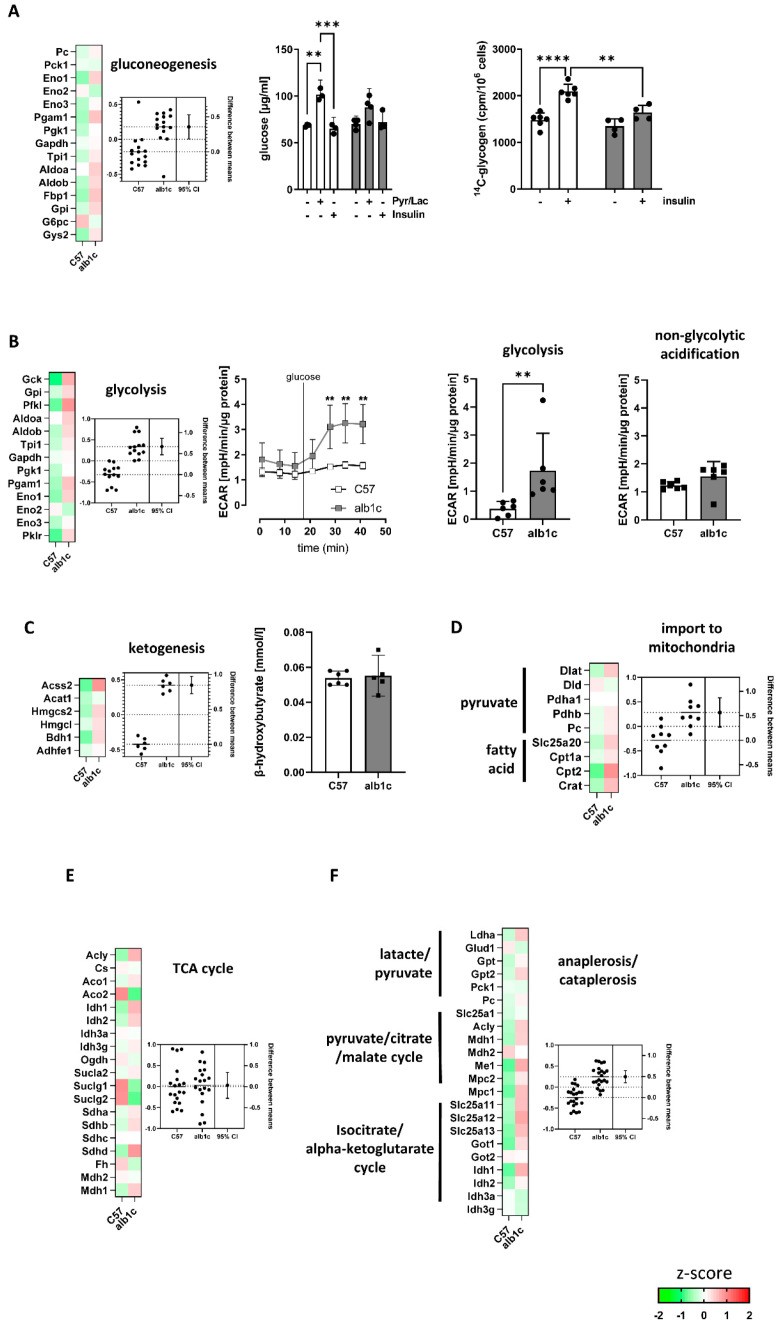
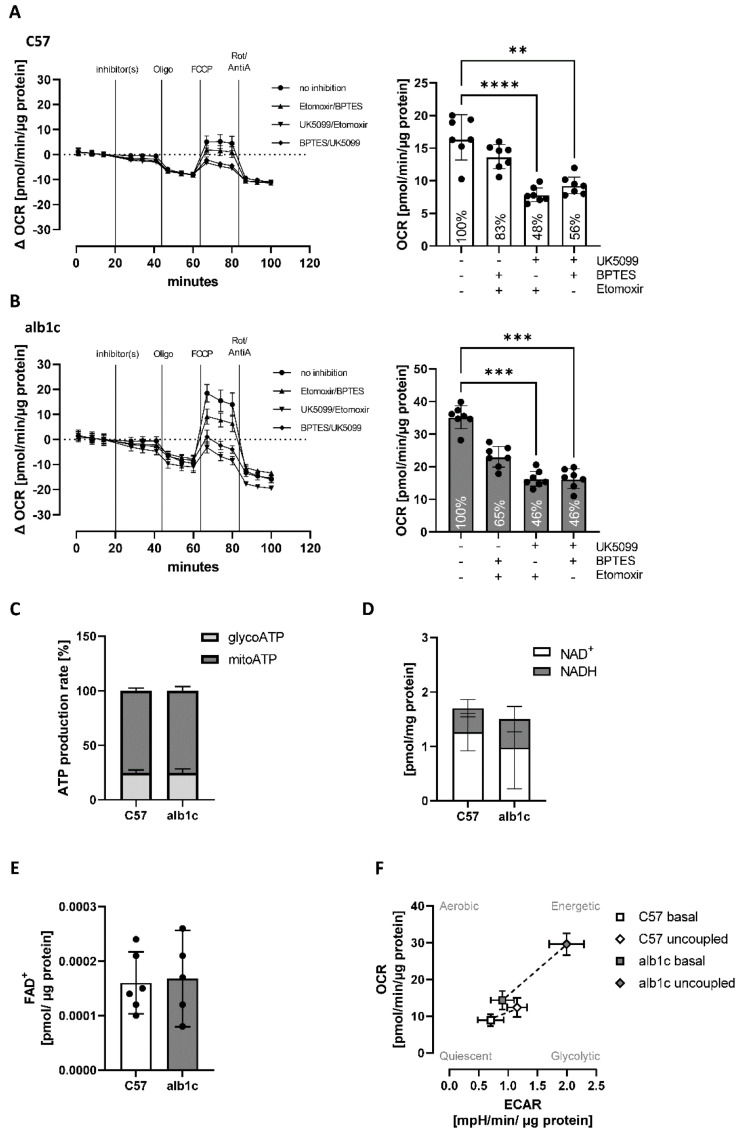
Alterations in mitochondrial function are an important control variable in the progression of metabolic dysfunction-associated fatty liver disease (MAFLD), while also noted by increased de novo lipogenesis (DNL) and hepatic insulin resistance. We hypothesized that the organization and function of a mitochondrial electron transport chain (ETC) in this pathologic condition is a consequence of shifted substrate availability. We addressed this question using a transgenic mouse model with increased hepatic insulin resistance and DNL due to constitutively active human SREBP-1c. The abundance of ETC complex subunits and components of key metabolic pathways are regulated in the liver of these animals. Further omics approaches combined with functional assays in isolated liver mitochondria and primary hepatocytes revealed that the SREBP-1c-forced fatty liver induced a substrate limitation for oxidative phosphorylation, inducing enhanced complex II activity. The observed increased expression of mitochondrial genes may have indicated a counteraction. In conclusion, a shift of available substrates directed toward activated DNL results in increased electron flows, mainly through complex II, to compensate for the increased energy demand of the cell. The reorganization of key compounds in energy metabolism observed in the SREBP-1c animal model might explain the initial increase in mitochondrial function observed in the early stages of human MAFLD.

Keywords: fatty liver; hepatic metabolism; mitochondria; substrate; subunit.


Conflict of interest statement

The authors declare no conflict of interest. The funders had no role in the design of the study; in the collection, analyses, or interpretation of data; in the writing of the manuscript; or in the decision to publish the results.

Figures

Figure 1
Figure 1
Impact of constitutive overexpression of SREBP-1c on hepatic transcriptome. (A) The log2 fold changes of coding and noncoding RNA abundance in alb-SREBP-1c vs. C57Bl6 mice (n = 8 animals per condition). 22,026 differentially abundant RNA species were detected. Upregulated (red; n = 314) or downregulated proteins (blue; n = 191) were determined by Student’s t-test (p > 0.05) with a 1.5-fold regulation. (B) RNA species regulated by alb-SREBP-1c were subjected to functional enrichment analyses. Significantly enriched pathways (FDR < 0.1) are shown for GO biological process ontology. A modified Fisher’s exact test was used for the functional enrichment analyses. p values were corrected for multiple testing using the Benjamini–Hochberg (FDR) method. (CH) Transcriptomic signature of cellular compartments: (C) Cytoplasma, (D) Plasma membrane, (E) Endoplasmic reticulum and Golgi apparatus, (F) Endosome and Lysosome, (G) Nucleus, (H) Mitochondria and Peroxisomes.
Figure 2
Figure 2
Mitochondrial gene expression and enzyme activities. (A) Expression of mitochondrial transcripts Pgc1a, Nrf1, Tfam and Ucp2. (B) Enzyme activities of succinate dehydrogenase, catalase, citrate synthase and cytochrome c oxidase. (C) Mitochondrial DNA copy number in relation to genomic DNA. (D) Mitochondrial membrane integrity from fractions of enriched liver mitochondria used for functional analyses based on cytochrome c oxidase enzyme activities. Data are expressed as means (±95% CI, n = 6–24 per group). Statistics: Mann–Whitney test, * p < 0.05, ** p < 0.01, **** p < 0.0001.
Figure 3
Figure 3
Regulated mitochondrial proteins in early stage of MAFLD. (A) The log2 fold changes of protein abundance in fractions of enriched mitochondria from alb-SREBP-1c vs. C57Bl6 liver tissue (n = 6 animals per condition). 1424 proteins were detected. Upregulated (red; n = 48) or downregulated proteins (blue; n = 40) were determined by Student’s t-test (p > 0.05) with at least 1.5-fold regulation. (BF) Z-score analyses of protein abundance for individual complex I, II, III, IV, and V subunits: Red identifies upregulation of proteins, and green identifies downregulation. White identifies no differences.
Figure 4
Figure 4
Electron flow capacity and coupling efficiency of mitochondrial ETC in alb-SREBP-1c mitochondria. Oxidative capacity was measured in response to manipulation of the electron transport chain (ETC) in fractions of enriched mitochondria from alb-SREBP-1c vs. C57Bl6 control livers. (A) The electron flow was assayed in the uncoupled state of the mitochondrial membrane with a combination of pyruvate, malate, and succinate as substrates for oxidation using two different injection strategies. Recorded oxygen consumption rates (OCR) over the time course of the assays are shown. (B) Complex I-specific OCR as difference between stimulation of complex I with pyruvate and malate and inhibition of complex II with malonate. (C) Complex II-specific OCR as difference between stimulation of complex II with succinate and inhibition of complex I with rotenone. (D) Complex III-specific OCR after inhibition with antimycin A and (E) complex IV-specific OCR after stimulation with TMPD/ascorbate. (F) Coupling experiments were conducted by measuring OCR individually for complex I- and II-driven mitochondrial coupling in fractions of isolated liver mitochondria. (G) Basal respiration (state 2), (H) oxidative phosphorylation (state 3), (I) maximal respiratory capacity (state 3u), and (J) respiratory control ratio were calculated. Data are expressed as means (±95% CI, n = 6 per group). Statistics: Mann–Whitney test or two-way ANOVA with Tukey’s multiple comparison, * p < 0.05, ** p < 0.01, *** p < 0.001, **** p < 0.0001. Malo: Malonate, Pyr/Mal: Pyruvate and Malate, AntiA: Antimycin A, TMPD/Asc: TMPD and Ascorbate, Rot: Rotenone, Succ: Succinate, Oligo: Oligomycin, C57: C57Bl6, alb1c: alb-SREBP-1c.
Figure 5
Figure 5
Characteristics of mitochondrial activity in physiological context. Mitochondrial function was measured in the physiological context of the cell in primary hepatocytes isolated from alb-SREBP-1c vs. C57Bl6 livers. (A) Mitochondrial respiration was measured in response to stimulation of electron transport chain complexes and calculation of (B) basal and (C) maximal respiration, (D) spare respiratory capacity, (E) proton leak, (F) ATP production, and (G) coupling efficiency. Data are expressed as mean (±95% CI, n = 8–12 per group). Statistics: Mann–Whitney test, ** p < 0.01, *** p < 0.001, **** p < 0.0001. Oligo: Oligomycin, Rot/AntiA: Rotenone and Antimycin A, C57: C57Bl6, alb1c: alb-SREBP-1c.
Figure 6
Figure 6
Changes in biosynthesis processes in early-stage MAFLD. (A) The log2 fold changes of protein abundance in alb-SREBP-1c vs. C57Bl6 hepatocytes (n = 6 animals per condition). 2731 differentially abundant proteins were detected. Upregulated (red; n = 46) or downregulated proteins (blue; n = 26) were determined by Student’s t-test, with criteria set to p-value < 0.05 and >1.5-fold regulation. Proteins regulated by alb-SREBP-1c were subjected to functional enrichment analyses. Significantly enriched pathways (FDR < 0.1) are shown for biological processes (GO). A modified Fisher’s exact test was used for the functional enrichment analyses. p-values are corrected for multiple testing using the Benjamini–Hochberg (FDR) method. (BD) Heat maps resulting from z-score analyses and estimation plots for each pathway are included: (B) de novo lipogenesis, (C) fatty acid import/transport, (D) fatty acid β-oxidation (mitochondrial). Estimation plots show the differences between means of alb-SREBP-1c vs. C57Bl6 (±95% CI) (mean z-score: left axis, effect size: right axis). Functional analysis show data expressed as means (±95% CI, n = 3–6 per group—depending on the assay). Color code for assays (BD): white bars, data from C57Bl6 mice and gray bars, data from alb-SREBP-1c mice. Statistics: Mann–Whitney test or two-way ANOVA with Tukey’s multiple comparisons, ** p < 0.01, **** p < 0.0001. C57: C57Bl6, alb1c: alb-SREBP-1c.
Figure 7
Figure 7
Changes in biosynthesis processes in early-stage MAFLD. (AF) Heat maps resulting from z-score analyses and estimation plots for each pathway are included: (A) gluconeogenesis and glycogen synthesis, (B) glycolysis, (C) ketogenesis, (D) import to mitochondria, (E) TCA cycle, and (F) anaplerosis/cataplerosis. (AF) Functional analysis of metabolic activities was investigated in primary hepatocyte cultures isolated from alb-SREBP-1c vs. C57Bl6 livers. (C) β-OH butyrate was analyzed in liver tissue. Estimation plots show the differences between means of alb-SREBP-1c vs. C57Bl6 (±95% CI) (mean z-score: left axis, effect size: right axis). Functional analysis show data expressed as means (±95% CI, n = 3–6 per group, depending on the assay). Statistics: Mann–Whitney test or two-way ANOVA with Tukey’s multiple comparisons, ** p < 0.01, *** p < 0.001, **** p < 0.0001. C57: C57Bl6, alb1c: alb-SREBP-1c, Pyr/Lac: pyruvate, lactate.
Figure 8
Figure 8
Substrate oxidation preferences and energetic profile of mitochondrial activity in SREBP-1c-forced early-stage MAFLD. (A,B) Substrate oxidation was measured by extracellular flux analyses in the absence or presence of the inhibitors UK5099, BPTES, and etomoxir to force substrate utilization specifically through glucose (etomoxir/BPTES), glutamine (UK5099/etomoxir) or long-chain fatty acids (UK5099/BPTES). Assay profiles for (A) C57Bl6 vs. (B) alb-SREBP-1c hepatocytes and calculated maximal oxygen consumption rates (OCR) for each condition tested are shown (bar charts). (C) ATP production rates were calculated as a percentage of the whole ATP production in primary hepatocytes from both phenotypes. (D) NAD+ and NADH as well as (E) FAD+ abundance were measured in mitochondrial fractions isolated from liver tissue of both phenotypes. (F) Energy phenotypes were assessed by measuring OCR vs. extracellular acidification rate (ECAR) in the primary hepatocyte culture from alb-SREBP-1c vs. C57Bl6 livers in basal and uncoupled states. Data are expressed as mean (±95% CI or ±SD (F), n = 5–12 per group—depending on assay). Statistics: ANOVA with Kruskal–Wallis test, ** p < 0.01, *** p < 0.001 **** p < 0.0001.

Similar articles

Cited by

References

    1. Jelenik T., Kaul K., Sequaris G., Flogel U., Phielix E., Kotzka J., Knebel B., Fahlbusch P., Horbelt T., Lehr S., et al. Mechanisms of Insulin Resistance in Primary and Secondary Nonalcoholic Fatty Liver. Diabetes. 2017;66:2241–2253. doi: 10.2337/db16-1147. - DOI - PMC - PubMed
    1. Knebel B., Haas J., Hartwig S., Jacob S., Kollmer C., Nitzgen U., Muller-Wieland D., Kotzka J. Liver-specific expression of transcriptionally active SREBP-1c is associated with fatty liver and increased visceral fat mass. PLoS ONE. 2012;7:e31812. doi: 10.1371/journal.pone.0031812. - DOI - PMC - PubMed
    1. Knebel B., Fahlbusch P., Dille M., Wahlers N., Hartwig S., Jacob S., Kettel U., Schiller M., Herebian D., Koellmer C., et al. Fatty Liver Due to Increased de novo Lipogenesis: Alterations in the Hepatic Peroxisomal Proteome. Front. Cell Dev. Biol. 2019;7:248. doi: 10.3389/fcell.2019.00248. - DOI - PMC - PubMed
    1. Horton J.D., Bashmakov Y., Shimomura I., Shimano H. Regulation of sterol regulatory element binding proteins in livers of fasted and refed mice. Proc. Natl. Acad. Sci. USA. 1998;95:5987–5992. doi: 10.1073/pnas.95.11.5987. - DOI - PMC - PubMed
    1. Horton J.D., Goldstein J.L., Brown M.S. SREBPs: Activators of the complete program of cholesterol and fatty acid synthesis in the liver. J. Clin. Investig. 2002;109:1125–1131. doi: 10.1172/JCI0215593. - DOI - PMC - PubMed

MeSH terms

Substances