

Multivariate Analysis of Metabolomic and Nutritional Profiles among Children with Autism Spectrum Disorder
- PMID: 35743708
- PMCID: PMC9224818
- DOI: 10.3390/jpm12060923
Multivariate Analysis of Metabolomic and Nutritional Profiles among Children with Autism Spectrum Disorder
Abstract
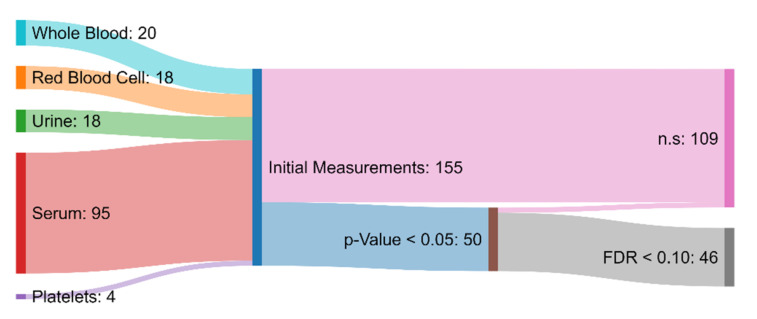
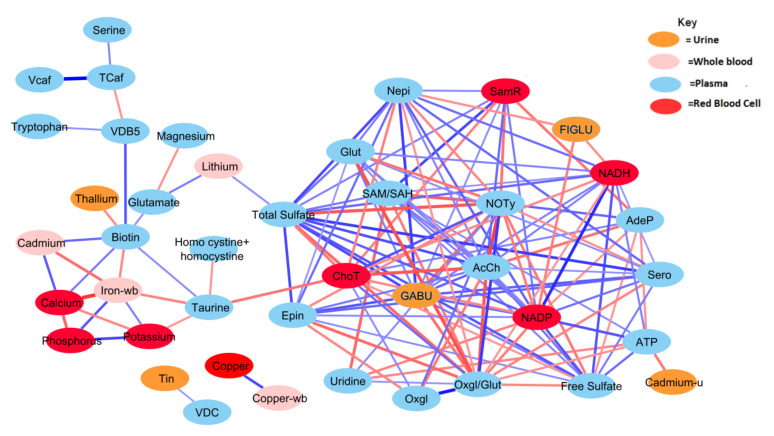
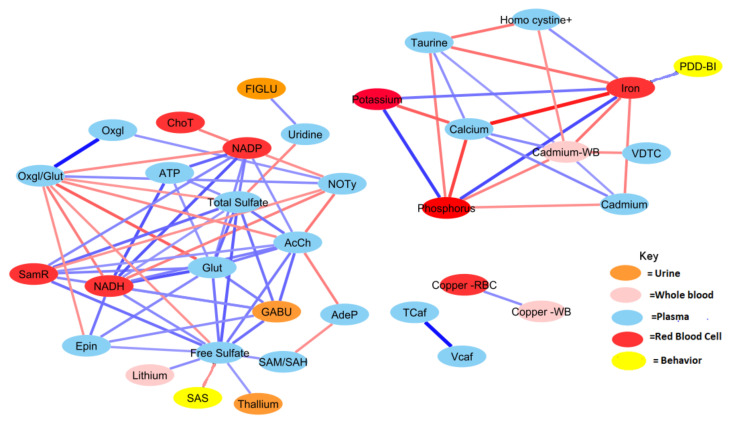
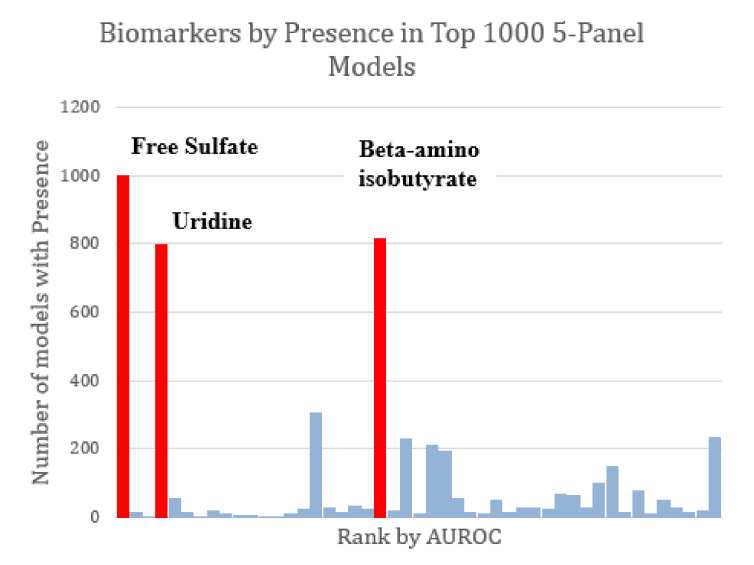
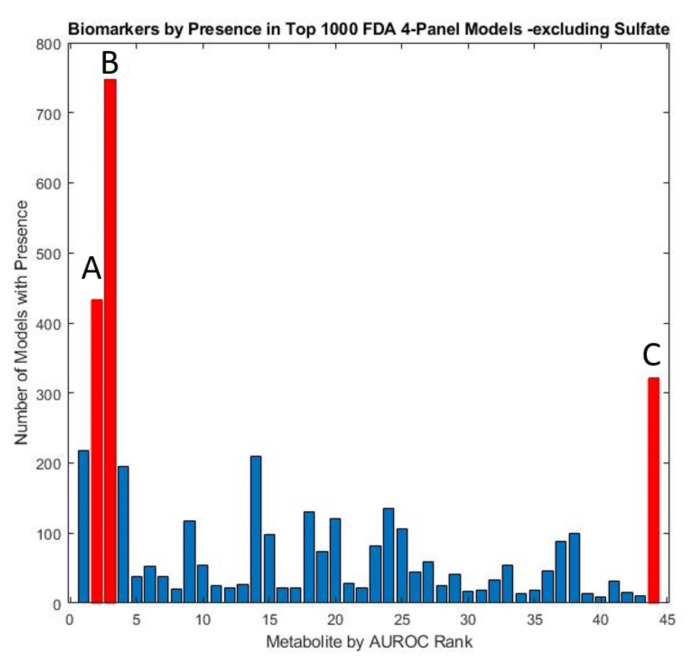
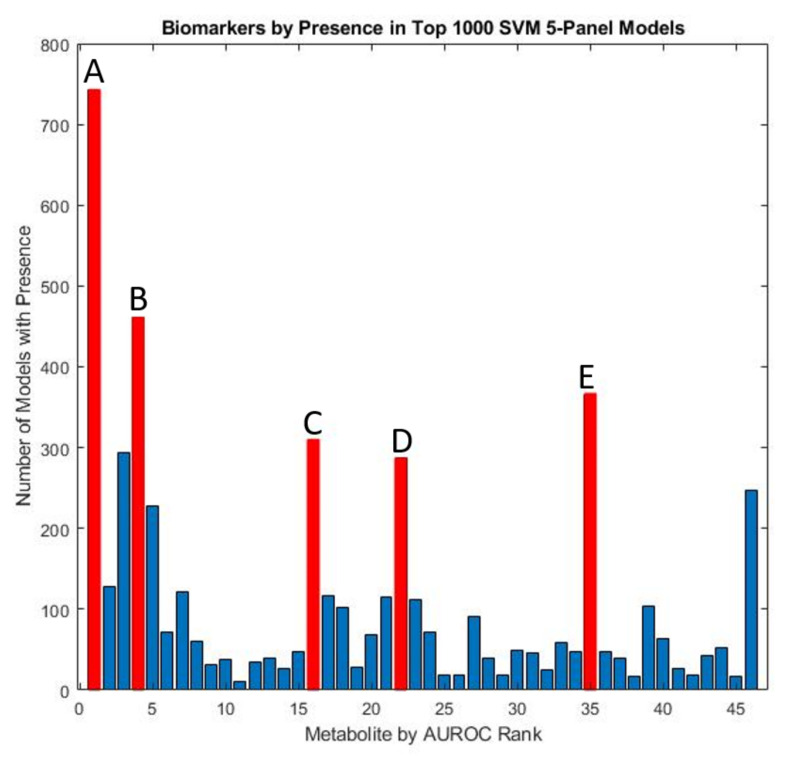
There have been promising results regarding the capability of statistical and machine-learning techniques to offer insight into unique metabolomic patterns observed in ASD. This work re-examines a comparative study contrasting metabolomic and nutrient measurements of children with ASD (n = 55) against their typically developing (TD) peers (n = 44) through a multivariate statistical lens. Hypothesis testing, receiver characteristic curve assessment, and correlation analysis were consistent with prior work and served to underscore prominent areas where metabolomic and nutritional profiles between the groups diverged. Improved univariate analysis revealed 46 nutritional/metabolic differences that were significantly different between ASD and TD groups, with individual areas under the receiver operator curve (AUROC) scores of 0.6-0.9. Many of the significant measurements had correlations with many others, forming two integrated networks of interrelated metabolic differences in ASD. The TD group had 189 significant correlation pairs between metabolites, vs. only 106 for the ASD group, calling attention to underlying differences in metabolic processes. Furthermore, multivariate techniques identified potential biomarker panels with up to six metabolites that were able to attain a predictive accuracy of up to 98% for discriminating between ASD and TD, following cross-validation. Assessing all optimized multivariate models demonstrated concordance with prior physiological pathways identified in the literature, with some of the most important metabolites for discriminating ASD and TD being sulfate, the transsulfuration pathway, uridine (methylation biomarker), and beta-amino isobutyrate (regulator of carbohydrate and lipid metabolism).
Keywords: ASD; Fisher discriminant analysis; SVM; machine learning; metabolomics; multivariate statistics.
Conflict of interest statement
The authors declare no conflict of interest.
Figures
Similar articles
-
Multivariate Analysis of Fecal Metabolites from Children with Autism Spectrum Disorder and Gastrointestinal Symptoms before and after Microbiota Transfer Therapy.J Pers Med. 2020 Oct 2;10(4):152. doi: 10.3390/jpm10040152. J Pers Med. 2020. PMID: 33023268 Free PMC article.
-
Altered metabolism of mothers of young children with Autism Spectrum Disorder: a case control study.BMC Pediatr. 2020 Dec 14;20(1):557. doi: 10.1186/s12887-020-02437-7. BMC Pediatr. 2020. PMID: 33317469 Free PMC article.
-
Investigating Plasma Amino Acids for Differentiating Individuals with Autism Spectrum Disorder and Typically Developing Peers.Res Autism Spectr Disord. 2018 Jun;50:60-72. doi: 10.1016/j.rasd.2018.03.004. Epub 2018 Mar 30. Res Autism Spectr Disord. 2018. PMID: 29682004 Free PMC article.
-
Urinary Essential Elements of Young Children with Autism Spectrum Disorder and their Mothers.Res Autism Spectr Disord. 2020 Apr;72:101518. doi: 10.1016/j.rasd.2020.101518. Epub 2020 Feb 6. Res Autism Spectr Disord. 2020. PMID: 32382316 Free PMC article.
-
Exploring metabolomic dynamics in acute stress disorder: amino acids, lipids, and carbohydrates.Front Genet. 2024 Jul 25;15:1394630. doi: 10.3389/fgene.2024.1394630. eCollection 2024. Front Genet. 2024. PMID: 39119583 Free PMC article. Review.
Cited by
-
Cord Blood Metabolite Profiles and Their Association with Autistic Traits in Childhood.Metabolites. 2023 Nov 9;13(11):1140. doi: 10.3390/metabo13111140. Metabolites. 2023. PMID: 37999236 Free PMC article.
-
Metabolomic changes in children with autism.World J Clin Pediatr. 2024 Jun 9;13(2):92737. doi: 10.5409/wjcp.v13.i2.92737. eCollection 2024 Jun 9. World J Clin Pediatr. 2024. PMID: 38947988 Free PMC article.
-
Ratings of the Effectiveness of 13 Therapeutic Diets for Autism Spectrum Disorder: Results of a National Survey.J Pers Med. 2023 Sep 29;13(10):1448. doi: 10.3390/jpm13101448. J Pers Med. 2023. PMID: 37888059 Free PMC article.
References
-
- Maenner M.J., Shaw K.A., Bakian A.V., Cogswell M. Prevalence and Characteristics of Autism Spectrum Disorder Among Children Aged 8 Years—Autism and Developmental Disabilities Monitoring Network, 11 Sites, United States. MMWR Surveill. Summ. 2021;70((Suppl. S11)):1–16. doi: 10.15585/mmwr.ss7011a1. - DOI - PMC - PubMed
Grants and funding
LinkOut - more resources
Full Text Sources
Other Literature Sources
