. 2022 May 25;12(6):787.
doi: 10.3390/life12060787.

Prediction and Experimental Validation of a New Salinity-Responsive Cis-Regulatory Element (CRE) in a Tilapia Cell Line

Affiliations

Prediction and Experimental Validation of a New Salinity-Responsive Cis-Regulatory Element (CRE) in a Tilapia Cell Line

Chanhee Kim et al. Life (Basel). .

Abstract

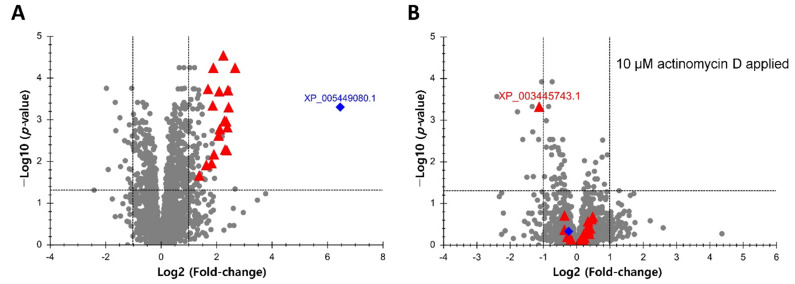
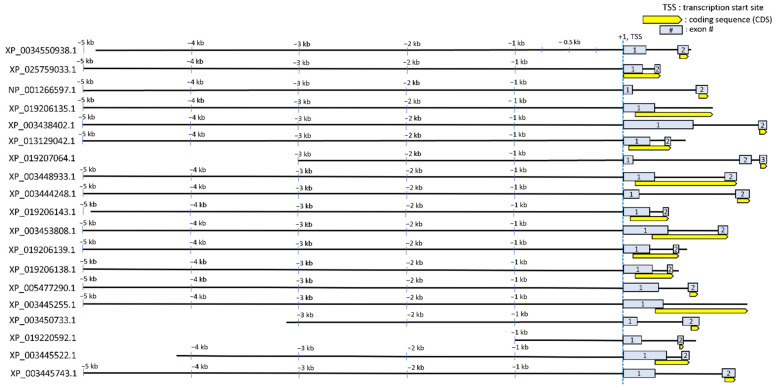
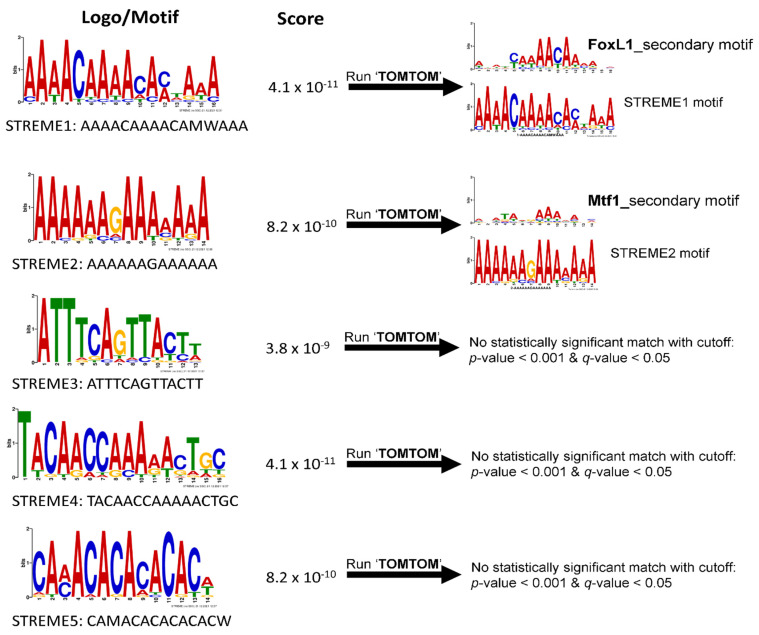
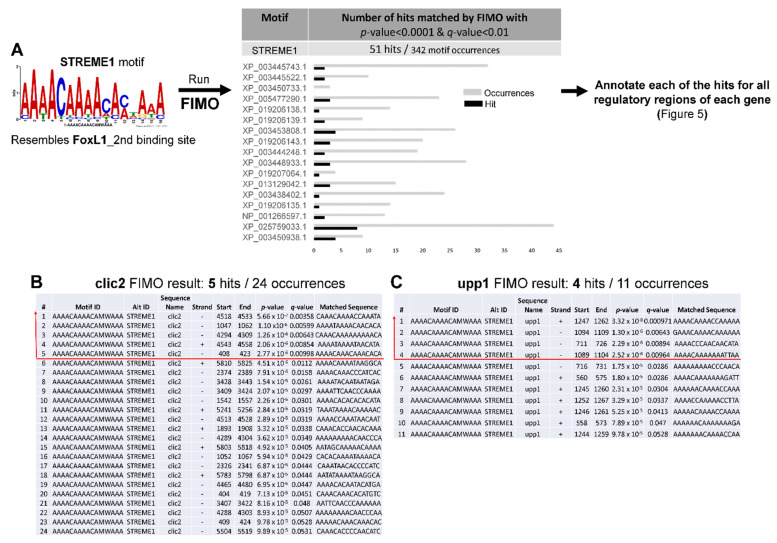
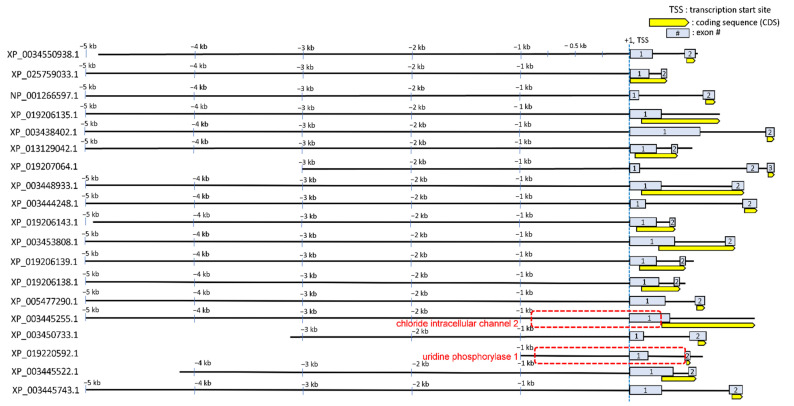
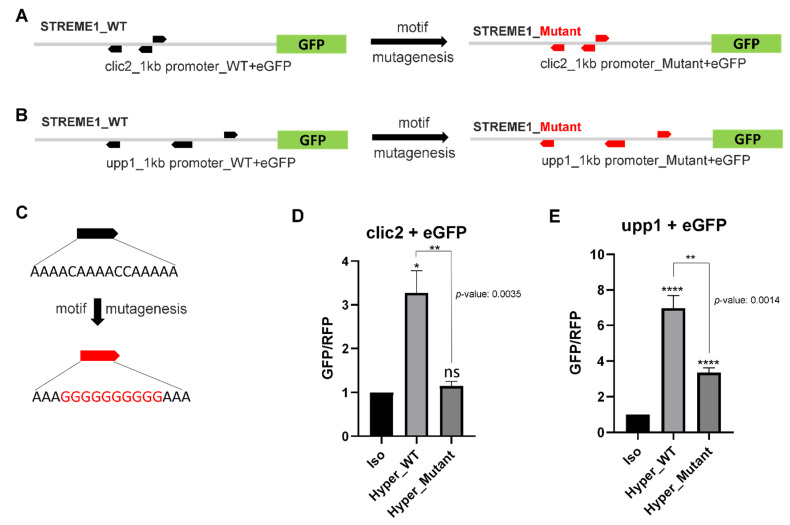
Transcriptional regulation is a major mechanism by which organisms integrate gene x environment interactions. It can be achieved by coordinated interplay between cis-regulatory elements (CREs) and transcription factors (TFs). Euryhaline tilapia (Oreochromis mossambicus) tolerate a wide range of salinity and thus are an appropriate model to examine transcriptional regulatory mechanisms during salinity stress in fish. Quantitative proteomics in combination with the transcription inhibitor actinomycin D revealed 19 proteins that are transcriptionally upregulated by hyperosmolality in tilapia brain (OmB) cells. We searched the extended proximal promoter up to intron1 of each corresponding gene for common motifs using motif discovery tools. The top-ranked motif identified (STREME1) represents a binding site for the Forkhead box TF L1 (FoxL1). STREME1 function during hyperosmolality was experimentally validated by choosing two of the 19 genes, chloride intracellular channel 2 (clic2) and uridine phosphorylase 1 (upp1), that are enriched in STREME1 in their extended promoters. Transcriptional induction of these genes during hyperosmolality requires STREME1, as evidenced by motif mutagenesis. We conclude that STREME1 represents a new functional CRE that contributes to gene x environment interactions during salinity stress in tilapia. Moreover, our results indicate that FoxL1 family TFs are contribute to hyperosmotic induction of genes in euryhaline fish.

Keywords: cellular osmoregulation; cis-regulatory element; fish; salinity; stress tolerance; transcription factor; transcriptional regulation.


Conflict of interest statement

The authors declare no conflict of interest.

Figures

Figure 1
Figure 1
Relative abundances of 3043 Oreochromis mossambicus proteins in OmB cells exposed for 24 h to hyperosmotic stress (650 mOsmol/kg) versus isosmotic media (315 mOsmol/kg). (A) Volcano plot indicating the 19 significantly up-regulated proteins that were selected for comparative sequence analyses and motif searches (red triangles). The x axis displays the fold change of protein abundance in hyperosmotic versus isosmotic medium on a log 2 scale. The y axis displays the negative decadic logarithm of the MSstats-adjusted (multiple testing corrected) p value. Inositol monophosphatase (blue diamond) was not included in this set because its FC was much greater than that of the other proteins’ and it had been analyzed previously in depth [17]. (B) Volcano plot for the same proteins as shown in panel A except that OmB cells were exposed to hyperosmolality in the presence of 10 µM of the transcriptional inhibitor actinomycin D. Data are based on five replicates for each treatment and control group. For accession numbers of all 19 proteins indicated by red triangles and used for further analyses by motif searching please refer to Figure 2.
Figure 2
Figure 2
Schematic genomic landscape of the regulatory sequences of 19 hyperosmotically induced tilapia genes. Each of the regulatory sequences up to 5 kb upstream (some genes have upstream regulatory regions less than 5 kb due to overlapping with gene body of other genes) and 5’ UTR (up to CDS) are depicted as black lines. Light grey boxes indicate exons and the yellow boxes with one-sided arrow indicate the coding sequence (CDS) of each gene including intron 1 if applicable. Each sequence is labeled with the NCBI accession number of the corresponding protein. Relative genomic positions (e.g., −3 kb) from transcription start site (TSS, +1) are presented.
Figure 3
Figure 3
Five motifs (STREME1 to STREME5) identified by STREME motif discovery tool using 19 hyperosmotically induced tilapia sequences as input. The logo and sequence for each motif is indicated on the left and corresponding STREME score in the center. The result of TOMTOM prediction of known TF binding sites is indicated on the right. On the right are STREME1 motif results indicating a match to the FoxL1 secondary binding motif and STREME2 motif results indicating a match to the Mtf1 secondary motif from TOMTOM search. The other three STREME motifs did not match to any known TF binding motif with the cutoff criteria.
Figure 4
Figure 4
STREME1 motif scanning for occurrences in the regulatory sequences of 19 hyperosmotically induced tilapia genes. (A) FIMO was performed using the STREME1 motif to find all occurrences in the regulatory sequences. The sequence information for all identified STREME1 motifs in the regulatory sequences resulting from FIMO, such as whether STREME1 is found in sense or antisense strand; start and end position; p-value, and q-value are provided in supplementary Table S2. Fifty-one significant hits out of 342 total STREME1 occurrences were identified throughout all 19 regulatory sequences and were screened by two statistical cut off values using FIMO default p-value (0.0001) and q-value (0.01) thresholds. The number of occurrences of significant hits (black bars) and total STREME1 occurrences (grey bars) is illustrated for each of gene except for clic2 and upp1, which were chosen for further experimental validation. Some occurrences of these 51 hits represent overlapping sequences, which were consolidated into a single motif in Figure 5. Detailed information about STREME1 motifs identified in clic2 (B) and upp1 (C) regulatory sequences is shown in panels B and C with significance thresholds indicated by a red line.
Figure 5
Figure 5
Annotation of significant STREME1 motif occurrences in regulatory sequences of 19 hyperosmotically induced tilapia genes. Each of the regulatory sequences analyzed by motif discovery is depicted as a black line. Light grey boxes indicate exons and the yellow boxes with one-sided arrow indicate coding sequence (CDS) including intron 1 if applicable. Significant hit STREME1 motifs (analyzed in Figure 4) are displayed using black bars with one-sided arrow indicating orientation. The proximal extended promoter sequences (approximately 1 kb upstream relative to TSS and 5’-UTR) for clic2 and upp1 that were used for experimental validation of STREME1 motifs are boxed by a dashed red line.
Figure 6
Figure 6
Experimental validation of STREME1 using GFP/RFP reporter assay and motif mutagenesis. Motif mutagenesis was used to replace the original STREME1 (black arrows) with a nonfunctional sequence (red arrows) by changing the core nucleotides with nucleotides not contained in that core region for chloride intracellular channel 2 (clic2, A) and uridine phosphorylase (upp1, B). (C) STREME1 motif mutagenesis strategy indicates the sequence difference between wild type (WT, black arrow) and mutant (red arrow) motifs. The transcriptional activities of the proximal regulatory regions from clic2 (D) and upp1 (E) during hyperosmolality (compared to isosmotic control medium) were measured by GFP signal (normalized with RFP control) using expression vector systems. t-test was used to calculate statistical significance yielding p-values. Iso: Isosmotic control, Hyper_WT: wild type regulatory sequence treated with hyperosmotic treatment, Hyper_Mutant: mutant regulatory sequence treated with hyperosmotic treatment, n = 5 (*: p < 0.05, **: p < 0.01, ****: p < 0.0001).

Similar articles

Cited by

References

    1. Wray N.R., Yang J., Hayes B.J., Price A.L., Goddard M.E., Visscher P.M. Pitfalls of Predicting Complex Traits from SNPs. Nat. Rev. Genet. 2013;14:507–515. doi: 10.1038/nrg3457. - DOI - PMC - PubMed
    1. Kültz D. Physiological Mechanisms Used by Fish to Cope with Salinity Stress. J. Exp. Biol. 2015;218:1907–1914. doi: 10.1242/jeb.118695. - DOI - PubMed
    1. Marie A.D., Smith S., Green A.J., Rico C., Lejeusne C. Transcriptomic Response to Thermal and Salinity Stress in Introduced and Native Sympatric Palaemon Caridean Shrimps. Sci. Rep. 2017;7:13980. doi: 10.1038/s41598-017-13631-6. - DOI - PMC - PubMed
    1. Almeida-Dalmet S., Litchfield C.D., Gillevet P., Baxter B.K. Differential Gene Expression in Response to Salinity and Temperature in a Haloarcula Strain from Great Salt Lake, Utah. Genes. 2018;9:52. doi: 10.3390/genes9010052. - DOI - PMC - PubMed
    1. Cooper G.M. The Cell: A Molecular Approach. 2nd ed. Sinauer Associates; Sunderland, MA, USA: 2000. Regulation of Transcription in Eukaryotes.