. 2022 Jun 7;27(12):3659.
doi: 10.3390/molecules27123659.

The Ameliorative Effect of Empagliflozin in Vigabatrin-Induced Cerebellar/Neurobehavioral Deficits: Targeting mTOR/AMPK/SIRT-1 Signaling Pathways

Affiliations

The Ameliorative Effect of Empagliflozin in Vigabatrin-Induced Cerebellar/Neurobehavioral Deficits: Targeting mTOR/AMPK/SIRT-1 Signaling Pathways

Rabab M Amer et al. Molecules. .

Abstract

Introduction. Vigabatrin (VGB) is an antiepileptic drug that acts to irreversibly inhibit the γ-aminobutyric acid (GABA) transaminase enzyme, elevating GABA levels. Broad studies have established that long-term treatment and/or high doses of VGB lead to variable visual defects. However, little attention has been paid to its other side effects, especially those demonstrating cerebellar involvement. Sodium glucose-linked co-transporter 2 (SGLT2) inhibitors are antidiabetic agents with protective effects far greater than expected based on their anti-hyperglycemic effect. Method. Our study herein was designed to investigate the possible ameliorative effect of empagliflozin, the SGLT2 inhibitors, in VGB-induced cerebellar toxicity. A total of 40 male Wistar rats were allocated equally into 4 groups: Group I: control group; Group II: VGB group; Group III empagliflozin treated VGB group; and Group IV: empagliflozin treated group. All groups were subjected to the detection of cerebellar messenger RNA gene expression of silent mating type information regulation 2 homolog 1 (SIRT1) and Nucleoporin p62 (P62). Mammalian target of rapamycin (mTOR), adenosine monophosphate-activated protein kinase (AMPK), and beclin1 levels were assessed by the ELISA technique while malondialdehyde (MDA) level and superoxide dismutase (SOD) activity were detected spectrophotometrically. Immuno-histochemical studies, focusing on glial fibrillary acidic protein (GFAP) and S100 were performed, and the optical color density and the mean area percentage of GFAP positive astrocytes and the number of S 100 positive cells were also counted. Results. Following empagliflozin treatment, we documented significant upregulation of both SIRT1 and P62 mRNA gene expression. Additionally, AMPK, Beclin1 levels, and SOD activity were significantly improved, while both mTOR and MDA levels were significantly reduced. Conclusions. We concluded for the first time that empagliflozin efficiently ameliorated the VGB-induced disrupted mTOR/AMPK/SIRT-1 signaling axis with subsequent improvement of the autophagy machinery and mitigation of the oxidative and inflammatory cellular environment, paving the way for an innovative therapeutic potential in managing VGB-induced neurotoxicity.

Keywords: AMPK; GFAP; SIRT-1; empagliflozin; mTOR; vigabatrin.


Conflict of interest statement

The authors declare that they have no conflict of interest.

Figures

Figure 1
Figure 1
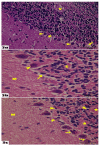
Sections of the cerebellum of the control and Empagliflozin-treated groups (group I and IV): (a) Shows the control cerebellar cortex lamination into outer molecular (M), middle Purkinje layer (P), and inner granular (G), and inner white matter of cerebellar medulla (W) (H&E 200). (b) Shows the molecular layer (M) has scattered rounded cells (arrow heads) with numerous nerve fibers. Purkinje cells (arrow) arranged in a single row of large pear-shaped cells with vesicular nuclei. The granular layer (G) shows densely packed clumps of cells with small clear non-cellular areas called cerebellar islands (glomeruli) in the control group (H&E 400). (c) Shows flask-shaped Purkinje cells (P), which contain well-defined rounded vesicular nuclei and prominent nucleoli (arrow heads) with slightly basophilic cytoplasm, and long apical dendrites (arrows). Bergmann glial cells (astrocytes) are noticed around the Purkinje cells; they have pale nuclei and pale cytoplasm (wavy arrows). The granular layer has groups of rounded cells with rounded heterochromatic nuclei and is separated by small clear non cellular areas called cerebellar islands (glomeruli) (Stars) in the control group (H&E 1000). (d) Shows histological architecture of the cerebellum in the Empagliflozin-treated group with the same features as in the control group. Purkinje-cells (arrow) arranged in a single row of large pear-shaped cells with vesicular nuclei and the granular layer (G) shows densely packed clumps of cells (H&E 400). (e) Shows histological architecture of the cerebellum in the Empagliflozin-treated group with the same features as in the control group (H&E 1000).
Figure 2
Figure 2
Sections from the rat cerebellum of group II: (a): Show disruption in the linear pattern of the Purkinje layer and some Purkinje cells are irregular, and others are shrunken (wavy arrows). Dilated congested blood vessel (V) is seen with area of hemorrhage (arrow) in the white matter layer (H&E 400). (b): Shows marked disarrangement of the Purkinje layer, some Purkinje cells have fallen off leaving remarkable empty spaces (Arrows), and congested blood vessels (arrowhead) (H&E 400). (c): Shows obvious degenerative changes especially in the Purkinje (P) layer, in the form of marked vacuolated empty spaces (stars), and the Purkinje cells are deformed. There are increased and congested blood vessels in the Purkinje layer (wavy arrows), which also shows empty spaces scattered in the granular (Arrows) and in the molecular layer (curved arrows), and some neurons with shrunken deeply stained nuclei and vacuolated cytoplasm (Arrowhead) are seen in the molecular layer (H&E 400). (d): Shows the granular layer with many deformed cells with shrunken pyknotic nuclei and vacuolated cytoplasm (Arrowheads); other cells have degenerated leaving empty spaces (curved arrows). The Purkinje layer showed deformed Purkinje cells with deeply stained pyknotic nuclei (arrows) and marked cytoplasmic vacuolations (stars) (H&E 1000).
Figure 3
Figure 3
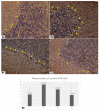
Sections from the rat cerebellum of group III: (a): Show that the Purkinje layer (P) retains its normal linear organization showing some normal cells (arrowheads), but other cells show irregular form and vacuolar spaces (arrow), and the granular layer shows nearly normal clumps of cells and shows a congested blood vessel (V) (H&E 400). (b): Shows irregular Purkinje cell with deeply stained pyknotic nucleus (arrowhead) and small vacuolated empty spaces (arrow); the remaining Purkinje cells are normal. The molecular layer (M) with scattered neurons appears nearly normal (H&E 1000). (c): Shows the granular layer with few shrunken cells with deeply stained nuclei (arrowhead), slightly enlarged glomerular spaces (stars), and the Purkinje layer shows normal organization with few irregular Purkinje cells (wavy arrows) (H&E 1000).
Figure 4
Figure 4
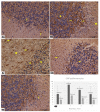
Shows Glial fibrillary acidic protein (GFAP) immunohistochemically stained cerebellar sections: (GFAP immunostain X 400). (a): Control group showing scattered GFAP immunoreactive cells with long and thin processes (arrows) in the different cerebellar cortical layers. (b,c): Group II showing more abundant GFAP-positive cells in all cerebellar layers molecular (M), Purkinje (P), Granular (G), and in the medullary white matter (M). These cells appear larger with relatively longer and thicker processes (arrows) as compared with the control group. (d): Group III showing positive expression of GFAP, which is apparently increased as compared to that noticed in the control rats, but lesser than group II (arrows). (e): Group IV showing scattered GFAP immunoreactive cells (arrow) in the different cerebellar cortical layers with the same features as in the control group. (f): Graphic representation of the morphometric results of glial fibrillary acidic protein optical density. a denotes a statistically significant difference compared to group I; b denotes a statistically significant difference compared to group II; c denotes a statistically significant difference compared to group III; d denotes a statistically significant difference compared to group IV, by one-way analysis of variance followed by post hoc Tukey’s test.
Figure 5
Figure 5
Shows S100 immunohistochemically stained cerebellar sections: (S100 immunostain X400) (a): Control group showing S100-positive cells located between the Purkinje cells (yellow arrows). (b): Group II showing more pronounced diffuse S100 immunostaining with a higher number of S100-positive cells (yellow arrows). (c): Group III showing positive expression of S100 immunostaining with S100-positive cells are lesser in number than the VGB group (yellow arrows). (d): Group IV showing S100-positive cells located between the Purkinje cells (yellow arrows). (e): Graphic representation of the morphometric results of a mean number of positive S100 immuno-stained cells. a denotes a statistically significant difference compared to group I; b denotes a statistically significant difference compared to group II; c denotes a statistically significant difference compared to group III; d denotes a statistically significant difference compared to group IV, by one-way analysis of variance followed by post hoc Tukey’s test.
Figure 6
Figure 6
Effect of empagliflozin treatment on P62gene expression. Values are represented as mean ± SD (n = 10). a denotes a statistically significant difference compared to group I; b denotes a statistically significant difference compared to group II; c denotes a statistically significant difference compared to group III; d denotes a statistically significant difference compared to group IV, by one-way analysis of variance followed by post hoc Tukey’s test.
Figure 7
Figure 7
Effect of empagliflozin treatment on SIRT1 gene expression. Values are represented as mean ± SD (n = 10). a denotes a statistically significant difference compared to group I; b denotes a statistically significant difference compared to group II; c denotes a statistically significant difference compared to group III; d denotes a statistically significant difference compared to group IV, by one-way analysis of variance followed by post hoc Tukey’s test.
Figure 8
Figure 8
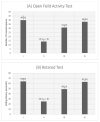
Effects of empagliflozin treatment on the motor behavioral deficit of vigabatrin-treated rats. Locomotor activity (A) is presented as the number of crossed squares in the open field arena. Motor coordination (B) is presented as falling latency on the rotarod apparatus (seconds). Values are represented as mean ± SD (n = 10). a denotes a statistically significant difference compared to group I; b denotes a statistically significant difference compared to group II; c denotes a statistically significant difference compared to group III; d denotes a statistically significant difference compared to group IV, by one-way analysis of variance followed by post hoc Tukey’s test.

References

    1. Wheless J.W., Ramsay R.E., Collins S.D. Vigabatrin. Neurotherapeutics. 2007;4:163–172. doi: 10.1016/j.nurt.2006.11.008. - DOI - PMC - PubMed
    1. Gram L., Larsson O., Johnsen A., Schousboe A. Experimental studies of the influence of vigabatrin on the GABA system. Br. J. Clin. Pharmacol. 1989;27:13S–17S. doi: 10.1111/j.1365-2125.1989.tb03455.x. - DOI - PMC - PubMed
    1. Sander J.W., Hart Y.M., Trimble M.R., Shorvon S.D. Vigabatrin and psychosis. J. Neurol. Neurosurg. Psychiatry. 1991;54:435–439. doi: 10.1136/jnnp.54.5.435. - DOI - PMC - PubMed
    1. Singh D., Jethani S.L., Dubey A. Vigabatrin induced cell loss in the cerebellar cortex of albino rats. J. Clin. Diagn. Res. JCDR. 2013;7:2555. doi: 10.7860/JCDR/2013/6187.3610. - DOI - PMC - PubMed
    1. Singh D., Jethani S., Dubey A., Deepa S., Aksh D. Vigabatrin induced intramyelinic oedema in cerebellum of albino rats. J. Anat. Soc. India. 2014;63:156–160. doi: 10.1016/j.jasi.2014.11.008. - DOI

LinkOut - more resources