Review
. 2022 Jun 11;27(12):3778.
doi: 10.3390/molecules27123778.

Combined Second Harmonic Generation and Fluorescence Analyses of the Structures and Dynamics of Molecules on Lipids Using Dual-Probes: A Review

Affiliations
Review

Combined Second Harmonic Generation and Fluorescence Analyses of the Structures and Dynamics of Molecules on Lipids Using Dual-Probes: A Review

Yi Hou et al. Molecules. .

Abstract

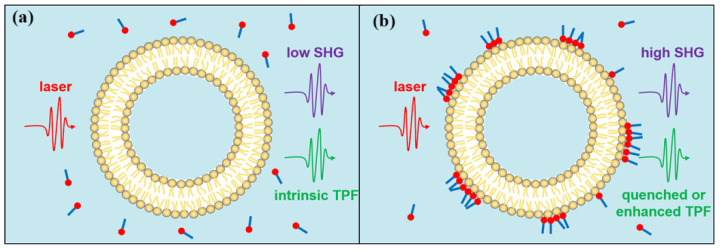
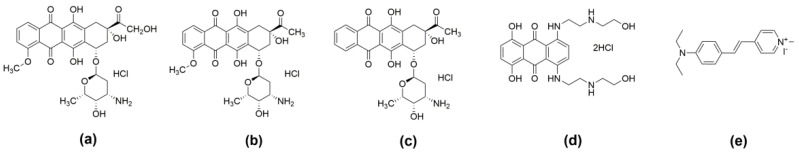
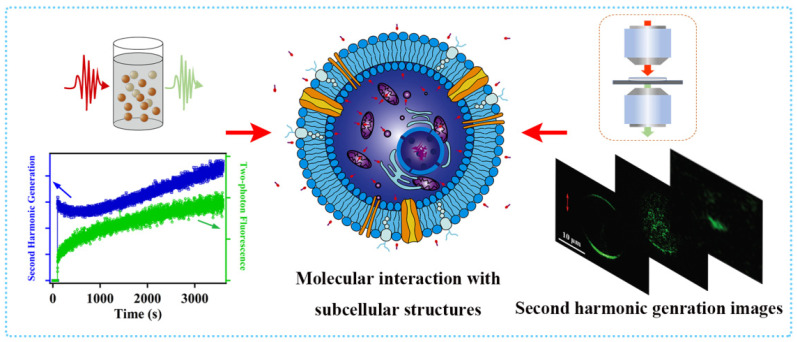
Revealing the structures and dynamic behaviors of molecules on lipids is crucial for understanding the mechanism behind the biophysical processes, such as the preparation and application of drug delivery vesicles. Second harmonic generation (SHG) has been developed as a powerful tool to investigate the molecules on various lipid membranes, benefiting from its natural property of interface selectivity, which comes from the principle of even order nonlinear optics. Fluorescence emission, which is in principle not interface selective but varies with the chemical environment where the chromophores locate, can reveal the dynamics of molecules on lipids. In this contribution, we review some examples, which are mainly from our recent works focusing on the application of combined spectroscopic methods, i.e., SHG and two-photon fluorescence (TPF), in studying the dynamic behaviors of several dyes or drugs on lipids and surfactants. This review demonstrates that molecules with both SHG and TPF efficiencies may be used as intrinsic dual-probes in plotting a clear physical picture of their own behaviors, as well as the dynamics of other molecules, on lipid membranes.

Keywords: dual-probes; lipid membrane; second harmonic generation; two-photon fluorescence.


Conflict of interest statement

The authors declare no conflict of interest.

Figures

Figure 1
Figure 1
Illustration of the SHG and TPF analyses. (a) Lipids with interfacial symmetry radiate low SHG. Free probing molecules in the solutions radiate intrinsic TPF. (b) Aggregated probing molecules on lipids radiate quenched or enhanced TPF. Lipids with local interface asymmetry radiate high SHG. Be noted that the vesicle as a whole is symmetric with an inversion center. However, because of the different speeds for the excitation laser and generated SHG signal in the vesicles, the scattered SHG signal from different part of the vesicles interference with each other and emit detectable SHG for relatively large sized vesicles [22,47].
Scheme 1
Scheme 1
Molecular structures of DOX (a), DNR (b), IDA (c), MIT (d), D289 (e).
Figure 2
Figure 2
Scattered spectra from DOX solution (10 μM, solid line), DOPG vesicle solution (250 μM, dashed line), and the mixture of them at their respective concentrations (dotted line) with excitation by an 800 nm laser. Reproduced with permission [57]. Copyright 2019 American Chemical Society.
Figure 3
Figure 3
(a) Experimental setup for collecting the scattered signal at a relatively large spatial angle. Reproduced with permission [57]. Copyright 2019 American Chemical Society. (b) Setup for simultaneously detecting the SHG and TPF signals. Reproduced with permission [61]. Copyright 2019 American Institute of Physics.
Figure 4
Figure 4
(a) Time-dependent SHG field obtained after the addition of DOX at various concentrations in 250 μM DOPG vesicle solutions. (b) Magnification of the rectangle area marked by dotted lines in frame a (some curves were shifted in x direction to make the plot clear). Reproduced with permission [57]. Copyright 2019 American Chemical Society.
Figure 5
Figure 5
(a,c) Time-dependent TPF intensities recorded before and after the addition of DOPG vesicles into DOX solutions at various concentrations. (b,d) Magnifications of the rectangle area marked by dotted lines in frames a and c, respectively (some curves were shifted in x direction to make the plot clear). The final concentration of DOPG is 250 μM. Reproduced with permission [57]. Copyright 2019 American Chemical Society.
Figure 6
Figure 6
Illustrations of the adsorption and embedding of DOX molecules on the surface of DOPG vesicles at relatively low (a,b) and high (c,d) DOX concentrations. Reproduced with permission [57]. Copyright 2019 American Chemical Society.
Figure 7
Figure 7
(a) Time-dependent TPF intensity curves obtained from the DOX solution upon 810 nm laser radiation with multiple times addition of DOPG vesicle solutions at the points indicated by A–J. After halving the DOX concentration at each point, the TPF signal was doubled to make a fair comparison of the TPF efficiency. (b) TPF efficiency of DOX on the lipid surface with the apparent mean distance between the DOX molecules. Values were normalized to the TPF efficiency of DOX in their 40 μM aqueous solution. The data were averaged results based on two batches of measurements. Reproduced with permission [61]. Copyright 2019 American Institute of Physics.
Figure 8
Figure 8
The time constants obtained from the fittings in Figure 4 and Figure 5 plotted as a function of DOX concentration. Exponential function as ESHG=B+Aexp((tt0)/τ) (for TPF experiments at all concentrations and SHG experiments at relatively low concentrations of 3–7 μM) or a bi-exponential function as ESHG=B+A1exp((tt0)/τ1)+A2exp((tt0)/τ2) (for SHG experiments at relatively high concentrations of 9–25 μM) was applied in the fittings as discussed in the main text. In this plot τ1 represented the rate of the fast SHG change in experiments with DOX at relatively high concentrations, τ2 indicated the rate of the slow change in all the SHG curves. Therefore, τ1 was absent for experiments at relatively low concentrations. τ3 reflected the rate of exponential change in TPF curves as shown in Figure 5. Note that the curve of τ2 was higher than the curve of τ3 as discussed in the main text. Reproduced with permission [57]. Copyright 2019 American Chemical Society.
Figure 9
Figure 9
The scattering spectra from the MIT (a), DNR (b), IDA (c) solutions (20 μM, dashed line), DOPG vesicle solution (250 μM, dotted line), and the mixture solutions of DOPG vesicles and anthracyclines at their respective concentrations (solid line). Reproduced with permission [58]. Copyright 2020 Elsevier.
Figure 10
Figure 10
Time-dependent SHG field (a) and TPF intensity (b) curves obtained after the mixing of MIT, DOX, IDA, and DNR solutions with the DOPG vesicle solutions as shown in Figure 4, Figure 5 and Figure 9. The solid lines in frame (a) were from exponential (for MIT) or bi-exponential (for DOX, DNR and IDA) fittings. Some curves were shifted in the x direction to make the plot clear. Frame a is reproduced with permission [58]. Copyright 2020 Elsevier.
Figure 11
Figure 11
Schematic illustrations showing the adsorption (a,b) and embedding (c,d) of DOX, DNR, IDA, and MIT on DOPG bilayers. Modified based on previous reports [58].
Figure 12
Figure 12
(a) Simultaneously detected TPF and SHG intensities after the mixing of DOX/AOT solutions with a final concentration ratio as 25/500 μM. (b) Simultaneously detected curves of the Rayleigh scattering and the SHG intensities after the mixing of DOX and AOT solutions. For the SHG and Rayleigh curves, the points at t = 0 plotted the original signal right after the mixing of solutions. For the TPF curve, the value obtained the 25 μM DOX solution was plotted as the initial point because the TPF emission was mostly from the DOX molecules, also because the change in the TPF signal after the mixing was so fast that large deviations were obtained for the TPF measurements at t = 0. Reproduced with permission [47]. Copyright 2022 Royal Society of Chemistry.
Figure 13
Figure 13
Proposed mechanism of the vesicle formation in DOX/AOT mixed solutions. Reproduced with permission [47]. Copyright 2022 Royal Society of Chemistry.
Figure 14
Figure 14
Kinetic model of the vesicle formation from DOPG multiple layers through hydration methods. Reproduced with permission [47]. Copyright 2022 Royal Society of Chemistry.
Figure 15
Figure 15
(a) Simultaneously detected TPF and SHG intensities after the addition of DOX solution to dried DOPG film with a final concentration ratio as 25/1000 μM. (b) Simultaneously detected curves of the Rayleigh scattering and SHG intensities after the addition of DOX solution. Reproduced with permission [47]. Copyright 2022 Royal Society of Chemistry.
Figure 16
Figure 16
Normalized SHG (blue curves) and TPF (red curves) spectra while FM 4–64 interacting with S. aureus (a,b) and E. faecalis (c,d) membranes. Final concentration of FM 4–64 was 16 μM. SDs were shown as the shaded regions. n = 3 for each plot. Reproduced with permission [76]. Copyright 2019 Elsevier.
Figure 17
Figure 17
Left: Top is a schematic illustration showing the scattering of SHG and TPF signals from cells upon laser excitation. At the bottom is the time-dependent SHG and TPF curves. In the middle is the schematic illustration of the distributing of D289 molecules (small rod like structures with a red “head”) outside and in a K562 cell. Right: Top is a schematic illustration of the imaging setup. At the bottom are successive SHG images after D289 was introduced to the K562 cell. Reproduced with permission [62]. Copyright 2021 American Chemical Society.

Similar articles

Cited by

References

    1. Pattni B.S., Chupin V.V., Torchilin V.P. New Developments in Liposomal Drug Delivery. Chem. Rev. 2015;115:10938–10966. doi: 10.1021/acs.chemrev.5b00046. - DOI - PubMed
    1. Alves A.C., Ribeiro D., Nunes C., Reis S. Biophysics in cancer: The relevance of drug-membrane interaction studies. Biochim. Biophys. Acta Biomembr. 2016;1858:2231–2244. doi: 10.1016/j.bbamem.2016.06.025. - DOI - PubMed
    1. Van Maarschalkerweerd A., Vetri V., Langkilde A.E., Fodera V., Vestergaard B. Protein/lipid coaggregates are formed during α-synuclein-induced disruption of lipid bilayers. Biomacromolecules. 2014;15:3643–3654. doi: 10.1021/bm500937p. - DOI - PubMed
    1. Henry N., Fantine E.O., Bolard J., Garnier S.A. Interaction of adriamycin with negatively charged model membranes: Evidence of two types of binding sites. Biochemistry. 1985;24:7085–7092. doi: 10.1021/bi00346a010. - DOI - PubMed
    1. Avitabile C., D’Andrea L.D., Romanelli A. Circular Dichroism studies on the interactions of antimicrobial peptides with bacterial cells. Sci. Rep. 2014;4:4293. doi: 10.1038/srep04293. - DOI - PMC - PubMed

LinkOut - more resources