. 2022 Jun 14;27(12):3823.
doi: 10.3390/molecules27123823.

Protective Effects of Liquiritigenin against Cisplatin-Induced Nephrotoxicity via NRF2/SIRT3-Mediated Improvement of Mitochondrial Function

Affiliations

Protective Effects of Liquiritigenin against Cisplatin-Induced Nephrotoxicity via NRF2/SIRT3-Mediated Improvement of Mitochondrial Function

Meng Zhou et al. Molecules. .

Abstract

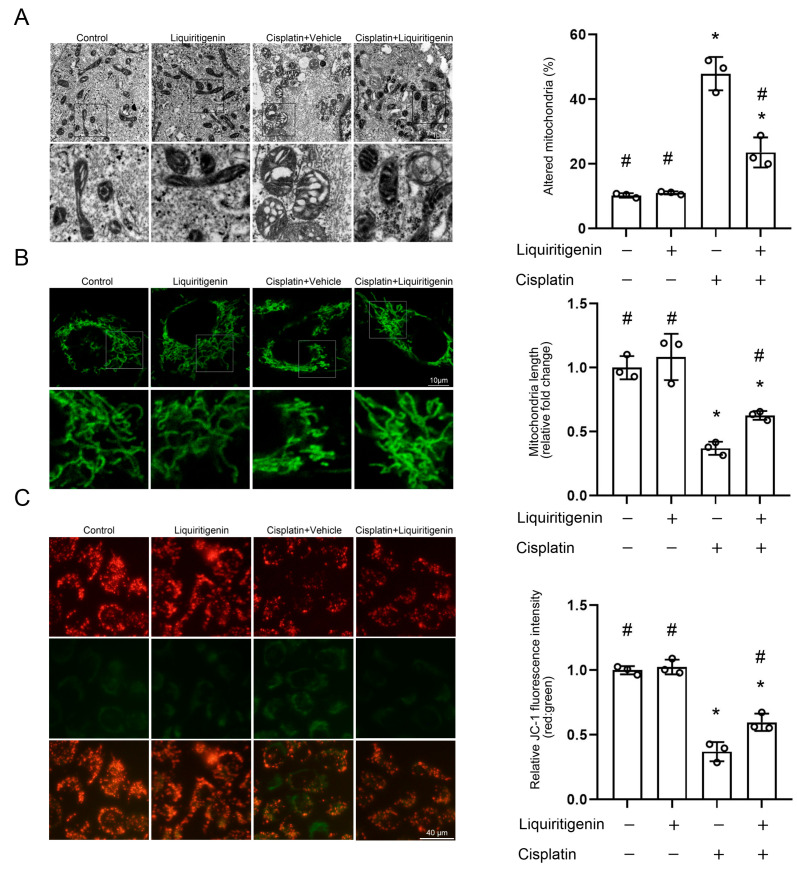
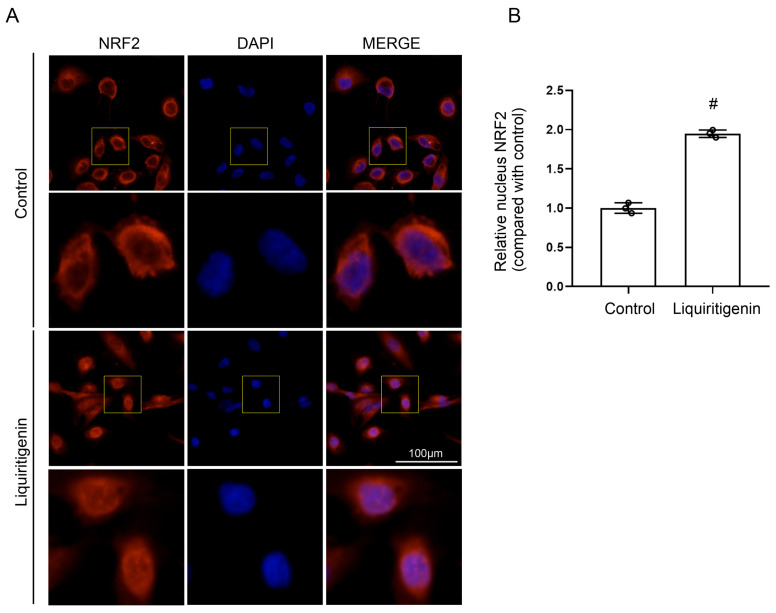
Acute kidney injury (AKI) induced by cisplatin (CP), a first-line anticancer drug for chemotherapy, is common. To date, there is an urgent need to find effective treatments to reduce the nephrotoxicity caused by CP. Meanwhile, the restoration of mitochondrial dysfunction shows potential to be used as an adjunct to conventional therapeutic strategies. This study found that liquiritigenin can ameliorate mitochondrial dysfunction and acute kidney injury induced by CP in mice. The intraperitoneal injection of 15 mg/kg body weight liquiritigenin for 2 days markedly protected against CP-induced mitochondrial dysfunction, restored renal tubule and mitochondrial morphology, decreased blood Scr and BUN levels, and decreased cell apoptosis. Furthermore, the elevated expression of SIRT3 induced by liquiritigenin, which can be upregulated by NRF2, was confirmed in vivo and in vitro. The underlying protective mechanisms of liquiritigenin in CP-induced nephrotoxicity were then investigated. Molecular docking results showed that liquiritigenin has potent binding activities to KEAP1, GSK-3β and HRD1. Further results showed that liquiritigenin induced the nuclear translocation of NRF2 and increased the levels of mitochondrial bioenergetics-related protein such as PGC-1α, and TFAM, which are related to NRF2 activity and mitochondrial biogenesis. In addition, liquiritigenin was found to possibly reverse the decrease in BCL2/BAX ratio induced by CP in live cultured renal tubule epithelial cells. Collectively, these results indicated that liquiritigenin could be used as a potential nephroprotective agent to protect against cisplatin-induced acute kidney injury in a NRF2-dependent manner by improving mitochondria function.

Keywords: NRF2; SIRT3; cisplatin; liquiritigenin; mitochondrial biogenesis.


Conflict of interest statement

The authors declare no conflict of interest.

Figures

Figure 1
Figure 1
The effect of liquiritigenin on AKI induced by CP in mice. (A) Representative micrographs of HE staining in the kidney from different groups of mice. (B) Quantitative pathological assessment of tubular damage from different groups of mice. Renal morphology was scored according to the proportion of damaged renal tubules, such as brush border, tubule dilatation, and cast formation in the total renal tubules. The scoring criteria were as follows: 0, normal; 1, <10%; 2, 10~25%; 3, 26~50%; 4, 51~75% and 5, >75%. * p < 0.05 vs. control group of mice, # p < 0.05 vs. mice with CP treatment (n = 9 mice/group). (C) Serum creatinine levels of mice in different groups. * p < 0.05 vs. control group of mice, # p < 0.05 vs. mice with CP treatment (n = 9 mice/group). (D) Blood urea nitrogen levels of mice in different groups. * p < 0.05 vs. control group of mice, # p < 0.05 vs. mice with CP treatment (n = 9 mice/group).
Figure 2
Figure 2
The effect of liquiritigenin on CP-induced apoptosis of renal tubule epithelial cells. (A) TdT-mediated dUTP nickend labeling (TUNEL) assays were performed to assess renal cell death. Nuclei were revealed using 4′,6-diamidino-2-phenylindole staining. (B) Representative flow charts showed that cell apoptosis was determined by flow cytometric analysis in renal tubule epithelial cells with different treatments. Cells stained with fluorescein isothiocyanate (FITC)-conjugated AnnexinV and propidiumiodide (PI). (C) Quantitative assessment of the TUNEL+ cells (numbers per high-power field) in mice kidneys. * p < 0.05 vs. vehicle-control group, # p < 0.05 vs. CP treatment group (n = 6 mice/group). (D) Quantification of the percentage of apoptotic cells. * p < 0.05 vs. vehicle-control group, # p < 0.05 vs. CP treatment group. Data were obtained from three independent experiments. (E) 3-(4,5-Dimethyl-2-thiazolyl)-2,5-diphenyl-2H-tetrazolium bromide (MTT) assays were performed to assess cell viability in renal tubule epithelial cells with different treatments. * p < 0.05 vs. vehicle-control group, # p < 0.05 vs. CP treatment group. Data were from five independent biological replicates.
Figure 3
Figure 3
The effect of liquiritigenin on CP-induced mitochondrial damage. (A) Representative TEM images on the left showing mitochondrial morphology and mitochondria diameter of live cultured renal tubule epithelial cells with different treatments. Quantitative assessment of the percentage of altered mitochondria characterized by mitochondria swelling, vacuolization, and cristae fragmentation. * p < 0.05 vs. vehicle-control group, # p < 0.05 vs. CP treatment group. Data were obtained from three independent biological replicates. (B) Representative images for MitoTracker greens staining showing mitochondrial morphology and mitochondria length in live cultured renal tubule epithelial cells with different treatments. The results were normalized to the mitochondrial length of the vehicle-control group. * p < 0.05 vs. vehicle-control group, # p < 0.05 vs. CP treatment group. Data were obtained from three independent biological replicates. (C) Representative images of renal tubule epithelial cells stained with JC-1 showing changes in fluorescence intensity in live cultured renal tubule epithelial cells with different treatments. JC-1 fluorescence was normalized to the red-to-green ratio of the vehicle-control group. * p < 0.05 vs. vehicle-control group, # p < 0.05 vs. CP treatment group. Data were obtained from three independent biological replicates.
Figure 4
Figure 4
Structure charts of molecular docking models. Docking simulation for the interaction between liquiritigenin with KEAP1 (A), HRD1 (B), and GSK-3β (C) in a general overview, a local overview and 2D overview.
Figure 5
Figure 5
The effect of liquiritigenin on the nuclear translocation of NRF2. (A) Subcellular location of NRF2 determined by immunofluorescence microscopy in live cultured renal tubule epithelial cells with liquiritigenin treatment. Nuclei were revealed using 4′,6-diamidino-2-phenylindole staining (DAPI). (B) Quantification of nucleus NRF2 fluorescence density. The results were normalized to the ratio of the nucleus NRF2 of vehicle-control. # p < 0.05 vs. the vehicle-control group. Data were obtained from three independent biological replicates.
Figure 6
Figure 6
The effect of liquiritigenin on the protein levels through NRF2-SIRT3 signaling. (A) Representative photomicrographs of SIRT3 immunohistochemical staining in the kidneys from different groups of mice. (B) Representative Western blot gel documents and summarizes the data showing the levels of SIRT3 in the kidney from different groups of mice (n = 6 mice/group). * p < 0.05 vs. control group of mice, # p < 0.05 vs. mice with CP treatment. (C) Representative Western blot gel documents and summarized data show the levels of SIRT3 in live cultured renal tubule epithelial cells with different treatments. * p < 0.05 vs. control group, # p < 0.05 vs. CP treatment group. Data were obtained from six independent biological replicates. (D) Representative western blot gel documents and summarized data showing the levels of PGC-1α and TFAM in live cultured renal tubule epithelial cells with different treatments. * p < 0.05 vs. control group, # p < 0.05 vs. CP treatment group. Data were from six independent biological replicates. (E) Representative Western blot gel documents and summarized data showing the levels of BCL2 and BAX in live cultured renal tubule epithelial cells with different treatments. * p < 0.05 vs. control group, # p < 0.05 vs. CP treatment group. Data were obtained from six independent biological replicates.
Figure 7
Figure 7
Schematic representation showing the possible mechanisms underlying the protective effect of liquiritigenin against CP-induced AKI. Under pathological conditions, CP leads to mitochondria dysfunction, which contributes to the impaired renal tubule epithelial cells and kidney injury. Firstly, liquiritigenin activates NRF2 by binding to KEAP1, GSK-3β, and HRD1, which can directly inhibit the nuclear translocation and promote the degradation of NRF2 in multiple ways. Subsequently, NRF2 promotes the transcription of SIRT3. In the cytoplasm, SIRT3 deacetylates Ku70, inhibiting the mitochondrial translocation of BAX. Meanwhile, SIRT3 mediates the increased protein level of BCL2. Furthermore, liquiritigenin increases the expression of PGC-1α, which upregulates the SIRT3/TFAM pathway. Eventually, mitochondrial biogenesis is promoted and cell apoptosis is inhibited.

Similar articles

Cited by

References

    1. Lopez-Hernandez F.J., Lopez-Novoa J.M. Potential utility of PPAR alpha activation in the prevention of ischemic and drug-induced acute renal damage. Kidney Int. 2009;76:1022–1024. doi: 10.1038/ki.2009.229. - DOI - PubMed
    1. Miller R.P., Tadagavadi R.K., Ramesh G., Reeves W.B. Mechanisms of Cisplatin Nephrotoxicity. Toxins. 2010;2:2490–2518. doi: 10.3390/toxins2112490. - DOI - PMC - PubMed
    1. Kleih M., Böpple K., Dong M., Gaißler A., Heine S., Olayioye M.A., Aulitzky W.E., Essmann F. Direct impact of cisplatin on mitochondria induces ROS production that dictates cell fate of ovarian cancer cells. Cell Death Dis. 2019;10:851. doi: 10.1038/s41419-019-2081-4. - DOI - PMC - PubMed
    1. Brooks C., Wei Q., Cho S.-G., Dong Z. Regulation of mitochondrial dynamics in acute kidney injury in cell culture and rodent models. J. Clin. Investig. 2009;119:1275–1285. doi: 10.1172/JCI37829. - DOI - PMC - PubMed
    1. Palmer C.S., Osellame L.D., Stojanovski D., Ryan M.T. The regulation of mitochondrial morphology: Intricate mechanisms and dynamic machinery. Cell. Signal. 2011;23:1534–1545. doi: 10.1016/j.cellsig.2011.05.021. - DOI - PubMed