

High Iron Exposure from the Fetal Stage to Adulthood in Mice Alters Lipid Metabolism
- PMID: 35745181
- PMCID: PMC9227341
- DOI: 10.3390/nu14122451
High Iron Exposure from the Fetal Stage to Adulthood in Mice Alters Lipid Metabolism
Abstract
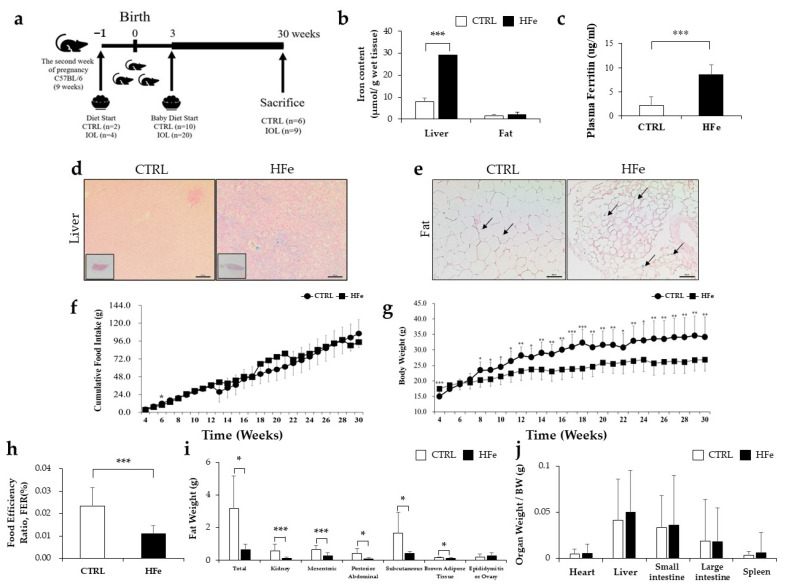
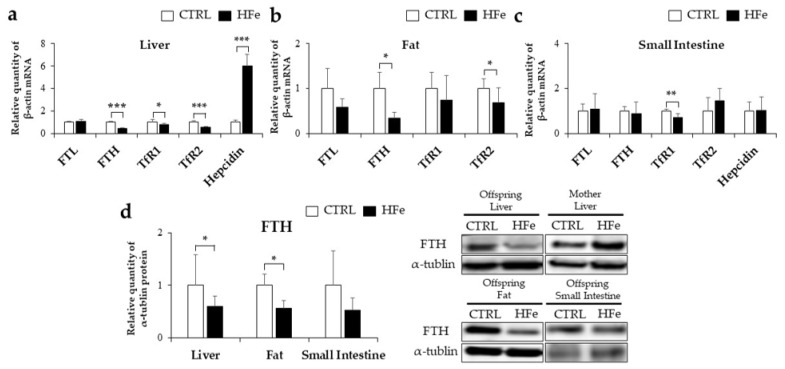
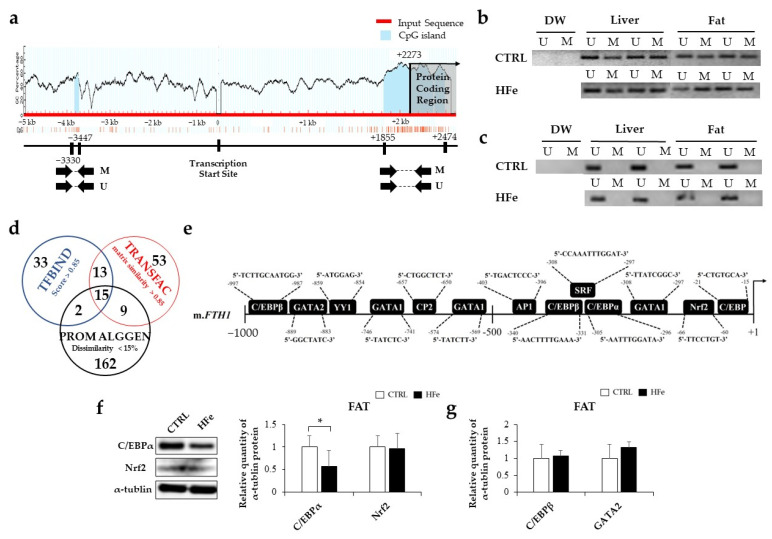
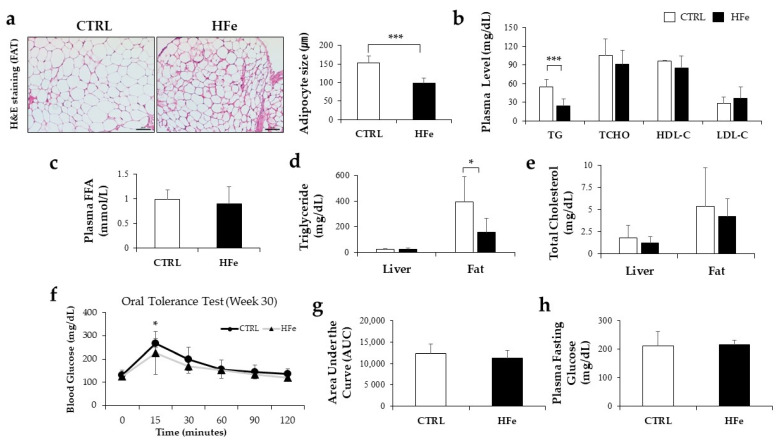
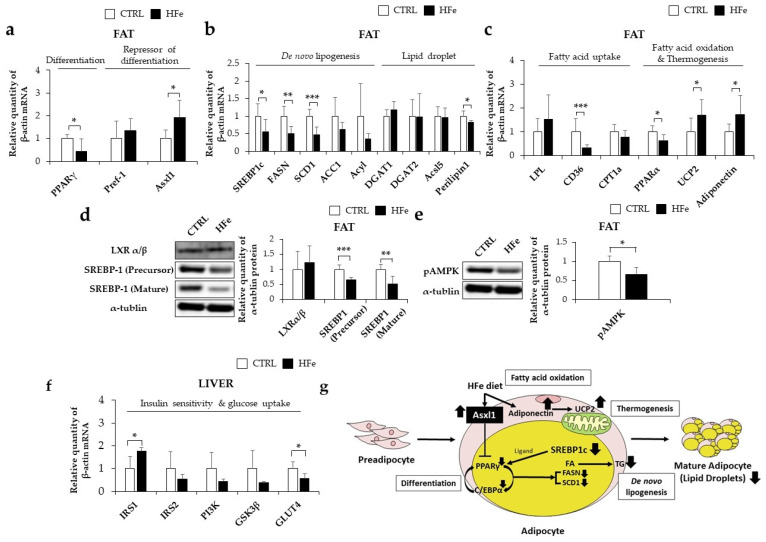
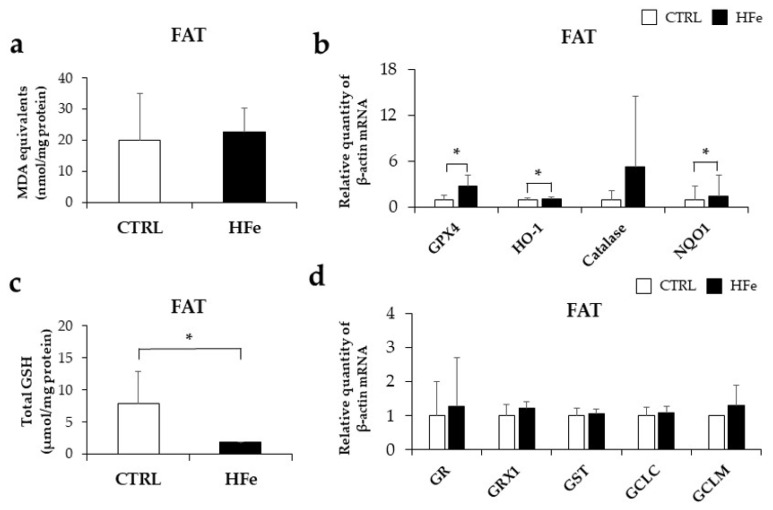
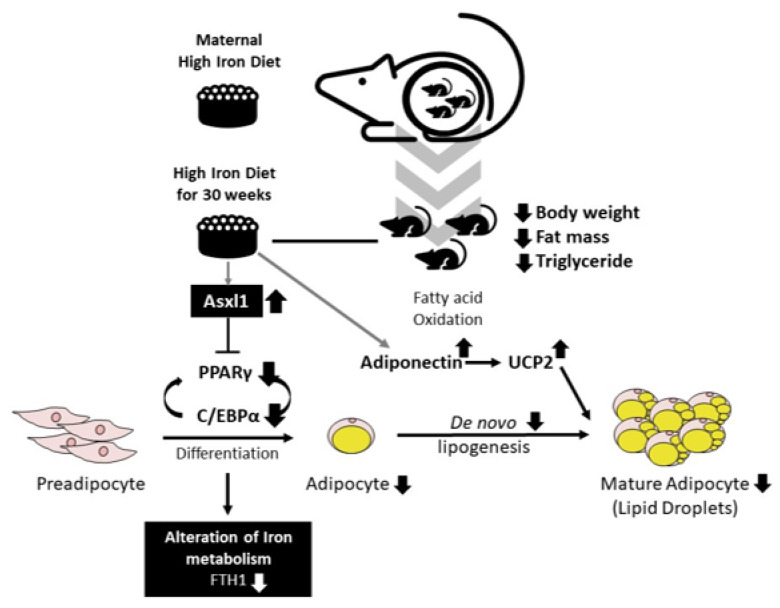
Iron supplementation is recommended during pregnancy and fetal growth. However, excess iron exposure may increase the risk of abnormal fetal development. We investigated the potential side effects of high iron levels in fetuses and through their adult life. C57BL/6J pregnant mice from 2 weeks of gestation and their offspring until 30 weeks were fed a control (CTRL, FeSO4 0 g/1 kg) or high iron (HFe, FeSO4 9.9 g/1 kg) diets. HFe group showed higher iron accumulation in the liver with increased hepcidin, reduced TfR1/2 mRNAs, and lowered ferritin heavy chain (FTH) proteins in both liver and adipose tissues despite iron loading. HFe decreased body weight, fat weight, adipocyte size, and triglyceride levels in the blood and fat, along with downregulation of lipogenesis genes, including PPARγ, C/EBPα, SREBP1c, FASN, and SCD1, and fatty acid uptake and oxidation genes, such as CD36 and PPARα. UCP2, adiponectin, and mRNA levels of antioxidant genes such as GPX4, HO-1, and NQO1 were increased in the HFe group, while total glutathione was reduced. We conclude that prolonged exposure to high iron from the fetal stage to adulthood may decrease fat accumulation by altering ferritin expression, adipocyte differentiation, and triglyceride metabolism, resulting in an alteration in normal growth.
Keywords: dietary iron intake; ferritin heavy chain; high dietary iron; high iron exposure; iron homeostasis; lipid metabolism; maternal iron status.
Conflict of interest statement
The authors declare no conflict of interest.
Figures
Similar articles
-
Heterozygous Hfe gene deletion leads to impaired glucose homeostasis, but not liver injury in mice fed a high-calorie diet.Physiol Rep. 2016 Jun;4(12):e12837. doi: 10.14814/phy2.12837. Physiol Rep. 2016. PMID: 27354540 Free PMC article.
-
Altered lipid metabolism in Hfe-knockout mice promotes severe NAFLD and early fibrosis.Am J Physiol Gastrointest Liver Physiol. 2011 Nov;301(5):G865-76. doi: 10.1152/ajpgi.00150.2011. Epub 2011 Aug 4. Am J Physiol Gastrointest Liver Physiol. 2011. PMID: 21817060
-
Fetal liver X receptor activation acutely induces lipogenesis but does not affect plasma lipid response to a high-fat diet in adult mice.Am J Physiol Endocrinol Metab. 2009 Nov;297(5):E1171-8. doi: 10.1152/ajpendo.00021.2009. Epub 2009 Sep 1. Am J Physiol Endocrinol Metab. 2009. PMID: 19724022
-
The effect of iron deficiency on the temporal changes in the expression of genes associated with fat metabolism in the pregnant rat.Physiol Rep. 2016 Nov;4(21):e12908. doi: 10.14814/phy2.12908. Epub 2016 Nov 15. Physiol Rep. 2016. PMID: 27905292 Free PMC article.
-
Carnosic Acid Modulates Increased Hepatic Lipogenesis and Adipocytes Differentiation in Ovariectomized Mice Fed Normal or High-Fat Diets.Nutrients. 2018 Dec 15;10(12):1984. doi: 10.3390/nu10121984. Nutrients. 2018. PMID: 30558262 Free PMC article.
Cited by
-
Dose effects of iron on growth, antioxidant potential, intestinal morphology, and intestinal barrier in yellow-feathered broilers.Poult Sci. 2025 Mar;104(3):104865. doi: 10.1016/j.psj.2025.104865. Epub 2025 Feb 1. Poult Sci. 2025. PMID: 39919560 Free PMC article.
-
L-Citrulline Supplementation Restrains Ferritinophagy-Mediated Ferroptosis to Alleviate Iron Overload-Induced Thymus Oxidative Damage and Immune Dysfunction.Nutrients. 2022 Oct 28;14(21):4549. doi: 10.3390/nu14214549. Nutrients. 2022. PMID: 36364817 Free PMC article.
References
-
- Rodriguez-Bernal C., Rebagliato M., Ballester F. Maternal nutrition and fetal growth: The role of iron status and intake during pregnancy. Nutr. Diet. Suppl. 2012;4:25–37. doi: 10.2147/NDS.S13093. - DOI
-
- Ronnenberg A.G., Wood R.J., Wang X., Xing H., Chen C., Chen D., Guang W., Huang A., Wang L., Xu X. Preconception hemoglobin and ferritin concentrations are associated with pregnancy outcome in a prospective cohort of Chinese women. J. Nutr. 2004;134:2586–2591. doi: 10.1093/jn/134.10.2586. - DOI - PubMed
MeSH terms
Substances
Grants and funding
LinkOut - more resources
Full Text Sources
Miscellaneous
