. 2022 Jun 18;14(12):2539.
doi: 10.3390/nu14122539.

1H NMR-Based Metabolomics Reveals the Intrinsic Interaction of Age, Plasma Signature Metabolites, and Nutrient Intake in the Longevity Population in Guangxi, China

Affiliations

1H NMR-Based Metabolomics Reveals the Intrinsic Interaction of Age, Plasma Signature Metabolites, and Nutrient Intake in the Longevity Population in Guangxi, China

He Li et al. Nutrients. .

Abstract

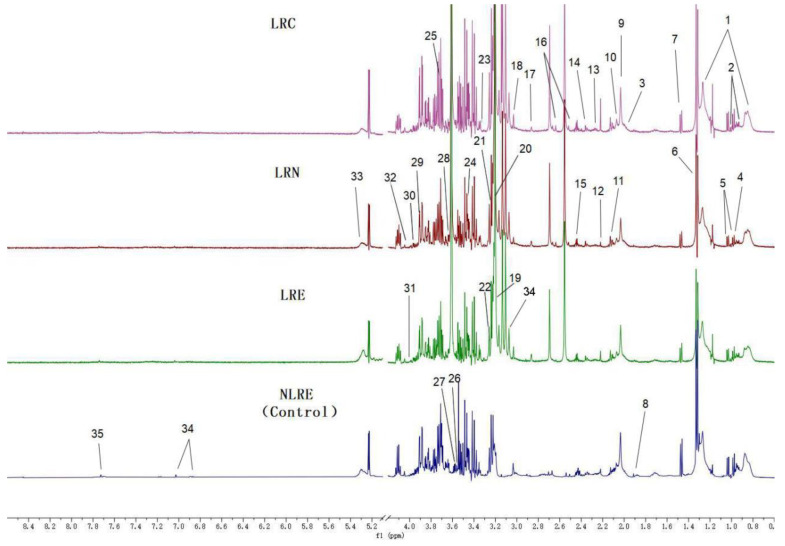
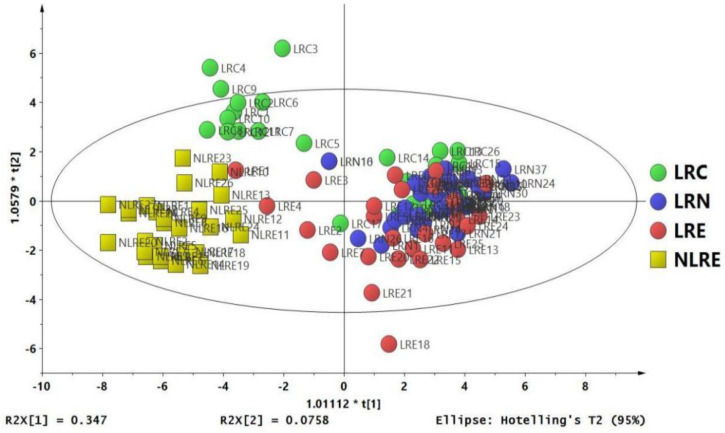
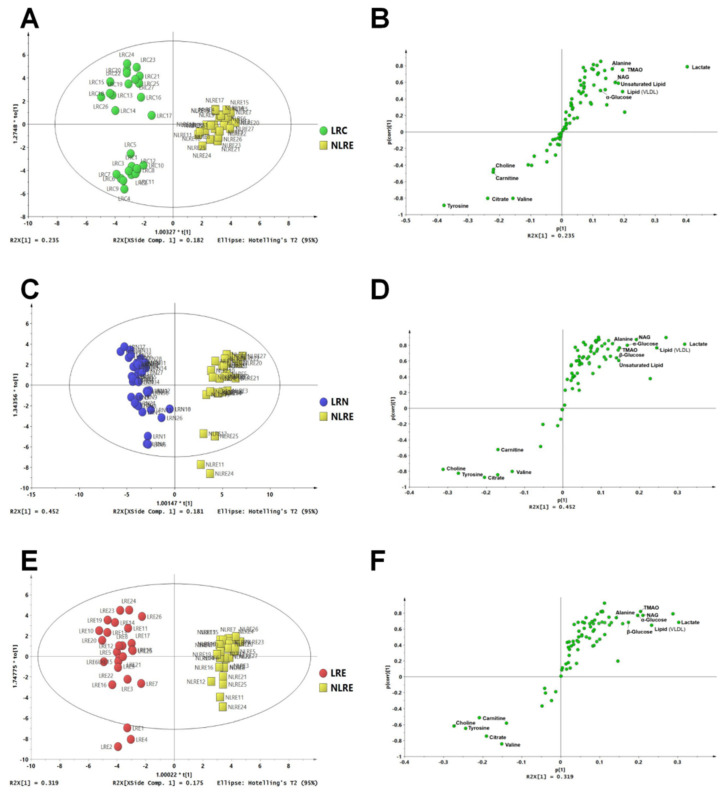
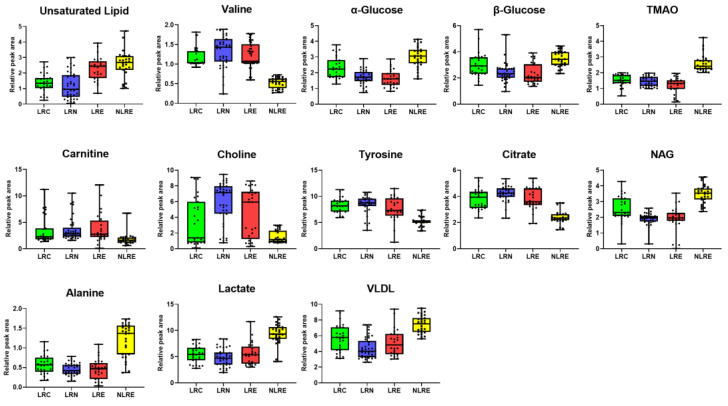
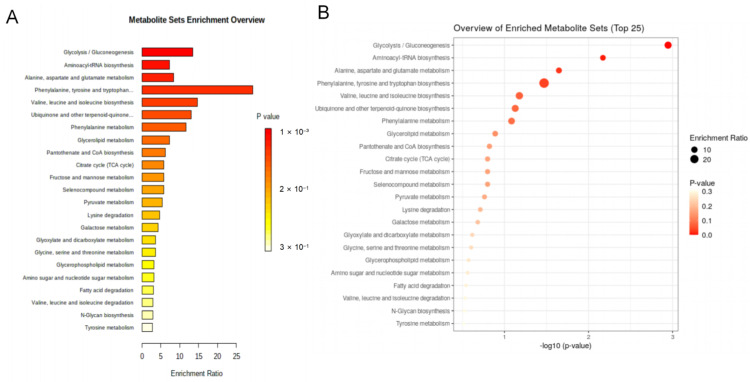
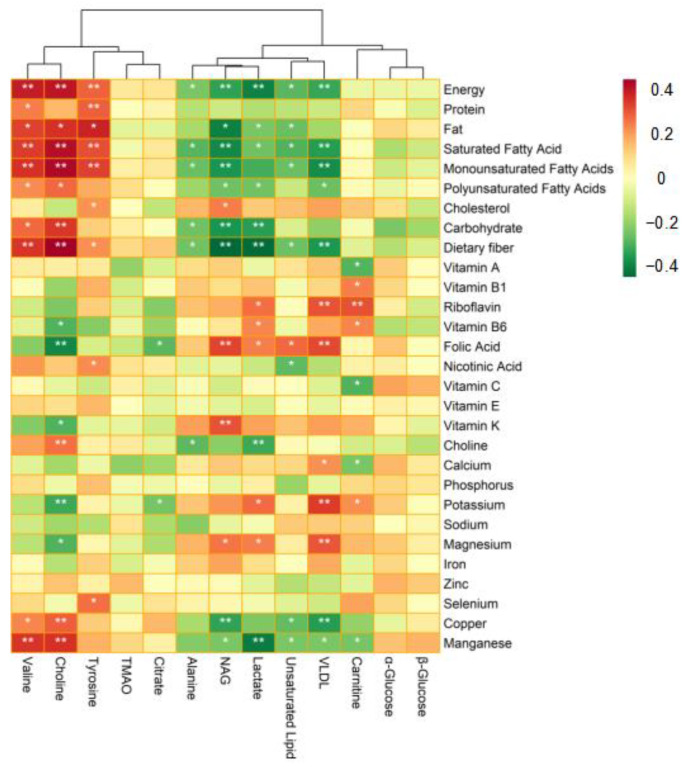
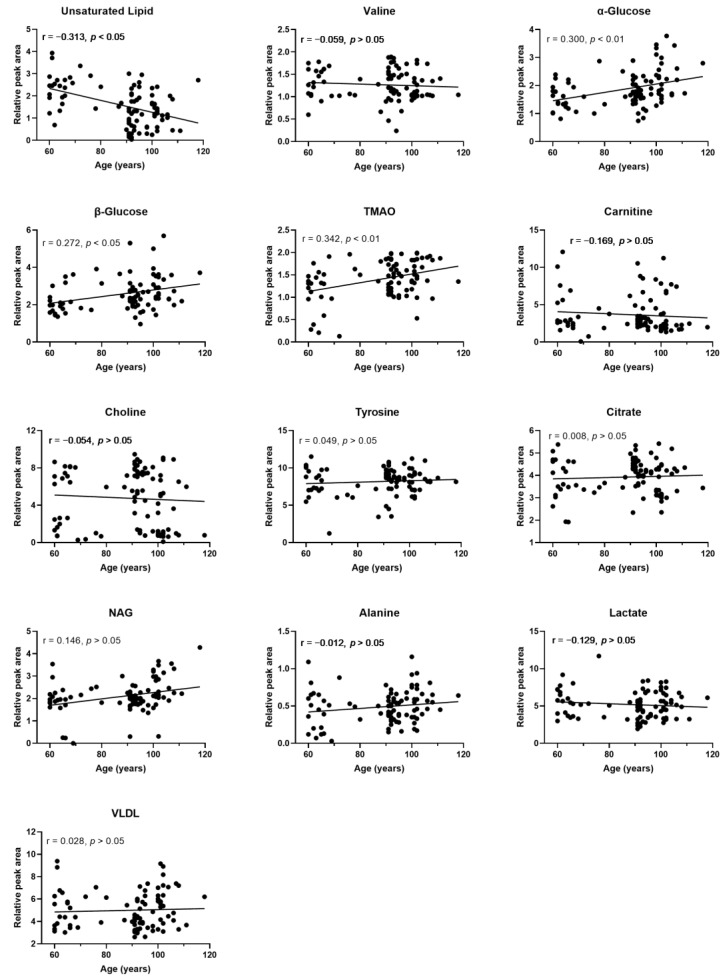
Health and longevity populations have distinct metabolic and nutrient intake profiles. However, the relationship between biomarkers of longevity-related metabolites and dietary nutrient intake profiles, as well as metabolic markers associated with longevity features, have not been fully elucidated. Therefore, 1H nuclear magnetic resonance (1H NMR)-based plasma metabolomics profiling was conducted in the present study to identify potential metabolites which can be used as specific markers for the evaluation of healthy aging. Plasma samples were obtained from centenarians and nonagenarians from the longevous region, and elderly participants aged 60-89 from the longevous region, as well as a low centenarian ratio region. The results showed that participants from longevous regions exhibited higher plasma levels of citrate, tyrosine, choline, carnitine, and valine, as well as lower contents of VLDL, lactate, alanine, N-acetyl glycoprotein (NAG), trimethylamine oxide (TMAO), α-glucose, β-glucose, and unsaturated lipids. The differential plasma metabolites were associated with an alteration in glycolysis/gluconeogenesis; aminoacyl-tRNA biosynthesis; alanine, aspartate, and glutamate metabolism; and phenylalanine, tyrosine, and tryptophan biosynthesis in participants from longevous regions. The signature metabolites were associated with higher dietary fiber intake, as well as lower energy and fat intake. The results of the present study demonstrate key longevity signature metabolites in plasma, and the dietary patterns identified provide a basis for further health and longevity research.

Keywords: 1H NMR; centenarians; healthy aging; longevity; metabolomic profiling; nutrient intake.


Conflict of interest statement

The authors declare no conflict of interest.

Figures

Figure 1
Figure 1
1H NMR spectra (500 MHz) of plasma metabolites from samples of healthy subjects at different ages from the longevous region (LRC, LRN, and LRE) and control region (NLRE). Assignments and marks of plasma metabolites: (1) lipids (mainly VLDL); (2) isoleucine; (3) proline; (4) leucine; (5) valine; (6) lactate; (7) alanine; (8) acetic acid; (9) N-acetyl glycoprotein (NAG); (10) glutamic acid; (11) glutamine; (12) propanone; (13) acetoacetic acid; (14) pyranic acid; (15) succinic acid; (16) citrate; (17) trimethylamine; (18) creatine; (19) choline; (20) carnitine; (21) phosphorylcholine; (22) trimethylamine oxide (TMAO); (23) scyllitol; (24) β-glucose; (25) α-glucose; (26) glycine; (27) threonine; (28) inositol; (29) glycerophosphocholine (GPC); (30) 1-methylhistidine; (31) creatine; (32) triglyceride; (33) unsaturated lipid; (34) tyrosine; (35) histidine.
Figure 2
Figure 2
OPLS-DA score plot of the LRC, LRN, LRE, and NLRE groups showing the clustering of samples in the training set.
Figure 3
Figure 3
Plasma metabolic profiles of participants from the longevous region and control region. OPLS-DA score plots (A,C,E) showing clustering of metabolites, and s-plot (B,D,F) showing identified metabolites. Comparisons between LRC and NLRE (A,B), between LRN and NLRE (C,D), and between LRE and NLRE (E,F) showing metabolites associated with longevity.
Figure 4
Figure 4
Box plot of differential metabolites levels among LRC (green), LRN (blue), LRE (red), and NLRE (yellow) groups.
Figure 5
Figure 5
Significantly enriched metabolic pathways associated with differentially expressed pathways identified using the MetaboAnalyst 5.0 tool (4 March 2022), Metabolite sets enrichment overview (A); overview of enriched metabolite sets of the top 25 (B): (1) glycolysis/gluconeogenesis (p < 0.01); (2) aminoacyl-tRNA biosynthesis (p < 0.01); (3) alanine, aspartate, and glutamate metabolism (p < 0.05); (4) phenylalanine, tyrosine, and tryptophan biosynthesis (p < 0.05).
Figure 6
Figure 6
Heatmap showing the Spearman rank correlations between nutrient intake and differential metabolites. Red color indicates a positive correlation, whereas green color indicates a negative correlation; * represents p < 0.05; ** denotes p < 0.01. Analysis was conducted after adjustment for age, gender, and BMI. Correlation coefficients between dietary fiber intake and choline (r = 0.431, p < 0.01), NAG (r = −0.412, p < 0.01), and lactate (r = −0.401, p < 0.01) metabolites were high.
Figure 7
Figure 7
Relationship between plasma signature metabolites and age. Rank tests with Pearson’s correlation coefficient were used to evaluate correlations between plasma signature metabolites and age of longevous region participants (adjusted for gender and BMI).

References

    1. Fontana L., Partridge L. Promoting health and longevity through diet: From model organisms to humans. Cell. 2015;161:106–118. doi: 10.1016/j.cell.2015.02.020. - DOI - PMC - PubMed
    1. Green C.L., Lamming D.W., Fontana L. Molecular mechanisms of dietary restriction promoting health and longevity. Nat. Rev. Mol. Cell Biol. 2022;23:56–73. doi: 10.1038/s41580-021-00411-4. - DOI - PMC - PubMed
    1. Estruch R., Ros E., Salas-Salvado J., Covas M.I., Corella D., Aros F., Gomez-Gracia E., Ruiz-Gutierrez V., Fiol M., Lapetra J., et al. Retraction and Republication: Primary Prevention of Cardiovascular Disease with a Mediterranean Diet. N. Engl. J. Med. 2018;378:2441–2442. doi: 10.1056/NEJMc1806491. - DOI - PubMed
    1. Bertram H.C., Larsen L.B., Chen X., Jeppesen P.B. Impact of high-fat and high-carbohydrate diets on liver metabolism studied in a rat model with a systems biology approach. J. Agric. Food Chem. 2012;60:676–684. doi: 10.1021/jf203994k. - DOI - PubMed
    1. Macias S., Kirma J., Yilmaz A., Moore S.E., McKinley M.C., McKeown P.P., Woodside J.V., Graham S.F., Green B.D. Application of 1H-NMR Metabolomics for the Discovery of Blood Plasma Biomarkers of a Mediterranean Diet. Metabolites. 2019;9:201. doi: 10.3390/metabo9100201. - DOI - PMC - PubMed

LinkOut - more resources