

Ginsenoside Compound K Protects against Obesity through Pharmacological Targeting of Glucocorticoid Receptor to Activate Lipophagy and Lipid Metabolism
- PMID: 35745765
- PMCID: PMC9231161
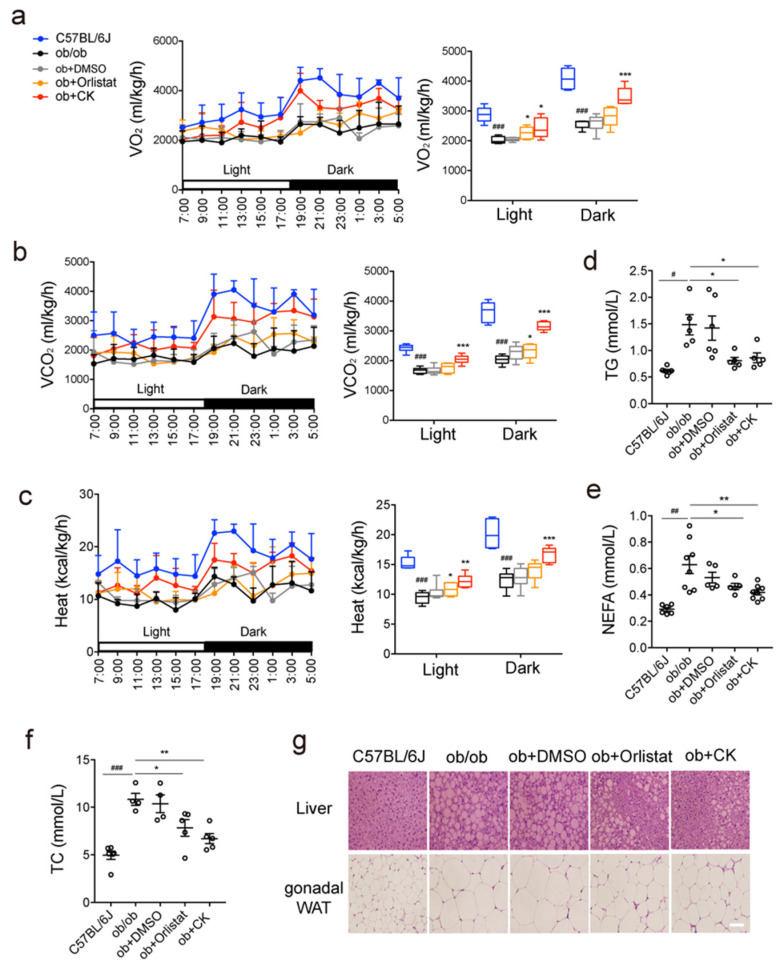
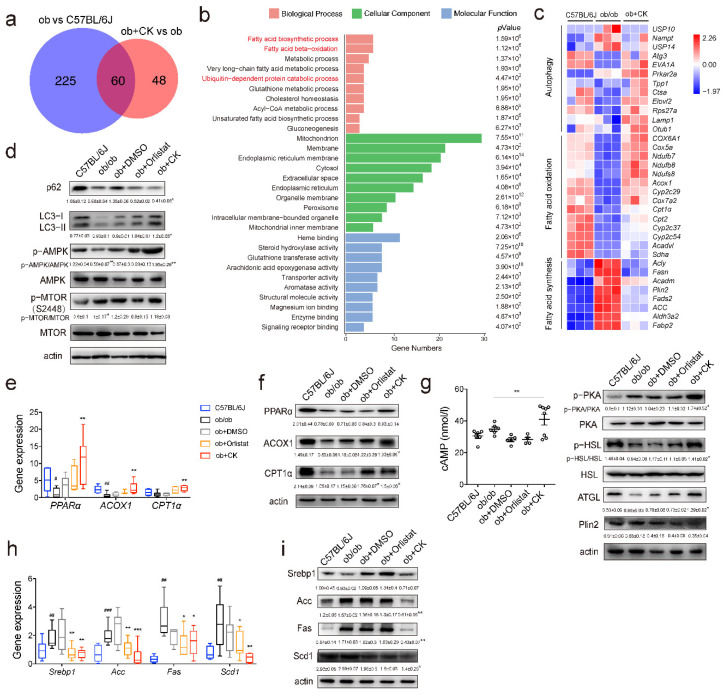
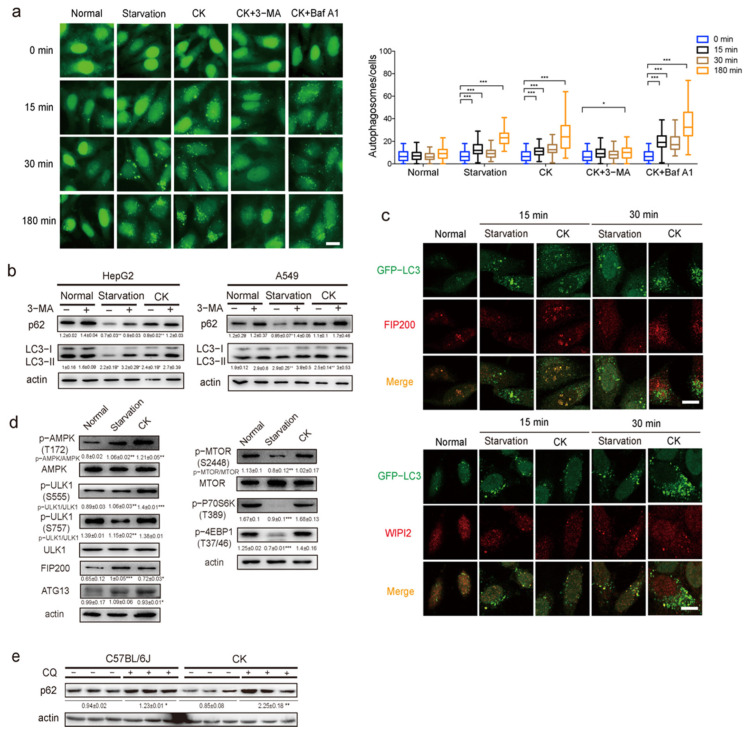
- DOI: 10.3390/pharmaceutics14061192
Ginsenoside Compound K Protects against Obesity through Pharmacological Targeting of Glucocorticoid Receptor to Activate Lipophagy and Lipid Metabolism
Abstract
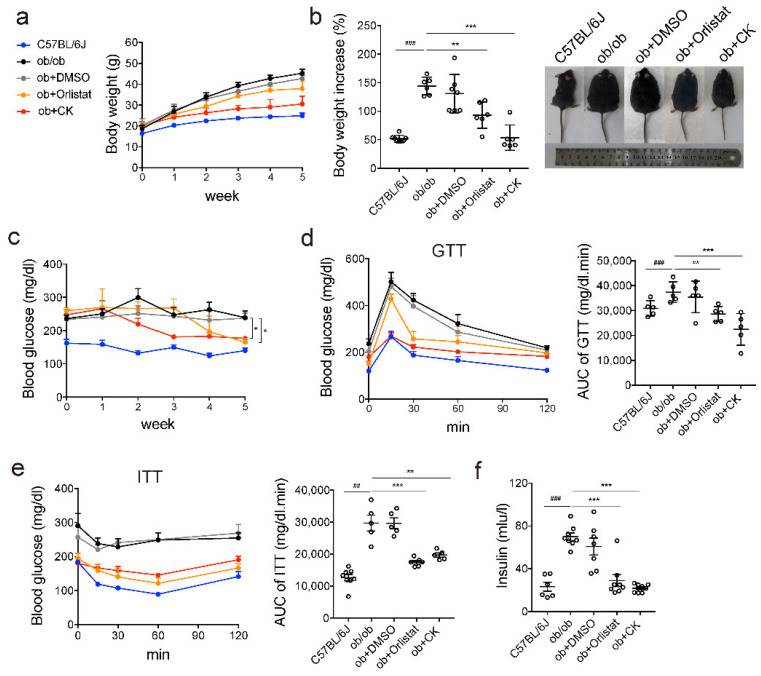
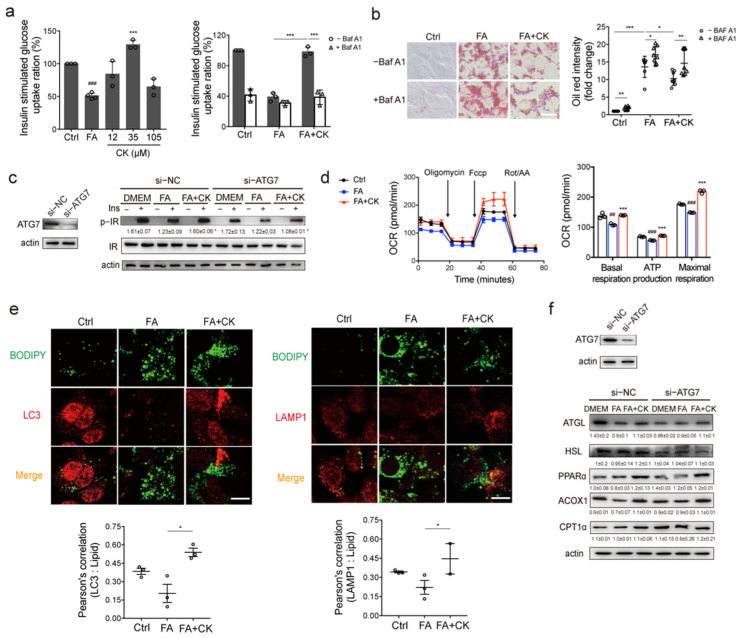
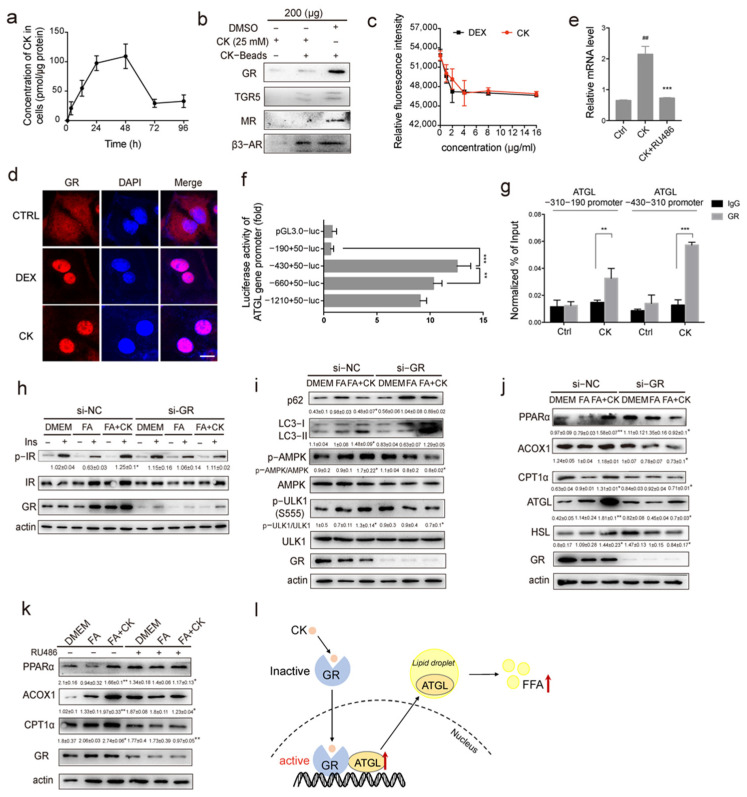
(1) Background: The glucocorticoid receptor (GR) plays a key role in lipid metabolism, but investigations of GR activation as a potential therapeutic approach have been hampered by a lack of selective agonists. Ginsenoside compound K (CK) is natural small molecule with a steroid-like structure that offers a variety of therapeutic benefits. Our study validates CK as a novel GR agonist for the treatment of obesity. (2) Methods: By using pulldown and RNA interference, we determined that CK binds to GR. The anti-obesity potential effects of CK were investigated in obese mice, including through whole-body energy homeostasis, glucose and insulin tolerance, and biochemical and proteomic analysis. Using chromatin immunoprecipitation, we identified GR binding sites upstream of lipase ATGL. (3) Results: We demonstrated that CK reduced the weight and blood lipids of mice more significantly than the drug Orlistat. Proteomics data showed that CK up-regulated autophagy regulatory proteins, enhanced fatty acid oxidation proteins, and decreased fatty acid synthesis proteins. CK induced lipophagy with the initial formation of the phagophore via AMPK/ULK1 activation. However, a blockade of autophagy did not disturb the increase in CK on lipase expression, suggesting that autophagy and lipase are independent pathways in the function of CK. The pulldown and siRNA experiments showed that GR is the critical target. After binding to GR, CK not only activated lipophagy, but also promoted the binding of GR to the ATGL promoter. (4) Conclusions: Our findings indicate that CK is a natural food candidate for reducing fat content and weight.
Keywords: ATGL; GR; ginsenoside CK; lipid metabolism; lipophagy.
Conflict of interest statement
The authors declare that they have no conflict of interest.
Figures
Similar articles
-
Bioconversion, Pharmacokinetics, and Therapeutic Mechanisms of Ginsenoside Compound K and Its Analogues for Treating Metabolic Diseases.Curr Issues Mol Biol. 2024 Mar 11;46(3):2320-2342. doi: 10.3390/cimb46030148. Curr Issues Mol Biol. 2024. PMID: 38534764 Free PMC article. Review.
-
ATGL Promotes Autophagy/Lipophagy via SIRT1 to Control Hepatic Lipid Droplet Catabolism.Cell Rep. 2017 Apr 4;19(1):1-9. doi: 10.1016/j.celrep.2017.03.026. Cell Rep. 2017. PMID: 28380348 Free PMC article.
-
The ménage à trois of autophagy, lipid droplets and liver disease.Autophagy. 2022 Jan;18(1):50-72. doi: 10.1080/15548627.2021.1895658. Epub 2021 Apr 2. Autophagy. 2022. PMID: 33794741 Free PMC article. Review.
-
Identification of novel lipid droplet factors that regulate lipophagy and cholesterol efflux in macrophage foam cells.Autophagy. 2021 Nov;17(11):3671-3689. doi: 10.1080/15548627.2021.1886839. Epub 2021 Feb 26. Autophagy. 2021. PMID: 33590792 Free PMC article.
-
Quercetin enhances fatty acid β-oxidation by inducing lipophagy in AML12 hepatocytes.Heliyon. 2021 Jun 18;7(6):e07324. doi: 10.1016/j.heliyon.2021.e07324. eCollection 2021 Jun. Heliyon. 2021. PMID: 34195429 Free PMC article.
Cited by
-
Bioconversion, Pharmacokinetics, and Therapeutic Mechanisms of Ginsenoside Compound K and Its Analogues for Treating Metabolic Diseases.Curr Issues Mol Biol. 2024 Mar 11;46(3):2320-2342. doi: 10.3390/cimb46030148. Curr Issues Mol Biol. 2024. PMID: 38534764 Free PMC article. Review.
-
Ginsenoside Rb1, Compound K and 20(S)-Protopanaxadiol Attenuate High-Fat Diet-Induced Hyperlipidemia in Rats via Modulation of Gut Microbiota and Bile Acid Metabolism.Molecules. 2024 Mar 1;29(5):1108. doi: 10.3390/molecules29051108. Molecules. 2024. PMID: 38474620 Free PMC article.
-
Knockdown of NR3C1 inhibits the proliferation and migration of clear cell renal cell carcinoma through activating endoplasmic reticulum stress-mitophagy.J Transl Med. 2023 Oct 8;21(1):701. doi: 10.1186/s12967-023-04560-2. J Transl Med. 2023. PMID: 37807060 Free PMC article.
-
The steroid hormone 20-hydroxyecdysone induces lipophagy via the brain-adipose tissue axis by promoting the adipokinetic hormone pathway.J Biol Chem. 2025 Feb;301(2):108179. doi: 10.1016/j.jbc.2025.108179. Epub 2025 Jan 10. J Biol Chem. 2025. PMID: 39798879 Free PMC article.
References
Grants and funding
LinkOut - more resources
Full Text Sources
Research Materials