. 2022 Jun 20;14(12):2511.
doi: 10.3390/polym14122511.

Laser-Assisted Melt Electrospinning of Poly(L-lactide-co-ε-caprolactone): Analyses on Processing Behavior and Characteristics of Prepared Fibers

Affiliations

Laser-Assisted Melt Electrospinning of Poly(L-lactide-co-ε-caprolactone): Analyses on Processing Behavior and Characteristics of Prepared Fibers

Zongzi Hou et al. Polymers (Basel). .

Abstract

The laser-assisted melt electrospinning (LES) method was utilized for the preparation of poly(L-lactide-co-ε-caprolactone) (PLCL) fibers. During the process, a carbon dioxide laser was irradiated, and voltage was applied to the raw fiber of PLCL. In situ observation of fiber formation behavior revealed that only a single jet was formed from the swelling region under the conditions of low laser power and applied voltage and feeding rate, whereas multiple jets and shots were produced with increases in these parameters. The formation of multiple jets resulted in the preparation of thinner fibers, and under the optimum condition, an average fiber diameter of 0.77 μm and its coefficient of variation of 17% was achieved without the formation of shots. The estimation of tension and stress profiles in the spin-line was also carried out based on the result of in situ observation and the consideration that the forces originated from surface tension, electricity, air friction, and inertia. The higher peak values of tension and stress appearing near the apex of the swelling region corresponded to the formation of thinner fibers for the condition of single-jet ejection. Analyses of the molecular orientation and crystallization of as-spun fibers revealed the formation of a wide variation of higher order structure depending on the spinning conditions.

Keywords: birefringence; crystalline structure; crystallinity; electrical force; melt electrospinning; molecular orientation; nanofibers; poly(L-lactide-co-ε-caprolactone); thermal properties.


Conflict of interest statement

The authors declare no conflict of interest.

Figures

Figure 1
Figure 1
(a) Schematic diagram of laser-heated melt electrospinning (LES) process and (b) nozzle region of LES apparatus with enlarged photograph showing fiber thinning behavior.
Figure 2
Figure 2
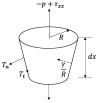
Momentum balance on a short section of a jet.
Figure 3
Figure 3
Photographs of fiber thinning behaviors near the nozzle: (a) effect of feeding rate at the applied voltage of 20 kV and laser power of 8 and 20 W, (b) enlarged photographs for conditions with the feeding rate of 17.0, 28.8, and 58.2 mm/min, applied voltage of 20 kV and laser power of 20 W, (c) effect of applied voltage at the feeding rate of 28.8 mm/min and laser power of 8 and 20 W, (d) enlarged photographs for conditions with applied voltages of 10, 20, and 23 kV, feeding rate of 28.8 mm/min, and laser power of 20 W.
Figure 4
Figure 4
Categorization of fiber formation behaviors near nozzle varying with laser power, voltage and feeding rate.
Figure 5
Figure 5
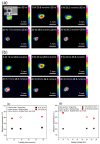
Thermography images of swelling region with laser power of 8 and 20 W; effects of (a) feeding rate and (b) applied voltage. Variations of maximum temperature with changes in (c) feeding rate, and (d) applied voltage at laser power of 8 and 20 W.
Figure 6
Figure 6
Effect of feeding rate on fiber diameter profiles for the applied voltage of 20 kV and laser power of (a) 8 W and (b) 20 W, and effect of applied voltage on fiber diameter profiles for the feeding rate of 28.8 mm/min and laser power of (c) 8 W and (d) 20 W. Data plotted at 60 mm are diameters analysed from the SEM images of the prepared web samples, which will be presented in Figure 7 and Figure 8.
Figure 7
Figure 7
(a) Effect of feeding rate on fiber diameter distribution for the applied voltage of 20 kV and laser power of 8 and 20 W, and (b) effect of applied voltage on fiber diameter distribution for the feeding rate of 28.8 mm/min and laser power of 8 and 20 W. SEM images of corresponding fiber web are also shown.
Figure 7
Figure 7
(a) Effect of feeding rate on fiber diameter distribution for the applied voltage of 20 kV and laser power of 8 and 20 W, and (b) effect of applied voltage on fiber diameter distribution for the feeding rate of 28.8 mm/min and laser power of 8 and 20 W. SEM images of corresponding fiber web are also shown.
Figure 8
Figure 8
Variations of (a) average fiber diameter and (b) its coefficient of variation (CV) with change in feeding rate for the applied voltage of 20 kV and laser power of 8 and 20 W, and variations of (c) average fiber diameter and (d) its CV with change in the applied voltage for the feeding rate of 28.8 mm/min and laser power of (a) 8 W and (b) 20 W.
Figure 9
Figure 9
Effect of feeding rate on fiber running speed profiles for the applied voltage of 20 kV and laser power of (a) 8 W and (b) 20 W, and effect of applied voltage on fiber running speed profiles for the feeding rate of 28.8 mm/min and laser power of (c) 8 W and (d) 20 W.
Figure 10
Figure 10
Variations of total residence time with changes in (a) feeding rate and (b) applied voltage at laser power of 8 and 20 W.
Figure 11
Figure 11
Effect of feeding rate on (a) charge density profiles, (b) electric field profiles, (c) normal stress profiles, (d) tangential stress profiles, and (e) cohesive force profiles for the applied voltage of 20 kV and laser power of 8 W.
Figure 11
Figure 11
Effect of feeding rate on (a) charge density profiles, (b) electric field profiles, (c) normal stress profiles, (d) tangential stress profiles, and (e) cohesive force profiles for the applied voltage of 20 kV and laser power of 8 W.
Figure 12
Figure 12
Magnified views of tension profiles for conditions with the feeding rate of (a) 17.0, (b) 28.8, and (c) 58.2 mm/min, applied voltage of 20 kV, and laser power of 8 W.
Figure 13
Figure 13
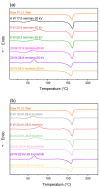
DSC thermograms of electrospun fibers obtained for conditions with various (a) feeding rate and (b) applied voltage at laser power of 8 and 20 W. Data of the raw PLCL fiber is also included.
Figure 14
Figure 14
Micrographs of the fibers observed under a polarizing microscope: (a) raw fiber for LES and (b) electrospun fibers obtained for conditions with various feeding rate at laser power of 8 W. Cross Nicol, Cross Nicol + Bereck, and Cross Nicol + Bereck + additional retardation correspond to under cross-polarization condition, cross-polarization condition using the Bereck compensator without optical retardation, and using the Bereck compensator with optical retardation, respectively.
Figure 14
Figure 14
Micrographs of the fibers observed under a polarizing microscope: (a) raw fiber for LES and (b) electrospun fibers obtained for conditions with various feeding rate at laser power of 8 W. Cross Nicol, Cross Nicol + Bereck, and Cross Nicol + Bereck + additional retardation correspond to under cross-polarization condition, cross-polarization condition using the Bereck compensator without optical retardation, and using the Bereck compensator with optical retardation, respectively.
Figure 15
Figure 15
Correlation between fiber diameter and birefringence of electrospun fibers obtained for conditions with various (a) feeding rate and (b) applied voltage at laser power of 8 and 20 W. Data of the raw PLCL fiber is also included. Variations of averaged birefringence and its distribution with changes in (c) feeding rate and (d) applied voltage at laser power of 8 and 20 W.
Figure 16
Figure 16
Wide-angle X-ray diffraction (WAXD) profiles and two-dimensional (2D) patterns at azimuthal angles of 0 and 90° for a bundle of the raw fiber.
Figure 17
Figure 17
WAXD 2D patterns of (a) powder-like raw fiber and electrospun fiber webs obtained for conditions with various (b) feeding rate and (c) applied voltage at laser power of 8 and 20 W.
Figure 18
Figure 18
WAXD profiles of electrospun fiber webs obtained for conditions with various (a) feeding rate and (b) applied voltage at laser power of 8 and 20 W. Data of the raw PLCL fiber is also included.
Figure 19
Figure 19
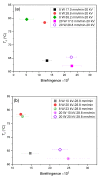
Correlation between Tc and birefringence for conditions with various (a) feeding rate and (b) applied voltage at laser power of 8 and 20 W.

Similar articles

Cited by

References

    1. Zhmayev E., Zhou H., Joo Y.L. Modeling of non-isothermal polymer jets in melt electrospinning. J. Non Newton Fluid. Mech. 2008;153:95–108. doi: 10.1016/j.jnnfm.2007.11.011. - DOI
    1. Xue J., Wu T., Dai Y. Electrospinning and electrospun nanofibers: Methods, materials, and applications. Chem. Rev. 2019;119:5298–5415. doi: 10.1021/acs.chemrev.8b00593. - DOI - PMC - PubMed
    1. Balakrishnan N.K., Koenig K., Seide G. The effect of dye and pigment concentrations on the diameter of melt-electrospun polylactic acid fibers. Polymers. 2020;12:2321. doi: 10.3390/polym12102321. - DOI - PMC - PubMed
    1. Li B.D., Xia Y. Electrospinning of nanofibers: Reinventing the wheel? Adv. Mater. 2004;16:1151–1170. doi: 10.1002/adma.200400719. - DOI
    1. Dzenis Y. Spinning continuous fibers for nanotechnology. Science. 2004;304:1917–1919. doi: 10.1126/science.1099074. - DOI - PubMed

Grants and funding

LinkOut - more resources