. 2022 Jun 7;22(12):4324.
doi: 10.3390/s22124324.

Recent Advances in Video Analytics for Rail Network Surveillance for Security, Trespass and Suicide Prevention-A Survey

Affiliations

Recent Advances in Video Analytics for Rail Network Surveillance for Security, Trespass and Suicide Prevention-A Survey

Tianhao Zhang et al. Sensors (Basel). .

Abstract

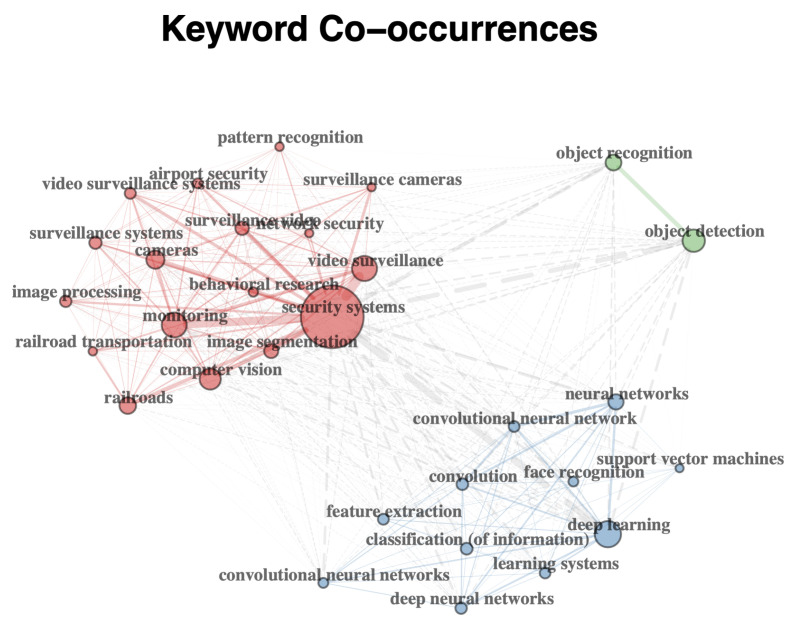
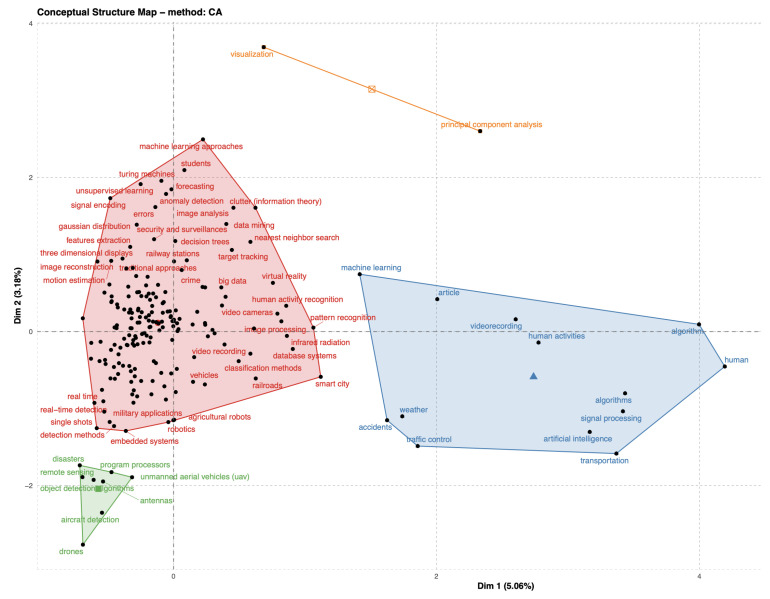
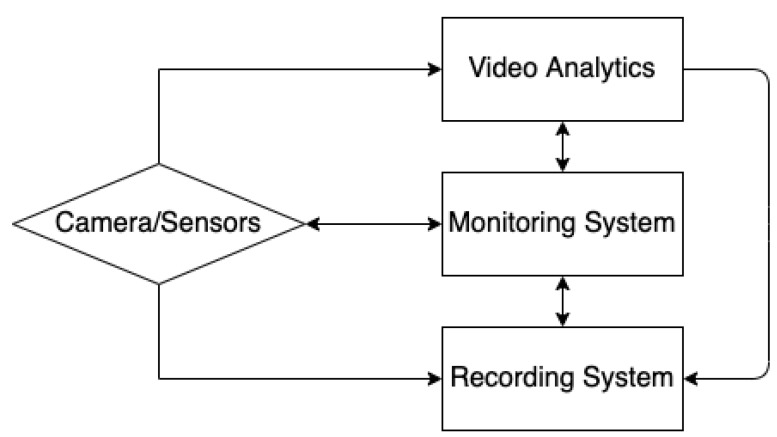
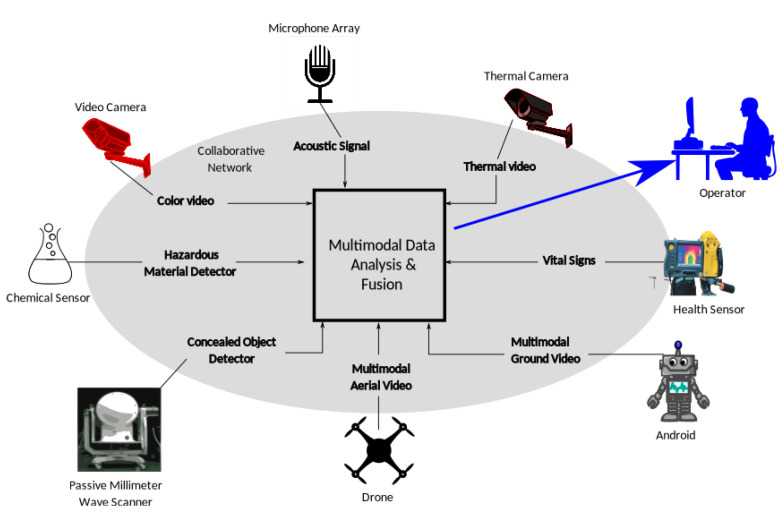
Railway networks systems are by design open and accessible to people, but this presents challenges in the prevention of events such as terrorism, trespass, and suicide fatalities. With the rapid advancement of machine learning, numerous computer vision methods have been developed in closed-circuit television (CCTV) surveillance systems for the purposes of managing public spaces. These methods are built based on multiple types of sensors and are designed to automatically detect static objects and unexpected events, monitor people, and prevent potential dangers. This survey focuses on recently developed CCTV surveillance methods for rail networks, discusses the challenges they face, their advantages and disadvantages and a vision for future railway surveillance systems. State-of-the-art methods for object detection and behaviour recognition applied to rail network surveillance systems are introduced, and the ethics of handling personal data and the use of automated systems are also considered.

Keywords: computer vision; image and video analytics; machine learning; rail network systems; sensors; surveillance; video anomaly detection.


Conflict of interest statement

The authors declare no conflict of interest.

Figures

Figure 1
Figure 1
Keyword co-occurrence network of the published papers under the topic of video surveillance analytics published since 2010.
Figure 2
Figure 2
Conceptual structure map using the Correspondence Analysis (CA) method. The clusters represent how ideas are connected; the closer they are, the stronger the association.
Figure 3
Figure 3
CCTV modules. In railway surveillance, cameras are the main sensors, which are responsible for collecting video data. Different types of sensors (introduced in Section 2.3), communication systems and other computing facilities (introduced in Section 2.4) make up the monitoring and recording systems. The video analytics module receives the data passed from monitoring and recording systems and then makes decisions using computer vision technologies.
Figure 4
Figure 4
An example of a sensor system composed of conventional sensors, such as electro-optical and thermal imaging sensors, and non-conventional sensors, which enhance the capability in other frequency domains. Acoustic sensors provide omnidirectional detection and tracking based upon trilateration from temporal differences in the sound waves. The health sensor provides vital signs of the individuals for detecting sick people passing through a station for further screening. A chemical sensor detects specific chemicals for the identification of possible explosive devices. The wave scanner detects concealed objects, including weapons.
Figure 5
Figure 5
Using radio waves in the millimeter spectrum to safely penetrate clothing and reflect off body-worn concealed threats. Images were taken from the “L-3 Airport Scanner” by the Pacific Northwest National Laboratory [37].
Figure 6
Figure 6
Infrared thermography used in a train station. Images taken from “Waterloo station” by branestawm2002 [39].
Figure 7
Figure 7
Computing architectures.
Figure 8
Figure 8
Block diagram of sensor-based computer vision methods for object detection and behaviour analysis tasks. The data collected by sensors will be transformed as input data to the train models. Models built based on various structures and methods will handle the process of extracting the features from the training data set. Then, well-trained models can be used as a detector or classifier to recognise the activities of the detected objects in surveillance systems.
Figure 9
Figure 9
A basic CNN structure used for classification tasks. Generally, there are three types of layers used to form a full CNNs architecture: Convolutional layer, Pooling layer and Fully-connected (FC) layer. A convolution layer is a linear transformation that preserves spatial information in the input image. It will compute the output of neurons that are connected to local regions in the input, each computing a dot product between their weights and a small region they are connected to in the input volume. Pooling layers take the output of a convolution layer and reduce its dimensionality under certain rules. FC layers are used to connect the neurons between two different layers. It consists of the weights and biases along with the neurons. The FC layers are usually deployed before the output layer to work on the last few layers of a CNN architecture.
Figure 10
Figure 10
A diagram for a one-unit RNN. From bottom to top: input state, hidden state, output state. U,V,W are the weights of the networks. The compressed diagram is on the left, and the unfolded version is on the right.
Figure 11
Figure 11
Pipeline of a Transformer [64]. A transformer is made up of an encoder module and a decoder module with multiple identical encoders and decoders. Each encoder and decoder contains a self-attention layer and a feedforward neural network. Each decoder has extra an encoder–decoder attention layer.
Figure 12
Figure 12
A two-step SOD pipeline using Background Subtraction. The images are from the CAVIAR dataset [78]. By comparing two different frames in the video data provided by the same camera sensor, the input image is divided into multiple region proposals based on the objects of interest. Each region is processed separately, and the object features in each region are extracted. The background subtraction detects all moving objects from the background. Then, by continuing to compare other frames in the video, the static object in the frame apart from the moving objects, such as people and trains, will be separated from other objects. Therefore, the static objective—in this case, the luggage—will be successfully detected.
Figure 13
Figure 13
Multiple object detection examples [81]. The targets are detected and marked in red boxes.
Figure 14
Figure 14
Multiple Object Detection with Topic Modelling [81]. The movement of the Fire engine, which is considered an abnormal event, in this case, is detected and marked with red boxes.
Figure 15
Figure 15
Block diagram of VFR. Images come from a public dataset Face Mask Detection [89].
Figure 16
Figure 16
Person Re-Identification in video surveillance systems. This figure shows a top view of the region of interest comprising an entrance hall, a waiting area and a shop, monitored by three cameras (red is optical and black is thermal) with non-overlapping coverages (orange triangles). The locations of three individuals (blue, cyan and green dots) are shown at different timestamps in the region of interest. The person Re-ID aims to associate paths of the individuals denoted by blue and green dots detected by different modalities (optical and thermal) cameras.
Figure 17
Figure 17
Block diagram of Person Re-ID. The images are from the CAVIAR dataset [78]. Five main steps for designing a Person Re-ID system: (1) raw data collection, (2) training data annotation, (3) model training, (4) bounding box generation and (5) pedestrian retrieval.
Figure 18
Figure 18
A block diagram of an HAR algorithm using an example of detecting an abandoned object. The images come from the i-LIDS bag and vehicle detection challenge of AVSS 2007 conference [97]. Four video frames with labelled objects are input to the HAR algorithm. The first step is feature extraction. The spatial and temporal information contained in the video helps in the recognition. Hence, both spatial (green) and temporal (blue) features are extracted. The video classifier classifies the extracted features. The surveillance operator is alerted if the video is classified as belonging to any of the pre-defined classes.
Figure 19
Figure 19
Block diagram of IUAD. The images come from the CAVIAR dataset [78]. Four labelled video frames are input to the algorithm. The spatial and temporal features are extracted first, followed by the anomaly detector. The anomaly detector uses parameters from a model trained on historical video data, which are all classified as normal. The output of anomaly detectors is either score or binary, where a binary output is used in this case.
Figure 20
Figure 20
Block diagram of Crowd Count. The input frames are processed by two streams, spatial and a temporal, to extract features. The spatial features are represented by a yellow colour, and the temporal using a red colour indicates the direction of motion. The extracted features are processed to generate an estimated density map using different colours. The blue colour represents minimum or zero capacity, where yellow and red represent the bigger and maximum density. Finally, a well-trained density model is able to provide a prediction of the crowd number, which is 888 in this case.
Figure 21
Figure 21
Adversarial attack examples. Image was taken from the Google AI Blog [127].
Figure 22
Figure 22
Facial recognition with masks. Images are from a public dataset Face Mask Detection [89].
Figure 23
Figure 23
Data processing in the next generation of CCTV surveillance systems.
Figure 24
Figure 24
Intelligence levels of data analytics for CCTV.
Figure 25
Figure 25
Event prediction in a blind zone [180]. This figure shows an example of two persons leaving the coverage of two different cameras (orange and green) and entering a blind zone. The video analytics system would predict and display the most probable trajectory of these individuals. The same concept could be used for the prediction of complex events such as criminal activity, possibly giving an operator extra time to respond.
Figure 26
Figure 26
Six basic principles of GDPR.

References

    1. Coaffee J., Moore C., Fletcher D., Bosher L. Resilient design for community safety and terror-resistant cities; Proceedings of the Institution of Civil Engineers-Municipal Engineer; London, UK. 1 June 2008; London, UK: Thomas Telford Ltd.; 2015. pp. 103–110.
    1. Media Guidelines for Reporting Suicide. 2019. [(accessed on 7 April 2022)]. Available online: https://media.samaritans.org/documents/Media_guidelines_-_Rail_suicides_....
    1. Suicide Prevention on the Railway—Network Rail. 2021. [(accessed on 7 April 2022)]. Available online: https://www.networkrail.co.uk/communities/safety-in-the-community/suicid...
    1. Kawamura A., Yoshimitsu Y., Kajitani K., Naito T., Fujimura K., Kamijo S. Smart camera network system for use in railway stations; Proceedings of the IEEE International Conference on Systems, Man, and Cybernetics; Anchorage, AL, USA. 9–12 October 2011; pp. 85–90.
    1. Li Y., Qin Y., Xie Z., Cao Z., Jia L., Yu Z., Zheng J., Zhang E. Efficient SSD: A Real-Time Intrusion Object Detection Algorithm for Railway Surveillance; Proceedings of the 2020 International Conference on Sensing, Diagnostics, Prognostics, and Control (SDPC); Beijing, China. 5–7 August 2020; pp. 391–395.

Grants and funding

LinkOut - more resources