Review
. 2022 Jun 14;22(12):4497.
doi: 10.3390/s22124497.

Recent Advances in Rapid and Highly Sensitive Detection of Proteins and Specific DNA Sequences Using a Magnetic Modulation Biosensing System

Affiliations
Review

Recent Advances in Rapid and Highly Sensitive Detection of Proteins and Specific DNA Sequences Using a Magnetic Modulation Biosensing System

Shira Roth et al. Sensors (Basel). .

Abstract

In early disease stages, biomolecules of interest exist in very low concentrations, presenting a significant challenge for analytical devices and methods. Here, we provide a comprehensive overview of an innovative optical biosensing technology, termed magnetic modulation biosensing (MMB), its biomedical applications, and its ongoing development. In MMB, magnetic beads are attached to fluorescently labeled target molecules. A controlled magnetic force aggregates the magnetic beads and transports them in and out of an excitation laser beam, generating a periodic fluorescent signal that is detected and demodulated. MMB applications include rapid and highly sensitive detection of specific nucleic acid sequences, antibodies, proteins, and protein interactions. Compared with other established analytical methodologies, MMB provides improved sensitivity, shorter processing time, and simpler protocols.

Keywords: biosensing; magnetic beads; magnetic modulation biosensing; nucleic acids; protein-protein interactions; serology.


Conflict of interest statement

Amos Danielli has a financial interest in MagBiosense, Inc., which, however, did not financially support this work.

Figures

Figure 1
Figure 1
Schematic of a typical sandwich immunoassay. A typical fluorescence-based “sandwich” assay, showing a magnetic bead coated with a capture antibody, a target molecule (e.g., human interleukin 8), and a detection antibody conjugated to a fluorescent molecule (e.g., phycoerythrin). Reprinted from [15], with the permission of AIP Publishing 2019.
Figure 2
Figure 2
Schematic of a magnetic modulation biosensing (MMB) system.
Figure 3
Figure 3
Dose response comparison between the 45-min MMB-based assay and the 110- and 245-min ELISA tests. The calculated LoD of the MMB test is 129 ng/L. The calculated LoDs of the ELISA tests are 6267 and 817 ng/L, respectively. Reprinted from [25] with the permission of MDPI 2022.
Figure 4
Figure 4
Sensitivity, specificity, and cross-reactivity of the MMB Zika IgM and IgG serological assays. (a) Zika IgM and (b) Zika IgG assay results. The Controls (blue) were taken from healthy patients. The DENV (red) and WNV (black) are Dengue virus (DENV)- and West Nile virus (WNV)-positive samples were taken from enzyme-linked immunosorbent assay-positive patients. All samples were obtained from the National Center for Zoonotic Viruses at the Central Virology Laboratory of the Ministry of Health at Sheba Medical Center, Israel. The ZIKV (green) are Zika Virus positive samples taken from quantitative reverse-transcription polymerase chain reaction/neutralization-positive patients. The IgM and IgG samples were obtained on days 1–60 and 7–180 post-symptom onset, respectively. The Zika-positive samples were collected from Israeli travelers presenting at the Institute of Tropical Medicine at Sheba Medical Center after returning from Zika-endemic areas. The MMB IgM assay detected 23 of 26 Zika-positive samples (88% sensitivity), and the MMB IgG assay detected 33 of 34 Zika-positive samples (97% sensitivity) The specificity of the MMB assay for both IgM and IgG was 100%. The cross-reactivity to WNV was 0% for both IgM and IgG. The cross-reactivity to DENV was 0% for IgM and 4% for IgG. Reprinted from [20] by permission of Oxford University Press 2018.
Figure 5
Figure 5
IL-8 dose response. Comparison of IL-8 dose response in 25% plasma with MMB and a standard ELISA kit. Reprinted from [11], Copyright (2017), with permission from Elsevier.
Figure 6
Figure 6
Simple representation of an MMB-based protein interaction detection assay.
Figure 7
Figure 7
Dose response behavior of recombinant human Sp1 interaction with DNA. (a) A representative EMSA blot. The graph below the blot is the fraction of DNA bound with increasing concentrations of Sp1, calculated as (bound)/(bound+unbound). The band designated with an asterisk (“*”) represents the population of dsDNA that the protein is unable to bind. (b) Dose response at different incubation times (t) using the MMB system (n=2). Reprinted (adapted) with permission from [38] Copyright (2022) by American Chemical Society.
Figure 8
Figure 8
Identification of a novel toxin antitoxin pair, HicA and HicB, in Pseudomonas aeruginosa. Abbreviations: “Exp”, the experiment with cell lysate of Pseudomonas aeruginosa (P. aeruginosa) overexpressing HicA and HicB. “No cell lysate”, the same experiment without cell lysate. “No HicB”, the same experiment with cell lysate of P. aeruginosa overexpressing HicA solely. “No HicA”, the same experiment with cell lysate of P. aeruginosa overexpressing HicB solely. “Neg proteins”, the same experiment with cell lysate of P. aeruginosa overexpressing two proteins that are not known to interact with one another (SadB and ParD). Three asterisks (***) indicate a statistical significance of p < 0.001. Reprinted from [16], Copyright (2020), with permission from Elsevier.
Figure 9
Figure 9
Schematic of using the MMB system for screening inhibitors of the S1-ACE2 interaction in SARS-CoV-2. From [41] with permission of MDPI 2021.
Figure 10
Figure 10
(a) Schematic of the sandwich hybridization assay (SHA). Capture and detection probes are hybridized to the target oligonucleotide and captured by streptavidin-coated magnetic beads. (b) Results of an SHA dose-response experiment performed with the MMB device (solid red line) and with a conventional fluorescence plate reader (solid black line). MMB achieves 150 times higher sensitivity than the plate reader. Reprinted from [18], Copyright © 2019 John Wiley & Sons—Books.
Figure 11
Figure 11
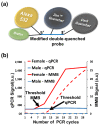
(a) Schematic of a modified double-quenched probe. (b) Comparative signal strengths in chick sexing experiments fusing the MMB system and qPCR. Using MMB, the sex of the hatchling could be determined after ~13 min, compared to 1–2 h using qPCR. Reprinted from [59], Copyright © 2019 American Chemical Society. Further permissions related to the material excerpted should be directed to ACS.
Figure 12
Figure 12
Workflow of the MMB-based SARS-CoV-2 detection assay. The turnover time from sample to result is approximately 30 min. Reprinted from [60], Copyright (2021) with permission from Elsevier.
Figure 13
Figure 13
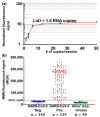
(a) Analytical performance of the MMB-based SARS-CoV-2 molecular assay. (b) Clinical performance of the MMB-based SARS-CoV-2 molecular assay. Reprinted (modified) from [60], Copyright (2021) with permission from Elsevier.
Figure 14
Figure 14
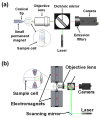
Schematic representations of (a) a magnetically aggregated biosensors (MAB) system. Reprinted from [15], with the permission of AIP Publishing 2019. (b) an optical modulation biosensing (OMB) system. Reprinted with permission from [61] © 2021 The Optical Society.
Figure 15
Figure 15
Dose-response experiments with the MAB system. (a) R-PE and ATTO 532 dose-response with M280SA magnetic beads. The calculated limit of detection (LoD) is 45 fM for R-PE and 60 fM for ATTO 532. (b) Recombinant human interleukin 8 (IL-8) dose-response (BioRad assay kit) in buffer. The calculated LoD is 0.1 ng/L. Reprinted from [15], with the permission of AIP Publishing 2019.
Figure 16
Figure 16
Dose-response experiments with the OMB system. (a) ATTO 532 dose-response with streptavidin-coupled M280 magnetic beads. The calculated limit of detection (LoD) is 95 fM, and the coefficient of variation (CV) is less than 16%. (b) Recombinant human interleukin 8 (IL-8) dose-response in buffer. The calculated LoD is 0.02 ng/L. Reprinted with permission from [61] © 2021 The Optical Society.

References

    1. Todd J., Freese B., Lu A., Held D., Morey J., Livingston R., Goix P. Ultrasensitive flow-based immunoassays using single-molecule counting. Clin. Chem. 2007;53:1990–1995. doi: 10.1373/clinchem.2007.091181. - DOI - PubMed
    1. Wu A.H.B., Fukushima N., Puskas R., Todd J., Goix P. Development and preliminary clinical validation of a high sensitivity assay for cardiac troponin using a capillary flow (Single molecule) fluorescence detector. Clin. Chem. 2006;52:2157–2159. doi: 10.1373/clinchem.2006.073163. - DOI - PubMed
    1. Rissin D.M., Kan C.W., Campbell T.G., Howes S.C., Fournier D.R., Song L., Piech T., Patel P.P., Chang L., Rivnak A.J., et al. Single-molecule enzyme-linked immunosorbent assay detects serum proteins at subfemtomolar concentrations. Nat. Biotech. 2010;28:595–599. doi: 10.1038/nbt.1641. - DOI - PMC - PubMed
    1. Dunbar S.A. Applications of Luminex® xMAP™ technology for rapid, high-throughput multiplexed nucleic acid detection. Clin. Chim. Acta. 2006;363:71–82. doi: 10.1016/j.cccn.2005.06.023. - DOI - PMC - PubMed
    1. Wu C., Dougan T.J., Walt D.R. High-Throughput, High-Multiplex Digital Protein Detection with Attomolar Sensitivity. ACS Nano. 2022;16:1025–1035. doi: 10.1021/acsnano.1c08675. - DOI - PMC - PubMed

LinkOut - more resources