. 2022 Jun 16;10(6):963.
doi: 10.3390/vaccines10060963.

Natural History of Sudan ebolavirus to Support Medical Countermeasure Development

Affiliations

Natural History of Sudan ebolavirus to Support Medical Countermeasure Development

Caroline Carbonnelle et al. Vaccines (Basel). .

Abstract

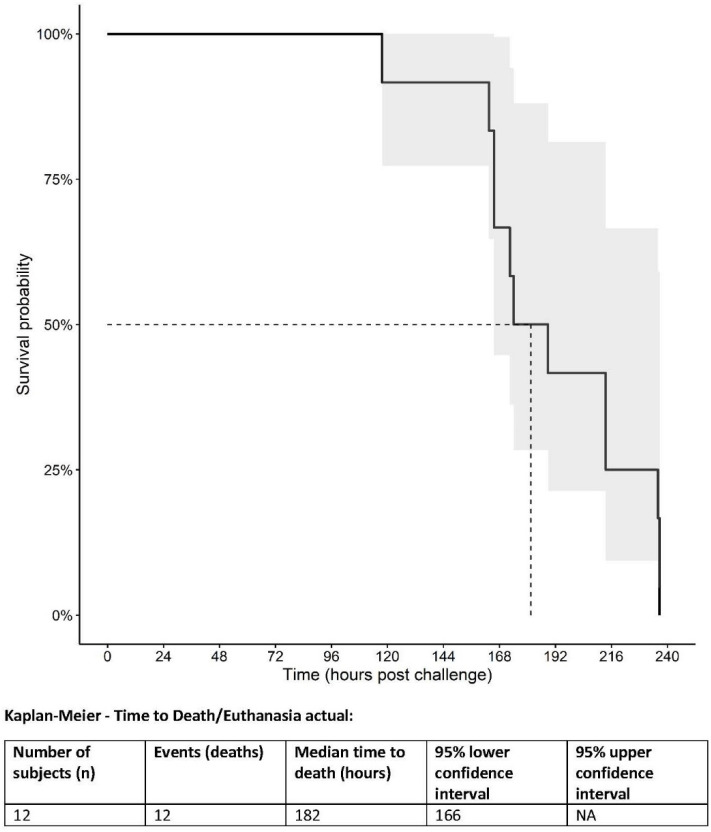
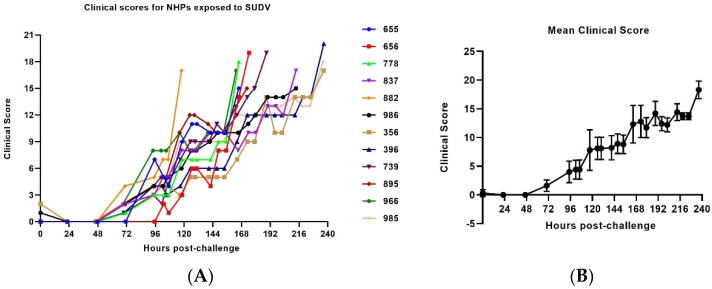
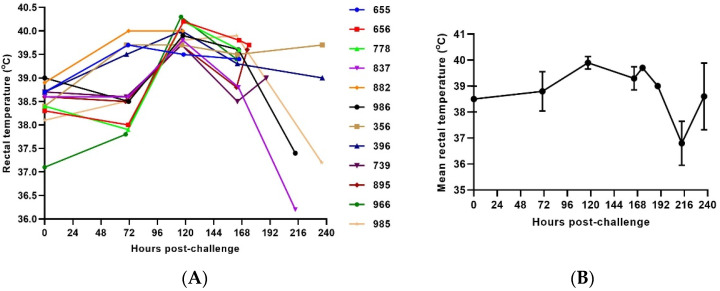
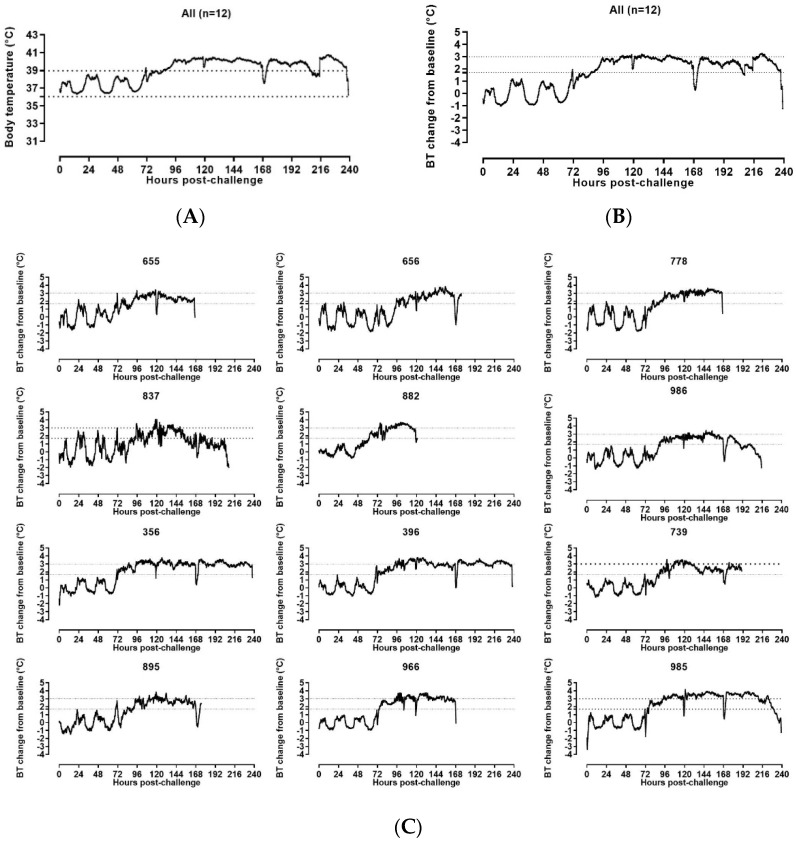
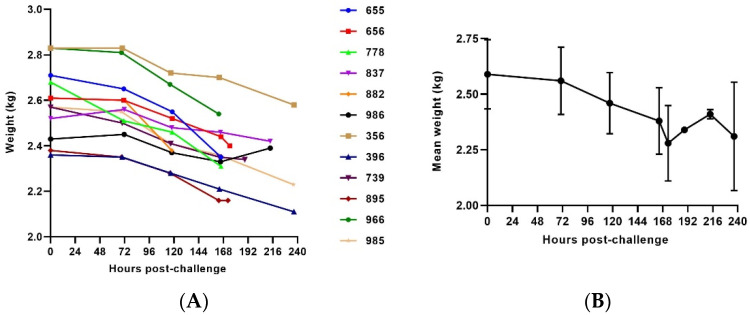
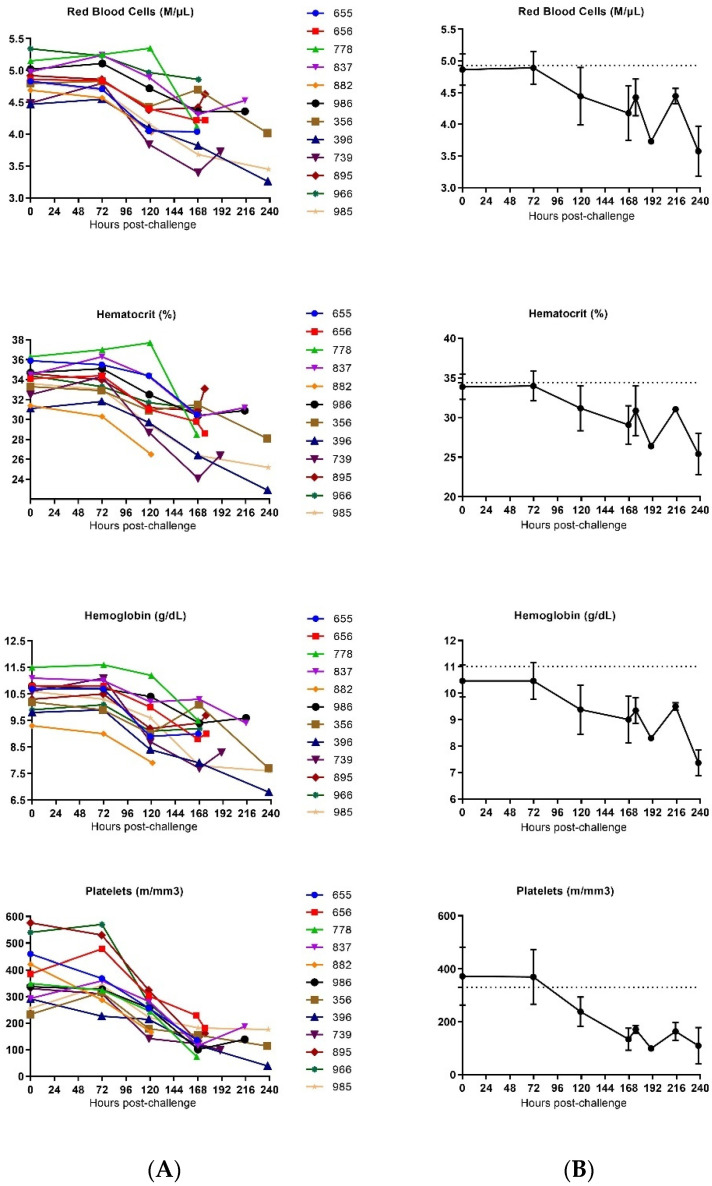
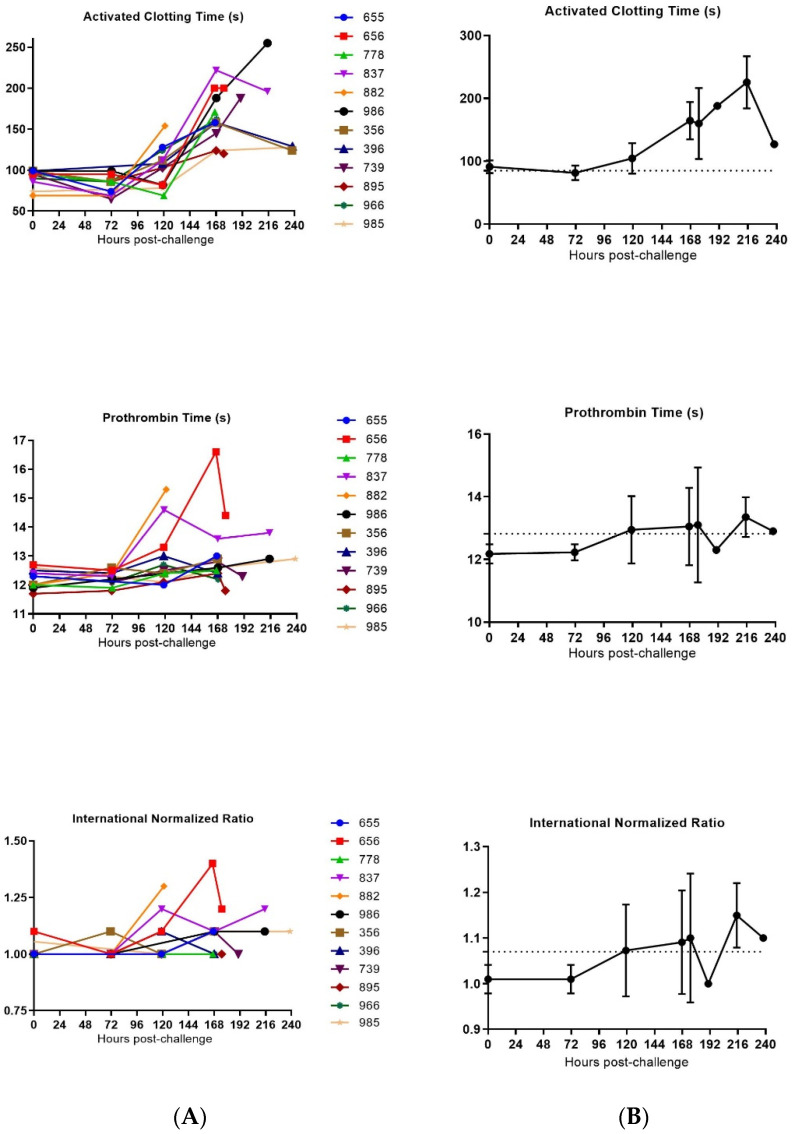
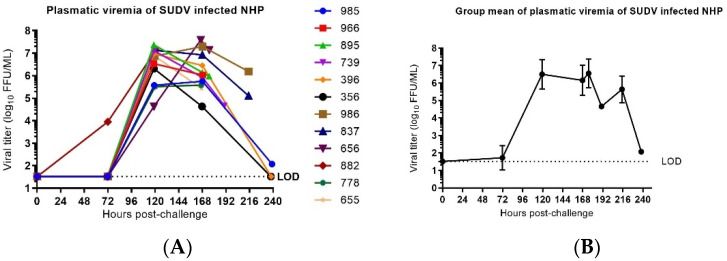
Sudan ebolavirus (SUDV) is one of four members of the Ebolavirus genus known to cause Ebola Virus Disease (EVD) in humans, which is characterized by hemorrhagic fever and a high case fatality rate. While licensed therapeutics and vaccines are available in limited number to treat infections of Zaire ebolavirus, there are currently no effective licensed vaccines or therapeutics for SUDV. A well-characterized animal model of this disease is needed for the further development and testing of vaccines and therapeutics. In this study, twelve cynomolgus macaques (Macaca fascicularis) were challenged intramuscularly with 1000 PFUs of SUDV and were followed under continuous telemetric surveillance. Clinical observations, body weights, temperature, viremia, hematology, clinical chemistry, and coagulation were analyzed at timepoints throughout the study. Death from SUDV disease occurred between five and ten days after challenge at the point that each animal met the criteria for euthanasia. All animals were observed to exhibit clinical signs and lesions similar to those observed in human cases which included: viremia, fever, dehydration, reduced physical activity, macular skin rash, systemic inflammation, coagulopathy, lymphoid depletion, renal tubular necrosis, hepatocellular degeneration and necrosis. The results from this study will facilitate the future preclinical development and evaluation of vaccines and therapeutics for SUDV.

Keywords: Ebola; SUDV; Sudan ebolavirus; filovirus; macaques; natural history study; telemetry; virus.


Conflict of interest statement

The authors declare no conflict of interest.

Figures

Figure 1
Figure 1
Kaplan–Meier plot of survival of SUDV-challenged cynomolgus macaques. Quantile estimate: Median time (IQR): 188.83 h (165.67 to 236.00).
Figure 2
Figure 2
Clinical disease scores in SUDV-challenged NHPs. (A) Clinical disease score evolution of individual SUDV challenged animals throughout the infection. (B) Average clinical score evolution throughout the infection. (Day 0–Day 5 a.m.: n = 12 animals, Day 5 p.m.–Day 7 a.m.: n = 11 animals, Day 7 p.m.: n = 8 animals, Day 7 night–Day 8 a.m.: n = 6 animals, Day 8 a.m.–Day 9 a.m.: n = 5 animals, Day 9 p.m.–Day 10: n = 3 animals). The error bars represent the standard deviation (SD).
Figure 3
Figure 3
Rectal Temperature in SUDV challenged NHPs. (A) Rectal temperature in individual SUDV challenged animals versus time. (B) Group mean rectal temperature. The error bars represent the standard deviation (SD).
Figure 4
Figure 4
DSI telemetry body temperature changes in SUDV-challenged NHPs. (A) Group means DSI telemetry-based Body Temperature (BT) versus time. The dashed lines indicate the baseline minimum and maximum BT values. (B) Group mean DSI telemetry-based BT change from baseline versus time. The dashed lines indicate the BT change from baseline corresponding to fever (≥1.7 °C) and hyperpyrexia (≥3 °C). (C) DSI telemetry-based body temperature (BT) change from baseline in individual SUDV-challenged animals versus time. The straight dashed lines indicate the BT change from baseline corresponding to fever (≥1.7 °C) and hyperpyrexia (≥3 °C).
Figure 5
Figure 5
Star Oddi-based body temperature changes in SUDV-challenged animals. (A) Group mean StarOddi telemetry-based Body Temperature (BT) versus time. The straight dashed lines indicate the baseline minimum and maximum BT values. (B) Group mean StarOddi telemetry-based BT change from baseline versus time. (C) Star Oddi telemetry-based BT change from baseline in individual SUDV challenged animals versus time. (B,C): The straight dashed lines indicate the BT change from baseline corresponding to fever (≥1.7 °C) and hyperpyrexia (≥3 °C)).
Figure 6
Figure 6
Body weight in SUDV-challenged NHPs. (A) Body weight evolution post-challenge. (B) Average weight. The error bars represent the standard deviation (SD).
Figure 7
Figure 7
Biochemical analysis in SUDV-challenged animals. (A) Individual biochemical parameter evolution versus time. (B) Group mean biochemical parameter evolution versus time. Average measurements taken before exposure serve as baseline (represented by horizontal straight dashes lines). Error bars represent the standard deviation (SD) of the mean.
Figure 7
Figure 7
Biochemical analysis in SUDV-challenged animals. (A) Individual biochemical parameter evolution versus time. (B) Group mean biochemical parameter evolution versus time. Average measurements taken before exposure serve as baseline (represented by horizontal straight dashes lines). Error bars represent the standard deviation (SD) of the mean.
Figure 8
Figure 8
Hematological analysis in SUDV-challenged animals. (A) Individual hematological parameter evolution versus time. (B) Group mean hematological parameter evolution versus time. Average measurements taken before exposure serve as baseline (represented by horizontal straight dashes lines). Error bars represent the standard error of the mean.
Figure 8
Figure 8
Hematological analysis in SUDV-challenged animals. (A) Individual hematological parameter evolution versus time. (B) Group mean hematological parameter evolution versus time. Average measurements taken before exposure serve as baseline (represented by horizontal straight dashes lines). Error bars represent the standard error of the mean.
Figure 9
Figure 9
Coagulation parameters in SUDV-challenged animals. (A) Individual coagulation parameters evolution versus time. (B) Group means coagulation parameters versus time. Average measurements taken before exposure serve as baseline (represented by horizontal straight dashes lines). Error bars represent the standard error of the mean.
Figure 10
Figure 10
Plasmatic infectious virus in SUDV-challenged NHP. (A) Plasmatic viral infectious load in individual SUDV-challenged animals versus time. Viral load represents the mean of two titration assay replicates and are expressed in logarithm decimal FFU/mL. Time course is expressed in hour(s) post-challenge (pc). LOD is the limit of detection of the immunological detection plaque titration assay (=1, 52 log10 FFU/mL). (B) Group mean ± SD of SUDV infectious viral load versus time. Time course is expressed in days post-challenge (pc).
Figure 11
Figure 11
Plasmatic genomic viremia in SUDV-challenged NHPs. (A) Plasmatic viral RNA concentration in individual SUDV-challenged animals versus time. vRNA load represents the mean to two titration assay replicates and are expressed in logarithm decimal copies/mL. Time course is expressed in hours post-challenge (pc). LOD is the limit of detection of the PCR assay (=3.78 log10 copies/mL). (B) Group mean ± SD of plasmatic viral RNA versus time. Time course is expressed in days post-challenge (pc).

Similar articles

Cited by

References

    1. Forbes K.M., Webala P.W., Jääskeläinen A.J., Abdurahman S., Ogola J., Masika M.M., Kivistö I., Alburkat H., Plyusnin I., Levanov L., et al. Bombali Virus in Mops condylurus Bat, Kenya. Emerg. Infect. Dis. 2019;25:955–957. doi: 10.3201/eid2505.181666. - DOI - PMC - PubMed
    1. Goldstein T., Anthony S.J., Gbakima A., Bird B.H., Bangura J., Tremeau-Bravard A., Belaganahalli M.N., Wells H.L., Dhanota J.K., Liang E., et al. The discovery of Bombali virus adds further support for bats as hosts of ebolaviruses. Nat. Microbiol. 2018;3:1084–1089. doi: 10.1038/s41564-018-0227-2. - DOI - PMC - PubMed
    1. Patel P.R., Shah S. StatPearls. StatPearls Publishing; Treasure Island, FL, USA: 2022. [(accessed on 2 May 2022)]. Ebola Virus. Available online: https://www.ncbi.nlm.nih.gov/books/NBK560579.
    1. Lefebvre A., Fiet C., Belpois-Duchamp C., Tiv M., Astruc K., Glélé L.A. Case fatality rates of Ebola virus diseases: A meta-analysis of World Health Organization data. Med. Mal. Infect. 2014;44:412–416. doi: 10.1016/j.medmal.2014.08.005. - DOI - PubMed
    1. Zawilińska B., Kosz-Vnenchak M. General introduction into the Ebola virus biology and disease. Folia Med. Cracov. 2014;54:57–65. - PubMed

LinkOut - more resources