. 2022 Jun 20;10(6):981.
doi: 10.3390/vaccines10060981.

Impact of DNA Prime/Protein Boost Vaccination against Campylobacter jejuni on Immune Responses and Gut Microbiota in Chickens

Affiliations

Impact of DNA Prime/Protein Boost Vaccination against Campylobacter jejuni on Immune Responses and Gut Microbiota in Chickens

Noémie Gloanec et al. Vaccines (Basel). .

Abstract

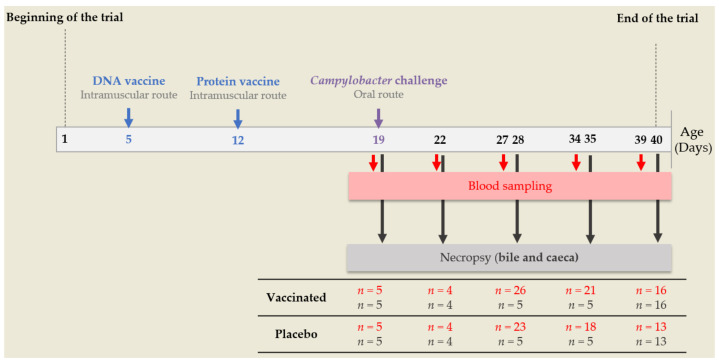
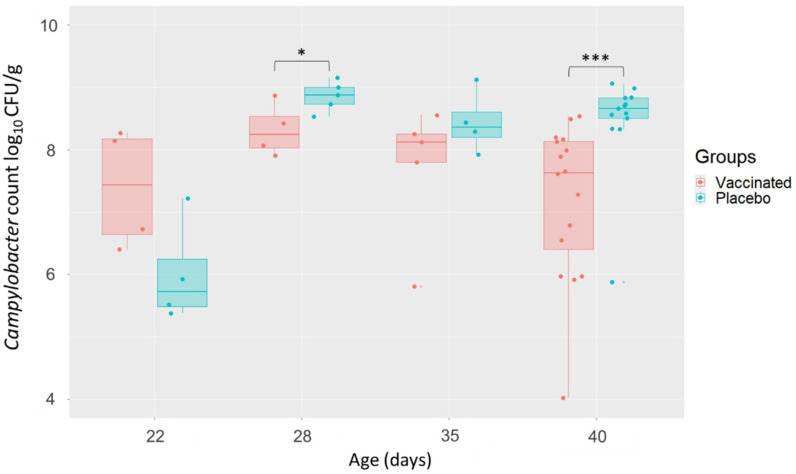
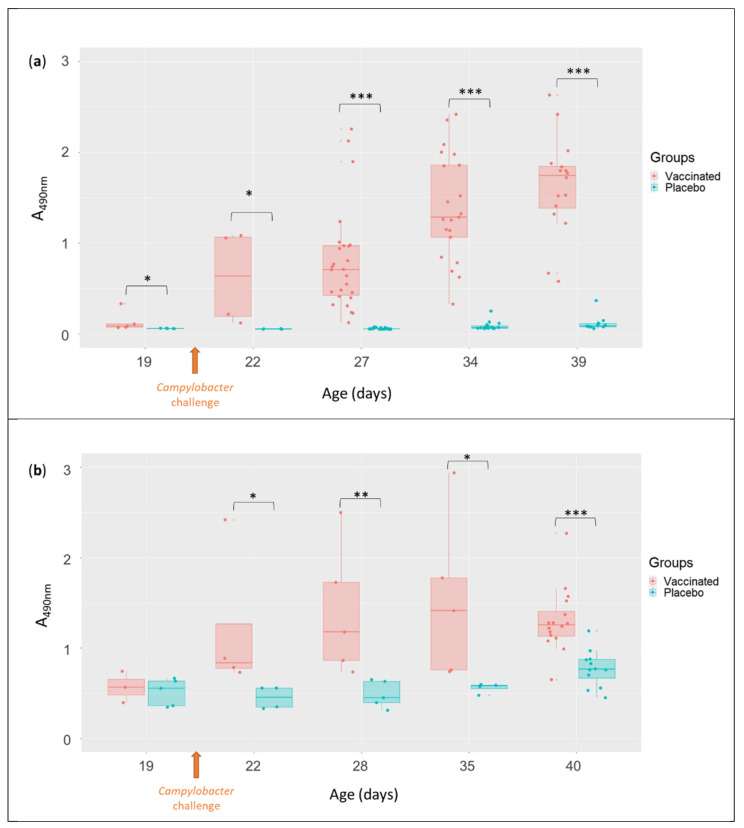
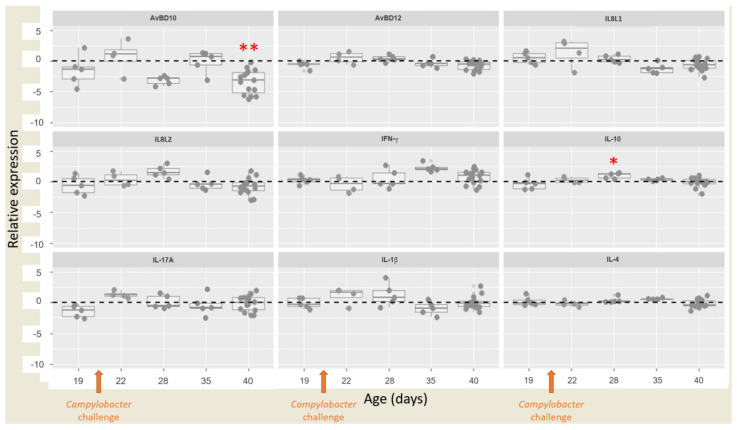
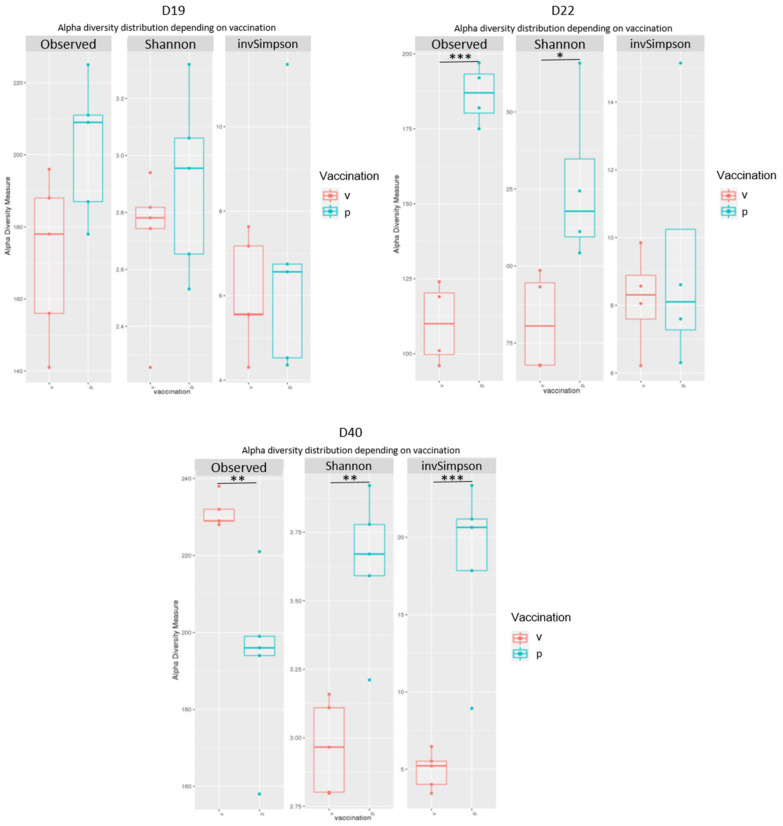
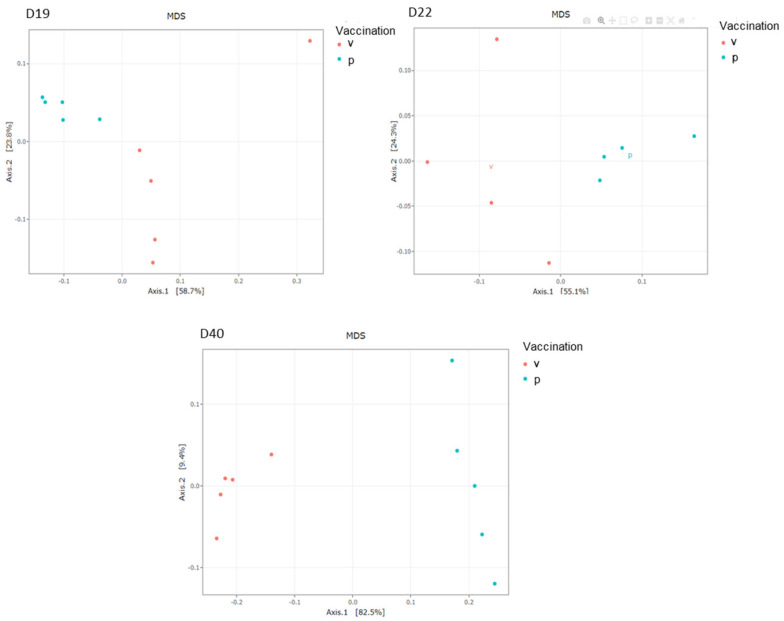
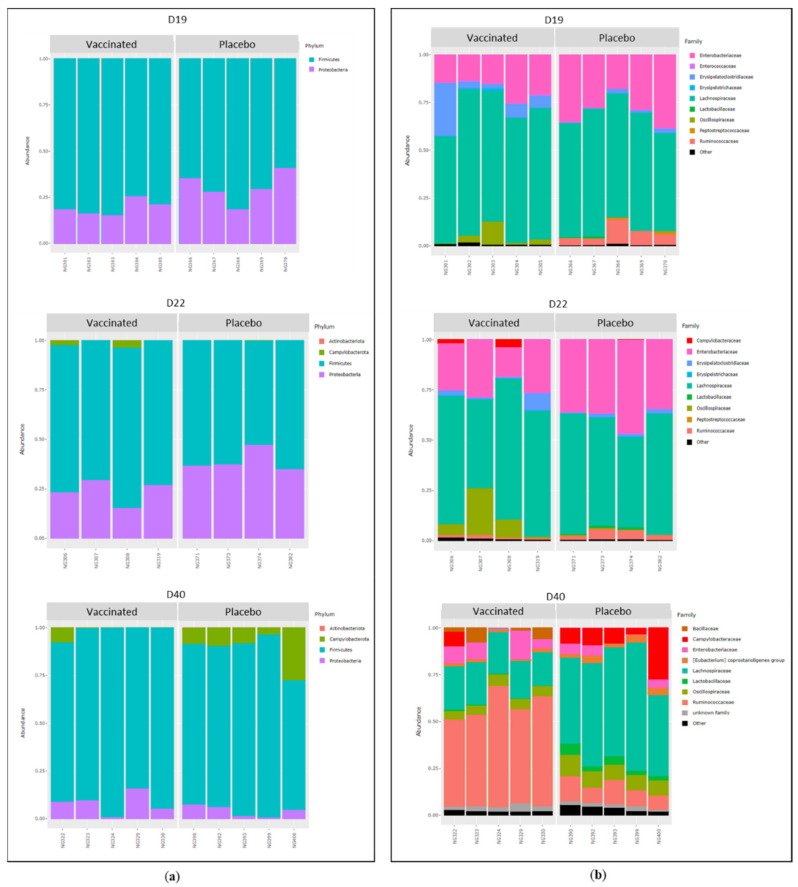
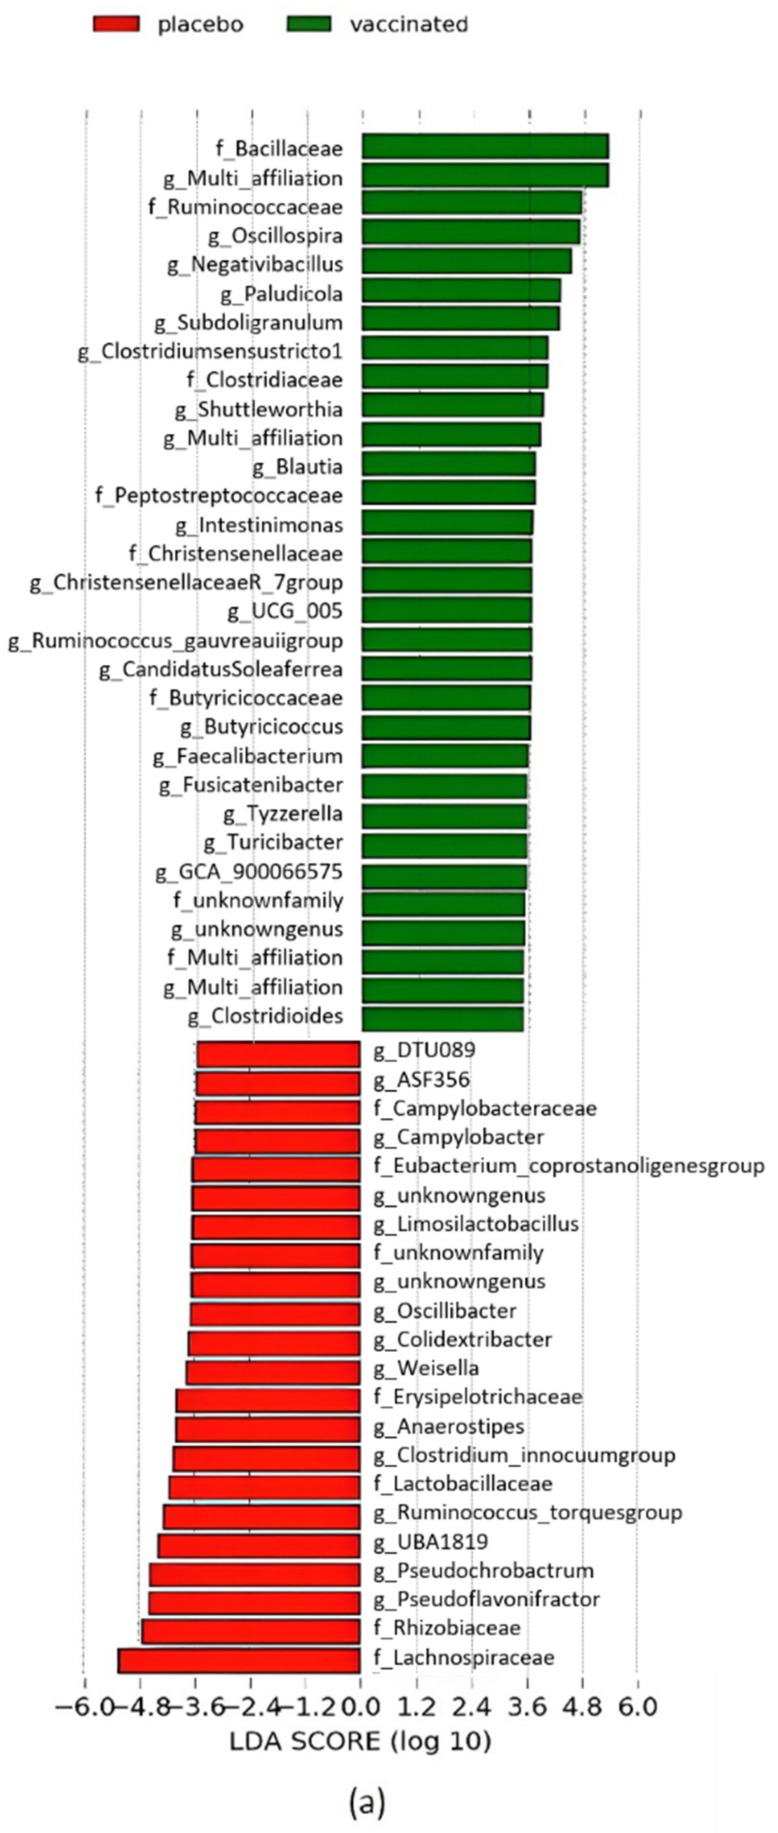
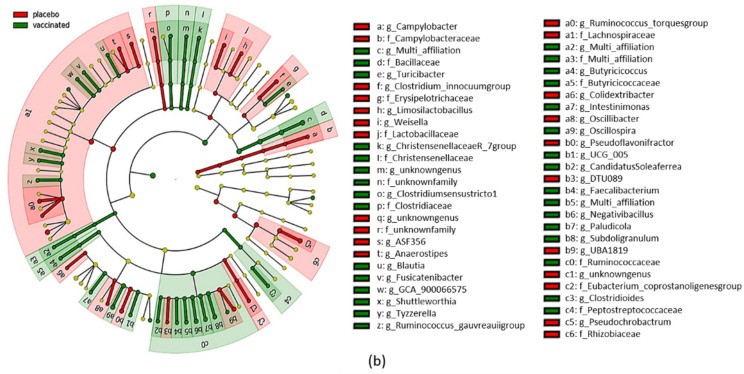
Campylobacteriosis is reported to be the leading zoonosis in Europe, and poultry is the main reservoir of Campylobacter. Despite all the efforts made, there is still no efficient vaccine to fight this bacterium directly in poultry. Recent studies have reported interactions between the chicken immune system and gut microbiota in response to Campylobacter colonisation. The present study was designed to analyse in more depth the immune responses and caecal microbiota following vaccination with a DNA prime/protein boost flagellin-based vaccine that induces some protection in specific-pathogen-free White Leghorn chickens, as shown previously. These data may help to improve future vaccination protocols against Campylobacter in poultry. Here a vaccinated and a placebo group were challenged by C. jejuni at the age of 19 days. A partial reduction in Campylobacter loads was observed in the vaccinated group. This was accompanied by the production of specific systemic and mucosal antibodies. Transient relatively higher levels of Interleukin-10 and antimicrobial peptide avian β-defensin 10 gene expressions were observed in the vaccinated and placebo groups respectively. The analysis of caecal microbiota revealed the vaccination's impact on its structure and composition. Specifically, levels of operational taxonomic units classified as Ruminococcaceae and Bacillaceae increased on day 40.

Keywords: Campylobacter jejuni caecal colonisation; caecal microbiota composition; flagellin antigen; innate immunity; poultry; systemic and mucosal immune response.


Conflict of interest statement

The authors declare no conflict of interest. The funders had no role in the design of the study; in the collection, analysis, or interpretation of data; in the writing of the manuscript, or in the decision to publish the results.

Figures

Figure 1
Figure 1
Main steps of the experimental procedure. Each day, the number of chickens (n) used for blood sampling and necropsy is represented in red or brown respectively.
Figure 2
Figure 2
Effect of vaccination on Campylobacter colonisation of chicken caeca according to the age of the chickens (corresponding to the experiment days). Significant differences between the two groups are indicated by asterisks (* p < 0.05, *** p < 0.001; Wilcoxon rank sum test).
Figure 3
Figure 3
Anti-flagellin antibody levels after vaccination and challenge. (a) Levels of anti-flagellin IgY antibodies in serum. (b) Levels of anti-flagellin IgA antibodies in bile. Significant differences between the two groups are indicated by asterisks (* p < 0.05, ** p < 0.01, *** p < 0.001; Wilcoxon rank sum test).
Figure 4
Figure 4
Relative gene expressions of cytokines, chemokines and AMPs in caecum. Relative gene expression represents log2 ratio vaccinated/placebo. Values > 0 (above the dotted black line) represent relative over-expressions of cytokine, chemokine or AMP genes in the caecum of vaccinated chickens compared with the placebo group while values < 0 (below the dotted black line) represent relative sub-expressions of cytokine, chemokine or AMP genes in the caecum of vaccinated chickens compared with the placebo group. Student’s parametric test was used when the normality and homogeneity criteria of the variances were validated (checked by the Shapiro–Wilk normality test and Bartlett’s test respectively); otherwise, the non-parametric Mann–Whitney test was used. Significant differences between 2−ΔCt values of the vaccinated and placebo groups are indicated by asterisks in red (* p < 0.05, ** p < 0.01) for the expression of each gene at the corresponding time points. The genes evaluated were interferon (IFN)-γ, interleukin (IL)8-like(L)1, IL8L2, IL-1β, IL-4, IL-10, IL-17A, antimicrobial peptide avian β-defensins 10 (AvBD10) and AvBD12.
Figure 5
Figure 5
Richness and alpha diversity indices for chicken’s caecal microbiota on D19, D22 and D40. Significant differences between the vaccinated (v) group in red and placebo (p) group in blue are indicated by asterisks (* p < 0.05, ** p < 0.01, *** p < 0.001).
Figure 6
Figure 6
Representation of beta diversity of the chicken caecal microbiota on D19, D22 and D40. MDS based on weighted UniFrac distance. The vaccinated (v) group is in red and the placebo (p) group in blue.
Figure 7
Figure 7
Taxonomic composition represented by relative abundance of bacterial communities from the caecal microbiota of chickens from the vaccinated (v) and placebo (p) groups on D19, D22 and D40. (a) Relative abundance of phyla identified in caecal microbiota represented by a bar for each sample. (b) Relative abundance of the nine main families represented by a bar for each sample.
Figure 8
Figure 8
Differential abundances for members of the caecal microbial communities from the vaccinated and placebo groups on D40, identified by linear discrimination analysis coupled with effect size (LefSE). (a) Histogram of the LDA scores computed for taxa with significantly different relative abundance in the vaccinated group in green and placebo group in red. Only taxa belonging to family and genera with an LDA threshold value > two are reported. (b) Cladogram representing LefSE results of the identified taxa according to their phylogenetic characteristics. The green circles represent those of greater abundance in the vaccinated group, and red circles those in the placebo group. Yellow indicates non-significant differences between the two groups. The diameters of the circles are proportional to the taxon’s abundance. This representation highlights the presence of the differentially abundant taxonomic levels (f_ family, g_genera) as concentric arcs.
Figure 8
Figure 8
Differential abundances for members of the caecal microbial communities from the vaccinated and placebo groups on D40, identified by linear discrimination analysis coupled with effect size (LefSE). (a) Histogram of the LDA scores computed for taxa with significantly different relative abundance in the vaccinated group in green and placebo group in red. Only taxa belonging to family and genera with an LDA threshold value > two are reported. (b) Cladogram representing LefSE results of the identified taxa according to their phylogenetic characteristics. The green circles represent those of greater abundance in the vaccinated group, and red circles those in the placebo group. Yellow indicates non-significant differences between the two groups. The diameters of the circles are proportional to the taxon’s abundance. This representation highlights the presence of the differentially abundant taxonomic levels (f_ family, g_genera) as concentric arcs.

Similar articles

Cited by

References

    1. EFSA and ECDC The European Union One Health 2019 Zoonoses Report. EFSA J. 2021;19:e06406. doi: 10.2903/j.efsa.2021.6406. - DOI - PMC - PubMed
    1. Wassenaar T.M., Blaser M.J. Pathophysiology of Campylobacter Jejuni Infections of Humans. Microbes Infect. 1999;1:1023–1033. doi: 10.1016/S1286-4579(99)80520-6. - DOI - PubMed
    1. Nyati K.K., Nyati R. Role of Campylobacter Jejuni Infection in the Pathogenesis of Guillain-Barré Syndrome: An Update. BioMed Res. Int. 2013;2013:852195. doi: 10.1155/2013/852195. - DOI - PMC - PubMed
    1. Hansson I., Pudas N., Harbom B., Engvall E.O. Within-Flock Variations of Campylobacter Loads in Caeca and on Carcasses from Broilers. Int. J. Food Microbiol. 2010;141:51–55. doi: 10.1016/j.ijfoodmicro.2010.04.019. - DOI - PubMed
    1. Hue O., Allain V., Laisney M.-J., Le Bouquin S., Lalande F., Petetin I., Rouxel S., Quesne S., Gloaguen P.-Y., Picherot M., et al. Campylobacter Contamination of Broiler Caeca and Carcasses at the Slaughterhouse and Correlation with Salmonella Contamination. Food Microbiol. 2011;28:862–868. doi: 10.1016/j.fm.2010.11.003. - DOI - PubMed

LinkOut - more resources