. 2022 May 24;14(6):1132.
doi: 10.3390/v14061132.

Strategies to Mitigate Establishment under the Wolbachia Incompatible Insect Technique

Affiliations

Strategies to Mitigate Establishment under the Wolbachia Incompatible Insect Technique

Stacy Soh et al. Viruses. .

Abstract

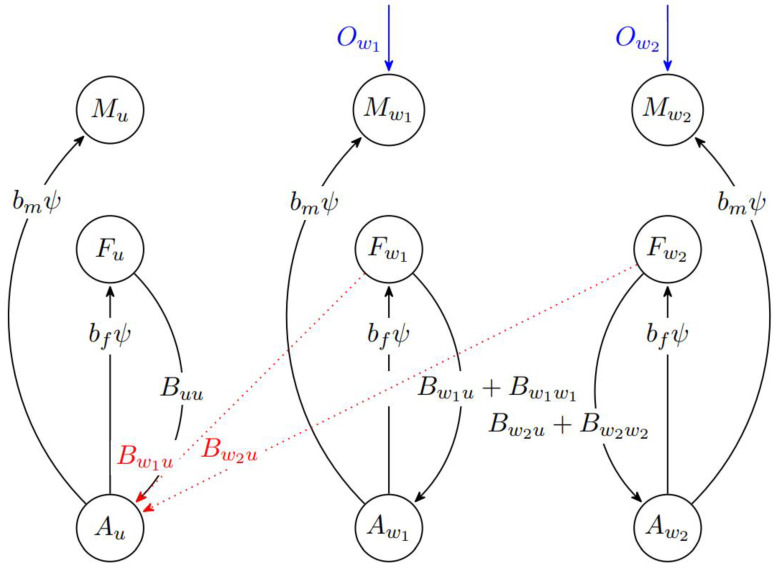
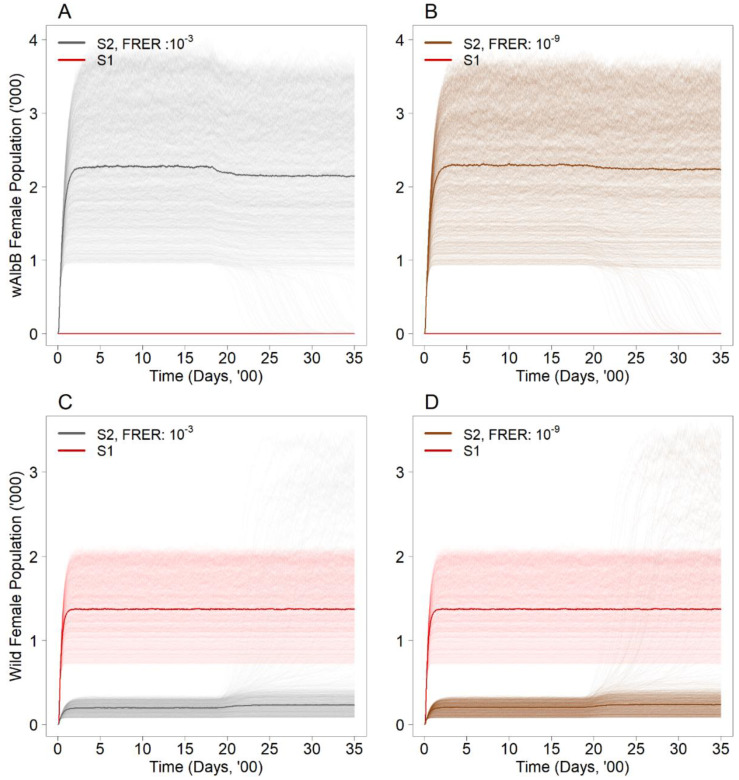
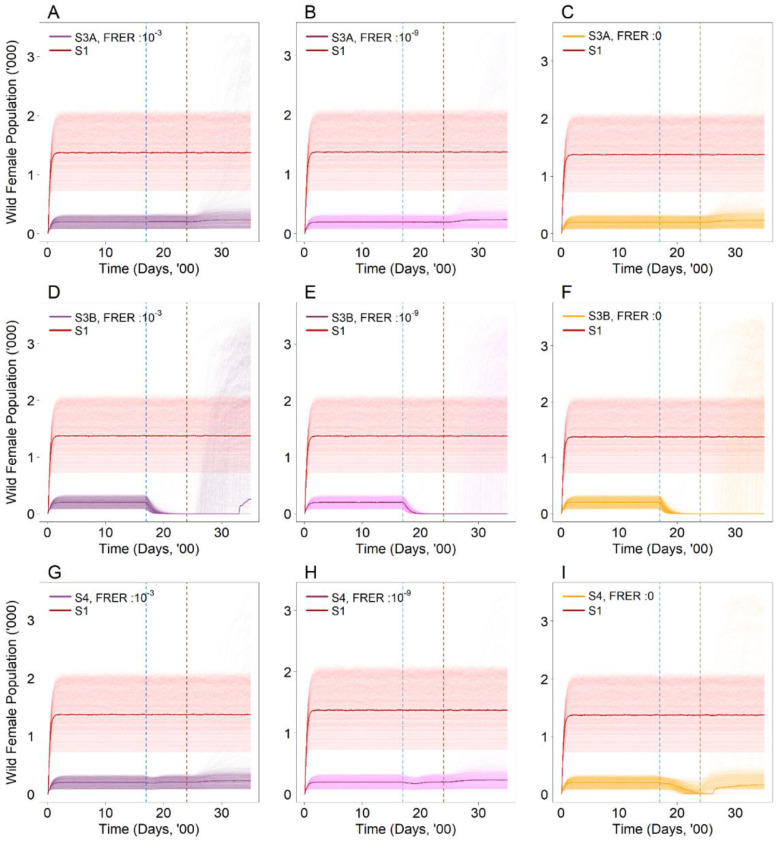
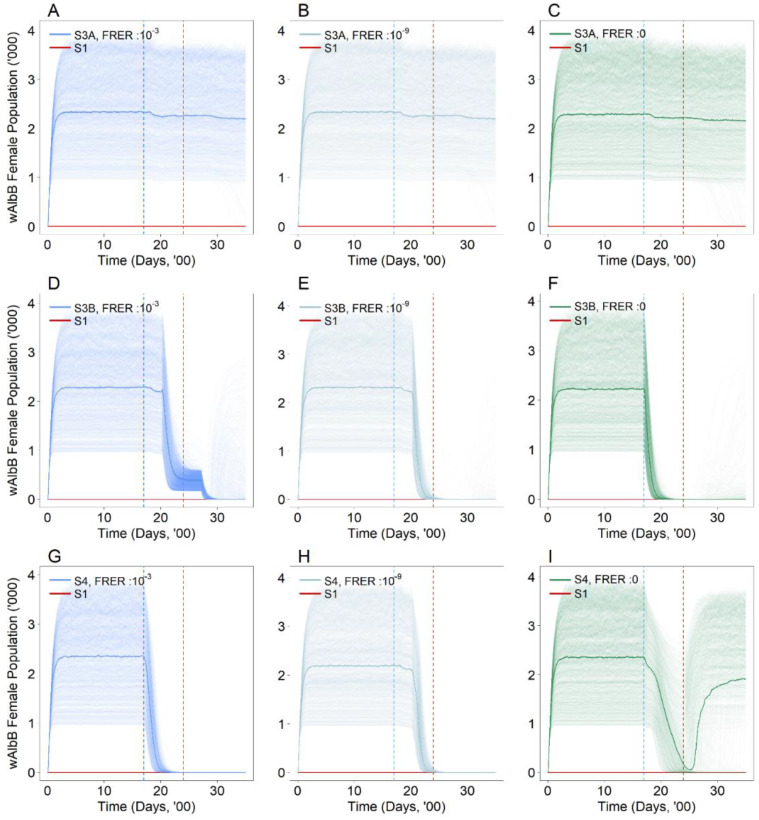
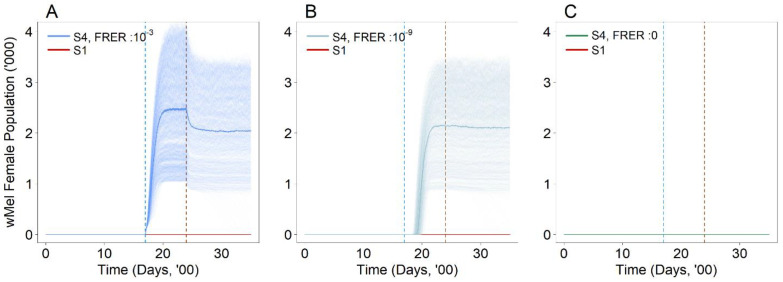
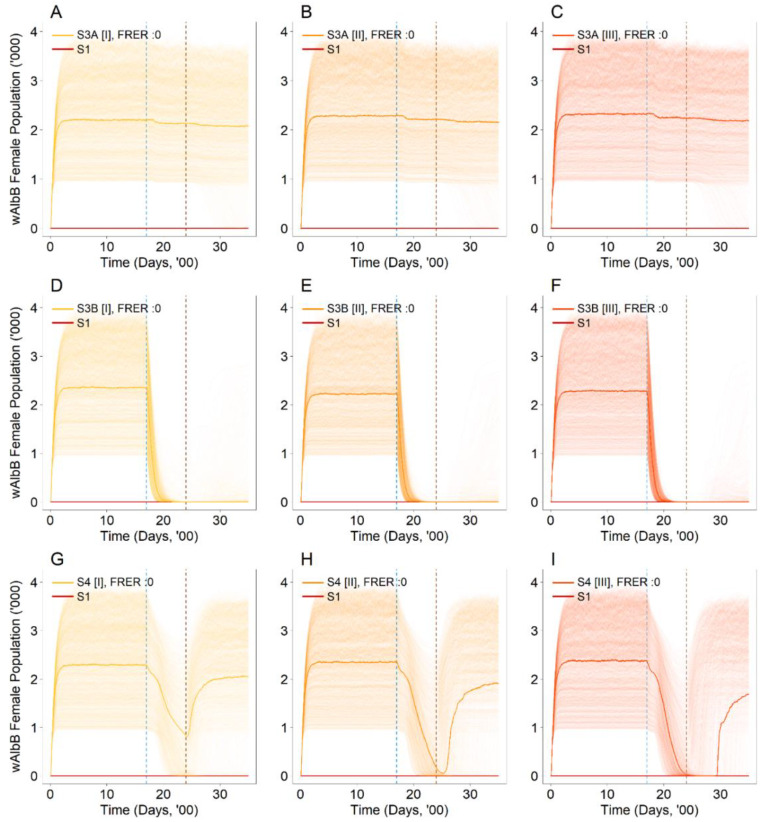
The Incompatible Insect Technique (IIT) strategy involves the release of male mosquitoes infected with the bacterium Wolbachia. Regular releases of male Wolbachia-infected mosquitoes can lead to the suppression of mosquito populations, thereby reducing the risk of transmission of vector-borne diseases such as dengue. However, due to imperfect sex-sorting under IIT, fertile Wolbachia-infected female mosquitoes may potentially be unintentionally released into the environment, which may result in replacement and failure to suppress the mosquito populations. As such, mitigating Wolbachia establishment requires a combination of IIT with other strategies. We introduced a simple compartmental model to simulate ex-ante mosquito population dynamics subjected to a Wolbachia-IIT programme. In silico, we explored the risk of replacement, and strategies that could mitigate the establishment of the released Wolbachia strain in the mosquito population. Our results suggest that mitigation may be achieved through the application of a sterile insect technique. Our simulations indicate that these interventions do not override the intended wild type suppression of the IIT approach. These findings will inform policy makers of possible ways to mitigate the potential establishment of Wolbachia using the IIT population control strategy.

Keywords: Aedes aegypti; Incompatible Insect Technique (IIT); Sterile Insect Technique (SIT); Wolbachia; compartmental modelling; dengue; establishment; introgression; simulation.


Conflict of interest statement

The authors declare no conflict of interest.

Figures

Figure 1
Figure 1
Schematic of the mosquito ecological model incorporating suppression and interventions to mitigate establishment. The circles represent specific mosquito populations, and the lines represent the transitions from one mosquito population to another, with the values within the lines representing transition rates between populations. The blue lines represent the release of male Wolbachia inoculated mosquitoes at rates Ow1 or Ow2. The birthing rates capture the uninfected offspring that are produced when the uninfected males mate with the uninfected females. When the wAlbB or wMel-infected males mate with the uninfected females, inviable offspring are produced due to CI. Uninfected males mating with the infected wAlbB or wMel-infected female produces a fraction of infected offspring by vertical transmission. Mating between wAlbB or wMel-infected males with wAlbB or wMel-infected females respectively produces a fraction of infected offspring. Mating between wAlbB-infected males (or wMel-infected males) with wMel females (or wAlbB females) resulted in inviable offspring due to CI.
Figure 2
Figure 2
Number of Wolbachia-infected female mosquitoes (wAlbB) in the population with (A) FRER: 10−3 and (B) FRER: 10−9 under the suppression approach (S2) with the same male release intensity. Number of wild type female mosquitos in the population with (C) FRER: 10−3 and (D) FRER: 10−9 under the suppression approach (S2) with the same male release intensity. The lighter shade solid lines represent the 1000 simulations, and the dark solid lines represent the median of the 1000 simulations. The red solid line represents the baseline scenario (S1).
Figure 3
Figure 3
Number of wild type female mosquitoes in the population with (A) FRER: 10−3, (B) FRER: 10−9 and (C) FRER: 0 under the first strain female irradiation (S3A) with the same male release intensity. Number of wild type female mosquitoes in the population with (D) FRER: 10−3, (E) FRER: 10−9 and (F) FRER: 0 under the first strain male and female irradiation (S3B) with the same male release intensity. Number of wild type female mosquitoes in the population with (G) FRER: 10−3, (H) FRER: 10−9 and (I) FRER: 0 under the second strain introduction (S4) with the same male release intensity. The lighter shade solid lines represent the 1000 simulations, and the dark solid lines represent the median of the 1000 simulations. The blue and brown dotted vertical line represents the start and end of the intervention (S3A, S3B and S4) respectively. The red solid line represents the baseline scenario (S1).
Figure 4
Figure 4
Number of Wolbachia (wAlbB) female mosquitoes in the population with (A) FRER: 10−3, (B) FRER: 10−9 and (C) FRER: 0 under the first strain female irradiation (S3A) with the same male release intensity. Number of wild type female mosquitoes in the population with (D) FRER: 10−3, (E) FRER: 10−9 and (F) FRER: 0 under the first strain male and female irradiation (S3B) with the same male release intensity. Number of wild type female mosquitoes in the population with (G) FRER: 10−3, (H) FRER: 10−9 and (I) FRER: 0 under the second strain introduction (S4) with the same male release intensity. The lighter shade solid lines represent the 1000 simulations, and the dark solid lines represent the median of the 1000 simulations. The blue and brown dotted vertical line represents the start and end of the intervention (S3A, S3B and S4) respectively. The red solid line represents the baseline scenario (S1).
Figure 5
Figure 5
Number of second strain Wolbachia (wMel) female mosquitoes in the population with (A) FRER: 10−3, (B) FRER: 10−9 and (C) FRER: 0 under the second strain introduction (S4) with the same male release intensity. The lighter shade solid lines represent the 1000 simulations, and the dark solid lines represent the median of the 1000 simulations. The blue and brown dotted vertical line represents the start and end of the intervention (S4) respectively. The red solid line represents the baseline scenario (S1).
Figure 6
Figure 6
Number of Wolbachia (wAlbB) female mosquitoes in the population with FRER: 0 with (A) Reduced intensity of 40,000 releases per week (S3A [I]), (B) Baseline intensity of 60,000 releases per week (S3A [II]) and (C) Increased intensity of 80,000 releases per week (S3A [II]) of male releases under the first strain female irradiation (S3A). Number of Wolbachia (wAlbB) female mosquitoes in the population with FRER: 0 with (D) Reduced intensity of 40,000 releases per week (S3B [I]), (E) Baseline intensity of 60,000 releases per week (S3B [II]) and (F) Increased intensity of 80,000 releases per week (S3B [II]) of male releases under the first strain male and female irradiation (S3B). Number of Wolbachia (wAlbB) female mosquitoes in the population with FRER: 0 with (G) Reduced intensity of 40,000 releases per week (S3B [I]), (H) Baseline intensity of 60,000 releases per week (S3B [II]) and (I) Increased intensity of 80,000 releases per week (S3B [II]) of male releases under the second strain introduction (S4). The lighter shade solid lines represent the 1000 simulations, and the dark solid lines represent the median of the 1000 simulations. The blue and brown dotted vertical line represents the start and end of the intervention (S3A, S3B and S4) respectively. The red solid line represents the baseline scenario (S1).

Similar articles

Cited by

References

    1. Souza-Neto J.A., Powell J.R., Bonizzoni M. Aedes aegypti vector competence studies: A review. Infect. Genet. Evol. 2019;67:191–209. doi: 10.1016/j.meegid.2018.11.009. - DOI - PMC - PubMed
    1. World Health Organization Vector-Borne Diseases Fact Sheet. 2017. [(accessed on 30 December 2021)]. Available online: https://www.who.int/news-room/fact-sheets/detail/vector-borne-
    1. Evelyn M., Murray A., Quam M.B., Wilder-Smith A. Epidemiology of dengue: Past, present and future prospects. Clin. Epidemiol. 2013;5:299. - PMC - PubMed
    1. Gubler D.J. Dengue, Urbanization and Globalization: The Unholy Trinity of the 21st Century. Trop. Med. Health. 2011;39((Suppl. S4)):S3–S11. doi: 10.2149/tmh.2011-S05. - DOI - PMC - PubMed
    1. Cattarino L., Rodriguez-Barraquer I., Imai N., Cummings D.A.T., Ferguson N.M. Mapping global variation in dengue transmission intensity. Sci. Transl. Med. 2020;12:105788. doi: 10.1126/scitranslmed.aax4144. - DOI - PubMed