. 2022 May 26;14(6):1150.
doi: 10.3390/v14061150.

The Process of Filopodia Induction during HPV Infection

Affiliations

The Process of Filopodia Induction during HPV Infection

Alyssa Biondo et al. Viruses. .

Abstract

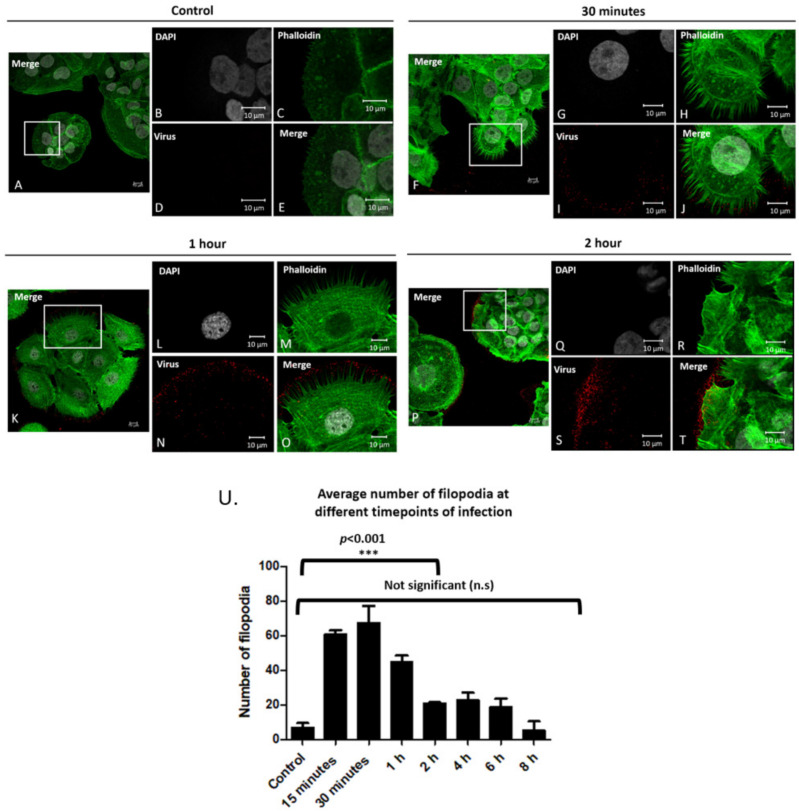
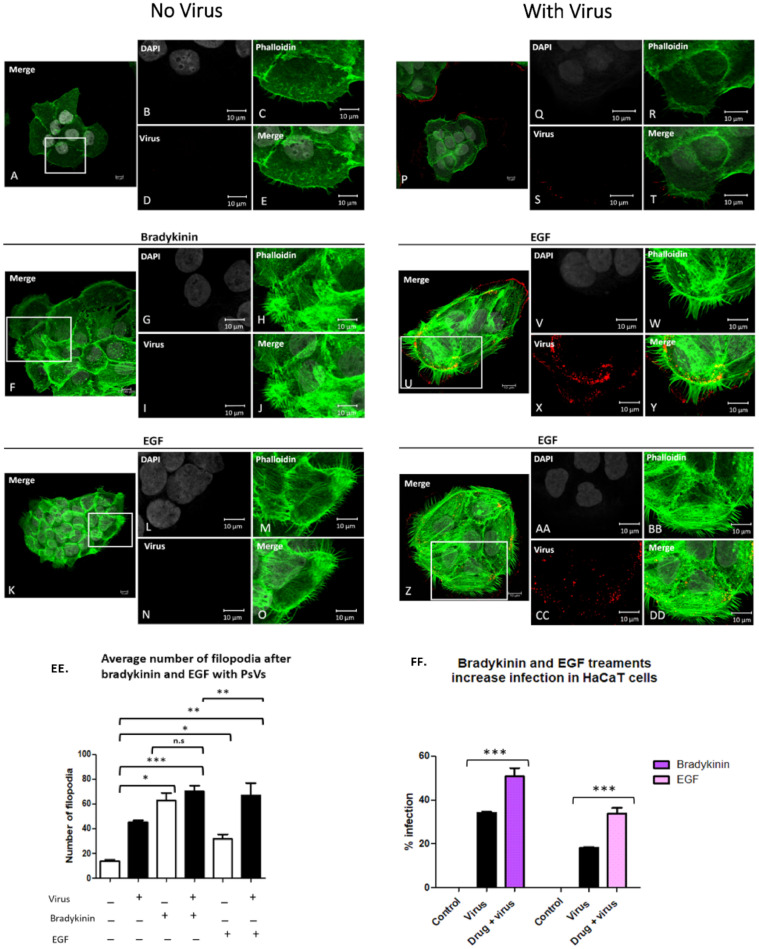
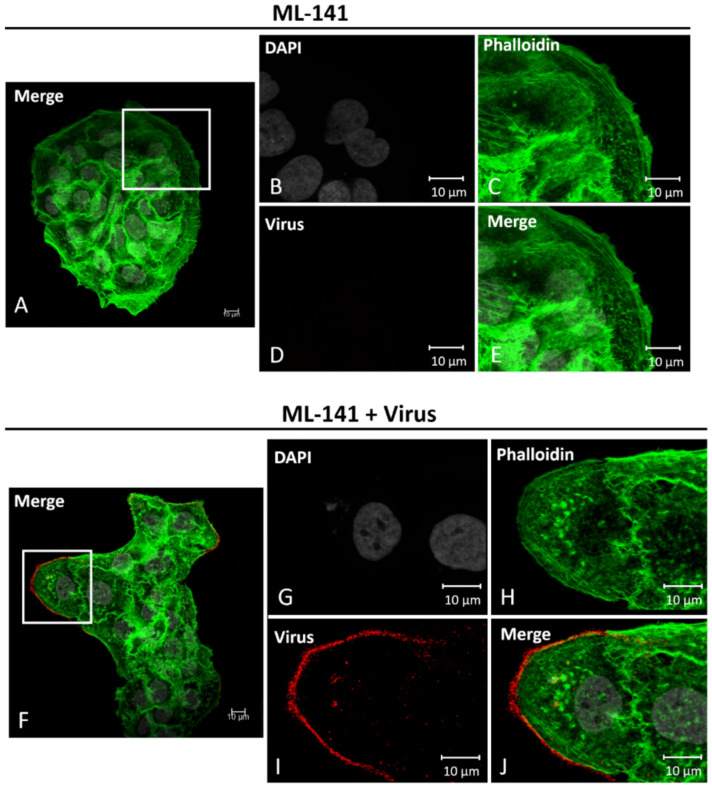
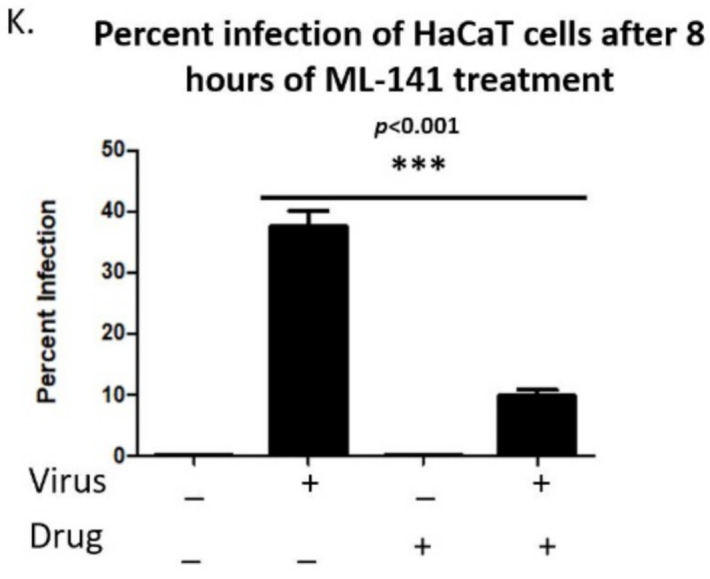
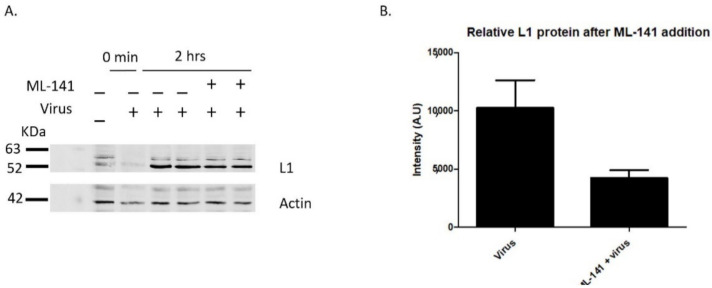
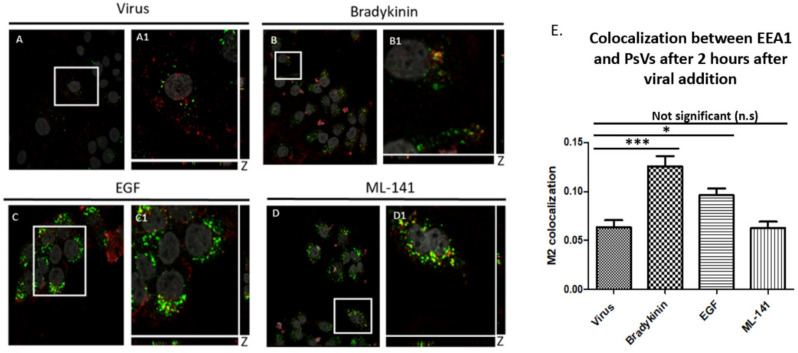
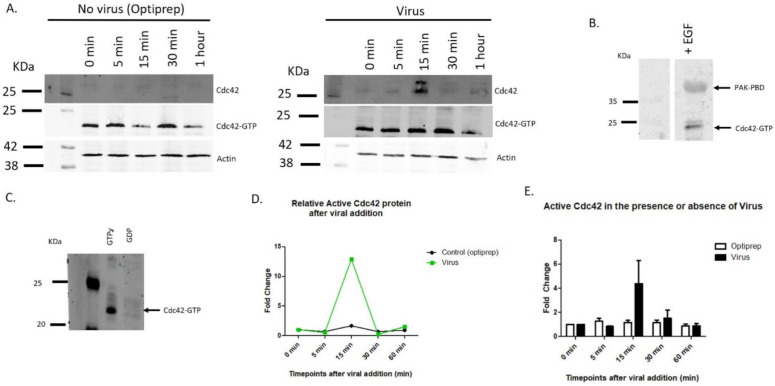
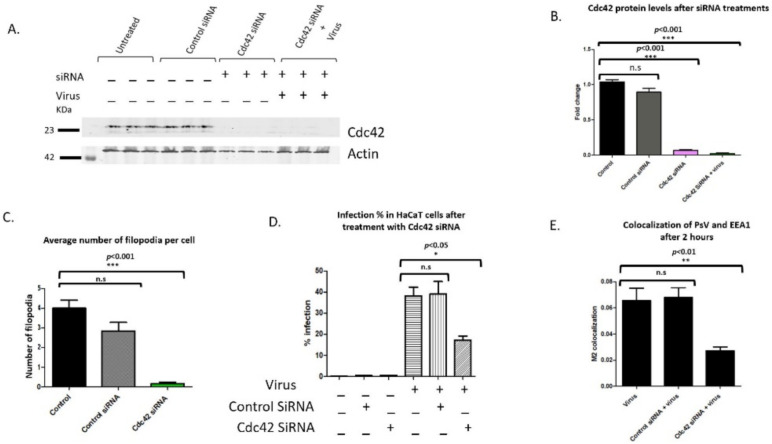
Human Papillomavirus 16 (HPV16) infects mucosal and epithelial cells and has been identified as a high-risk HPV type that is an etiologic agent of human cancers. The initial infectious process, i.e., the binding of the virus particle and its entry into the host cell, has been studied extensively, although it is not fully understood. There is still a gap in understanding the steps by which the virus is able to cross the plasma membrane after receptor binding. In this study, we demonstrate that after HPV16 comes into contact with a plasma membrane receptor, there are cytoskeletal changes resulting in an increase of filopodia numbers. This increase in filopodia numbers was transient and was maintained during the first two hours after virus addition. Our data show that there is a statistically significant increase in infection when filopodia numbers are increased by the addition of drug and virus simultaneously, and a decrease in virus infection when filopodia formation is inhibited. We describe that HPV16 binding results in the activation of Cdc42 GTPase that in turn results in an increase in filopodia. siRNA directed at Cdc42 GTPase resulted in a statistically significant reduction of infection and a corresponding lack of filopodia induction.

Keywords: HPV16; filopodia; viral entry.


Conflict of interest statement

The authors declare that they have no conflict of interest.

Figures

Figure 1
Figure 1
Filopodia numbers increase after the addition of PsVs. Confocal microscopy images of control cells without PsVs addition (AE), and after PsV addition for 30 min (FJ), 1 h (KO), and 2 h (PT). Cell nuclei were stained with DAPI (grey), phalloidin stained filopodia (green), and H16.V5 antibody stained HPV16 L1 protein (red). Full merged images of all channels (A,F,K,P). Zoomed in images of merged images (E,J,O,T). Average number of filopodia per cell after viral addition for 15 min–8 h (U). Filopodia were counted using LAS X Life Science Microscope Software Platform for fifteen cells at each timepoint for three separate experiments (n = 45). Images are shown in X, Y, Z planed Z stacks. An ANOVA Dunnett’s multiple comparisons test was used to evaluate statistical significance (samples were compared to control cells, ***, p < 0.001). Averages are displayed with SEM.
Figure 2
Figure 2
Bradykinin and EGF treatments increase the average number of filopodia in HaCaT cells and increase infection. HaCaT cells were seeded onto coverslips and treated with 200 ng/mL bradykinin, 200 ng/mL EGF, plus virus for 15 min. Confocal microscopy images of control cells (AE), and cells treated with bradykinin (FJ) or EGF (KO) without virus. Cells incubated with virus alone (PT) or with virus and bradykinin (UY) or EGF (ZDD). Nuclei stained with DAPI (grey), filopodia visualized with phalloidin (green), and L1 capsid stained with H16.V5 antibody (red). All channels were merged (E,J,O,T,Y,DD). Graph representation of average filopodia numbers for control cells and cells treated with virus, bradykinin, EGF, or drug with virus (EE). Filopodia were counted using LAS X Life Science Microscope Software Platform. Statistical significance was determined by ANOVA Dunnett’s multiple comparison test (n = 45, *, p < 0.05, **, p < 0.01, ***, p < 0.001). Percent infection with or without drug treatment was measured with flow cytometry (FF). Flow cytometry data of infection in HaCaT cells with or without bradykinin and EGF. Data was taken from three individual experiments in triplicate. Statistical differences determined by ANOVA Dunnett’s multiple comparison test, (samples compared to control infection, n = 9, *** p < 0.001). Average was displayed with SEM.
Figure 3
Figure 3
Bradykinin and EGF treatments show increased viral binding. L1 viral capsid protein was measured via western blot after the incubation of 200 ng/mL bradykinin and EGF. PsVs were added for 0 min or 2 h with samples incubated with or without drug on ice. HaCaT cells were washed three times with 1× PBS and then harvested with trypsin. (A, 1st lane) control sample without PsVs and drug, (A, 2nd lane) control sample with virus that were immediately washed off, (A, 3rd and 4th lane) control infection after 2 h, (A, 5th and 6th lane) cells treated with bradykinin and virus for 2 h, (A, 7th and 8th lane) cells treated with EGF and virus for 2 h. (B) Densitometry data of western blot in A showing the relative intensity of L1 protein normalized to actin for two samples from different wells for each treatment with either virus or virus and drug.
Figure 4
Figure 4
ML-141 treatments inhibit filopodia and decrease HPV16 infection in HaCaT cells. Confocal microscopy images of cells treated with 10 µM ML-141 (AE) or treated with both drug and virus (FJ) for 2 h at 37 °C. Nuclei stained with DAPI (grey), F-actin visualized with phalloidin (green), and L1 capsid protein stained with H16.V5 (red). Merged images of all channels (E,J). Virus binds along the outside of the HaCaT cell membranes that lack filopodia (H). Percent infection with or without drug treatment was measured with flow cytometry (K). Data was taken from three individual experiments in triplicate. Statistical differences determined by ANOVA Dunnett’s multiple comparison test, (samples compared to control infection, n = 9, *** p < 0.001). Average was displayed with SEM.
Figure 4
Figure 4
ML-141 treatments inhibit filopodia and decrease HPV16 infection in HaCaT cells. Confocal microscopy images of cells treated with 10 µM ML-141 (AE) or treated with both drug and virus (FJ) for 2 h at 37 °C. Nuclei stained with DAPI (grey), F-actin visualized with phalloidin (green), and L1 capsid protein stained with H16.V5 (red). Merged images of all channels (E,J). Virus binds along the outside of the HaCaT cell membranes that lack filopodia (H). Percent infection with or without drug treatment was measured with flow cytometry (K). Data was taken from three individual experiments in triplicate. Statistical differences determined by ANOVA Dunnett’s multiple comparison test, (samples compared to control infection, n = 9, *** p < 0.001). Average was displayed with SEM.
Figure 5
Figure 5
ML-141 treatment reduces viral binding. L1 viral capsid protein was measured via western blot after the incubation of 10 µM ML-141. HaCaT cells were treated with ML-141 for 2 h prior to viral addition at 37 °C. PsVs were added for 0 min or 2 h with samples incubated with or without the drug on ice. HaCaT cells were washed three times with 1× PBS and then harvested with trypsin. (A, 1st lane) control sample without PsVs and drug, (A, 2nd lane) control sample with virus that was immediately washed off, (A, 3rd and 4th lane) control infection after 2 h, (A, 5th and 6th lane) cells treated with ML-141 and virus for 2 h. (B) Densitometry data of western blot in A showing the relative intensity of L1 protein normalized to actin for two samples from different wells treated with either virus or virus and 10 µM ML-141.
Figure 6
Figure 6
Filopodia inducer drugs increase internalization of PsVs into HaCaT cells. Colocalization measured the amount of PsVs (red) that was trafficked to the early endosome (green). Confocal microscopy images of cells treated with virus and drug for 2 h. Cells treated with virus (A,A1), 200 ng/mL bradykinin (B,B1), 200 ng/mL EGF (C,C1), and 10 µM ML-141 for 2 h (D,D1). DAPI was used to stain cell nuclei (grey), H16.V5 antibody was used to stain L1 capsid protein (red), and EEA1 was used to stain for early endosome (green). Zoomed in images (A1D1). Colocalization of PsVs and EEA1 appeared yellow. The JACoP plugin for ImageJ was used to measure the M2 coefficient (fraction of red overlapping with green) with six confocal Z-scans for each condition. Graph representation of colocalization of six confocal scans (E). Statistical difference was determined by an ANOVA Dunnett’s multiple comparison test (samples compared to control infection, n = 6, *, p < 0.5, ***, p < 0.001). Average was displayed with SEM.
Figure 7
Figure 7
HPV16 activates Cdc42 protein at specific timepoints after viral addition. Active Cdc42 was evaluated with a pull-down using PAK-PBD coated beads. (A) Western blot of samples treated with (right side) or without (left side) virus for a single experiment. Blots for Cdc42 total protein, active Cdc42 (GTP bound), and actin. Levels of active Cdc42 was determined for cells incubated with virus for 5 min, 15 min, 30 min, and 60 min. (B) Positive control showing Cdc42 activation induced by 200 ng/mL EGF for 15 min. (C) Validity of PAK-PBD coated beads were evaluated with control lysates treated with GTPỿ and GDP for 15 min. (D) Densitometry data for one individual activation pulldown of Cdc42 with PAK-PBD glutathione beads represented in A. Relative active Cdc42 protein was normalized to 0-min timepoint. A peak in Cdc42 activity after 15 min of viral addition. (E) Mean values of seven separate activation pulldown experiments for GTP bound Cdc42. Activation of Cdc42 after viral addition occurs most often between 15–30 min.
Figure 8
Figure 8
siRNA mediated knockdown of Cdc42 results in a significant decrease in infection and internalization. Cc42 protein levels were knocked down with siRNA. Cells were treated with control siRNA and Cdc42 siRNA for 48 h. (A) Western blot analysis of siRNA knockdown using Cdc42 and actin antibodies. Cells were incubated with virus on ice for 2 h and unbound virus was washed from wells. Cdc42 protein levels were normalized with actin. (B) Densitometry of western blot showing a significant decrease in Cdc42 protein levels after 48 h even with the addition of virus (samples compared to control with no siRNA or virus, n = 3, ***, p < 0.001). (C). Average number of filopodia per cell after siRNA treatments. Filopodia were counted along the cell periphery with FiloQuant image J plugin, single image analysis. Statistical significance was determined by Dunnett’s multiple comparison test (compared samples to control cells not treated with universal or Cdc42 siRNA, n = 50, ***, p < 0.001). (D) Flow cytometry was performed on cells transfected with control and Cdc42 siRNA. Graph of infection percentages in HaCaT cells treated with control siRNA, Cdc42 siRNA, and virus. Statistical differences were determined by Dunnett’s multiple comparison test (samples compared to control infection, n = 9, *, p < 0.05). (E) Graph representation of colocalization between PsV and EEA1 after 2 h of viral addition for three independent experiments. Statistical difference was determined by unpaired two-tailed t-test (n = 6, **, p < 0.01). Average was displayed with SEM.
Figure 9
Figure 9
Cells treated with Cdc42 siRNA undergo cell cycle arrest in the presence and absence of virus. Histograms showing the percentage of cells in different stages of the cell cycle based on DNA content examined by propidium iodine staining via flow cytometry (AF). Control cells not treated with virus or siRNA (A), cells treated with virus (B), cells treated with control siRNA (C), cells treated with both control siRNA and virus (D), cells treated with Cdc42 siRNA (E), and cells treated with both Cdc42 siRNA and virus (F). Graphic representation of the percentage of cells in each stage of the cell cycle after each treatment (G), n = 3. Cells were treated with control or Cdc42 siRNA for 48 h prior to virus addition. Virus was permitted to bind to cells for 2 h on ice with remaining virus removed with PBS washes. Flow cytometry was performed 48 h after viral addition.

Similar articles

Cited by

References

    1. Molijn A., Kleter B., Quint W., van Doorn L.J. Molecular diagnosis of human papillomavirus (HPV) infections. J. Clin. Virol. 2005;32:43–51. doi: 10.1016/j.jcv.2004.12.004. - DOI - PubMed
    1. Chaturvedi A.K., Engels E.A., Pfeiffer R.M., Hernandez B.Y., Xiao W., Kim E., Jiang B., Goodman M.T., Sibug-Saber M., Cozen W., et al. Human papillomavirus and rising oropharyngeal cancer incidence in the United States. J. Clin. Oncol. 2011;29:4294–4301. doi: 10.1200/JCO.2011.36.4596. - DOI - PMC - PubMed
    1. Cuschieri K., Cubie H.A., Whitley M.W., Seagar A.L., Arends M.J., Moore C., Gilkisson G., McGoogan E. Multiple high risk HPV infections are common in cervical neoplasia and young women in a cervical screening population. J. Clin. Pathol. 2004;57:68–72. doi: 10.1136/jcp.57.1.68. - DOI - PMC - PubMed
    1. Schelhaas M., Ewers H., Rajamäki M.L., Day P.M., Schiller J.T., Helenius A. Human papillomavirus type 16 entry: Retrograde cell surface transport along actin-rich protrusions. PLoS Pathog. 2008;4:e1000148. doi: 10.1371/journal.ppat.1000148. - DOI - PMC - PubMed
    1. Schelhaas M., Shah B., Holzer M., Blattmann P., Kühling L., Day P.M., Schiller J.T., Helenius A. Entry of human papillomavirus type 16 by actin-dependent, clathrin- and lipid raft-independent endocytosis. PLoS Pathog. 2012;8:e1002657. doi: 10.1371/journal.ppat.1002657. - DOI - PMC - PubMed

Publication types

LinkOut - more resources