Comparative Evaluation of Three Commercial Quantitative Real-Time PCRs Used in Japan for Bovine Leukemia Virus
- PMID: 35746654
- PMCID: PMC9230052
- DOI: 10.3390/v14061182
Comparative Evaluation of Three Commercial Quantitative Real-Time PCRs Used in Japan for Bovine Leukemia Virus
Abstract
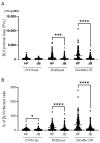
Bovine leukemia virus (BLV) is an oncogenic virus belonging to the genus Deltaretrovirus and is the causative agent of enzootic bovine leukosis. Proviral load (PVL) determined by real-time quantitative PCR (qPCR) is now widely used as an indicator of not only BLV infection, but also BLV disease progression. To interpret PVLs determined by different qPCRs used in Japan, we compared a chimeric cycling probe-based qPCR, CY415, targeting the BLV tax region; a TaqMan probe-based qPCR, RC202, targeting the BLV pol region; and a TaqMan probe-based qPCR, CoCoMo, targeting the BLV long terminal repeat (LTR) region. Whole-blood samples collected from 317 naturally BLV-infected cattle (165 Holstein-Friesian and 152 Japanese Black) and tumor tissue samples collected from 32 cattle at a meat inspection center were used. The PVLs determined by each qPCR were strongly correlated. However, the PVL and the proportion of BLV-infected cells determined by RC202 or CoCoMo were significantly higher than those determined by CY415. Genetic analysis of three tumor tissue samples revealed that LTR region mutations or a deletion affected the PVL determined by CoCoMo. These results suggest that the TaqMan-based RC202 or CoCoMo qPCR is better than CY415 for BLV PVL analysis. However, qPCR target region mutations were not rare in tumors and could hamper PVL analysis by using qPCR.
Keywords: BLV; bovine leukemia virus; commercial kit; provirus load; qPCR.
Conflict of interest statement
The authors declare no conflict of interest.
Figures


Similar articles
-
BLV-CoCoMo Dual qPCR Assay Targeting LTR Region for Quantifying Bovine Leukemia Virus: Comparison with Multiplex Real-Time qPCR Assay Targeting pol Region.Pathogens. 2024 Dec 16;13(12):1111. doi: 10.3390/pathogens13121111. Pathogens. 2024. PMID: 39770370 Free PMC article.
-
BLV-CoCoMo-qPCR: Quantitation of bovine leukemia virus proviral load using the CoCoMo algorithm.Retrovirology. 2010 Nov 2;7:91. doi: 10.1186/1742-4690-7-91. Retrovirology. 2010. PMID: 21044304 Free PMC article.
-
BLV-CoCoMo-qPCR: a useful tool for evaluating bovine leukemia virus infection status.BMC Vet Res. 2012 Sep 21;8:167. doi: 10.1186/1746-6148-8-167. BMC Vet Res. 2012. PMID: 22995575 Free PMC article.
-
BLV-CoCoMo-qPCR-2: improvements to the BLV-CoCoMo-qPCR assay for bovine leukemia virus by reducing primer degeneracy and constructing an optimal standard curve.Arch Virol. 2015 May;160(5):1325-32. doi: 10.1007/s00705-015-2377-3. Epub 2015 Mar 4. Arch Virol. 2015. PMID: 25731158
-
A complex network of transcription factors and epigenetic regulators involved in bovine leukemia virus transcriptional regulation.Retrovirology. 2023 Jun 2;20(1):11. doi: 10.1186/s12977-023-00623-w. Retrovirology. 2023. PMID: 37268923 Free PMC article. Review.
Cited by
-
BLV-CoCoMo Dual qPCR Assay Targeting LTR Region for Quantifying Bovine Leukemia Virus: Comparison with Multiplex Real-Time qPCR Assay Targeting pol Region.Pathogens. 2024 Dec 16;13(12):1111. doi: 10.3390/pathogens13121111. Pathogens. 2024. PMID: 39770370 Free PMC article.
-
Inter-laboratory comparison of eleven quantitative or digital PCR assays for detection of proviral bovine leukemia virus in blood samples.BMC Vet Res. 2024 Aug 26;20(1):381. doi: 10.1186/s12917-024-04228-z. BMC Vet Res. 2024. PMID: 39187880 Free PMC article.
-
The Global Epidemiology of Bovine Leukemia Virus: Current Trends and Future Implications.Animals (Basel). 2024 Jan 18;14(2):297. doi: 10.3390/ani14020297. Animals (Basel). 2024. PMID: 38254466 Free PMC article. Review.
-
Development of Dry and Liquid Duplex Reagent Mix-Based Polymerase Chain Reaction Assays as Novel Tools for the Rapid and Easy Quantification of Bovine Leukemia Virus (BLV) Proviral Loads.Viruses. 2024 Jun 25;16(7):1016. doi: 10.3390/v16071016. Viruses. 2024. PMID: 39066179 Free PMC article.
-
Study of the Genetic Expression of Antiretroviral Restriction Factors and Acute Phase Proteins in Cattle Infected with Bovine Leukemia Virus.Pathogens. 2023 Mar 29;12(4):529. doi: 10.3390/pathogens12040529. Pathogens. 2023. PMID: 37111415 Free PMC article.
References
-
- Stoye J.P., Blomberg J., Coffin J.M., Fan H., Hahn B., Neil J., Quackenbush S., Rethwilm A., Tristem M. Family Retroviridae. In: King A.M., Lefkowitz E., Adams M.J., Carstens E.B., editors. Virus Taxonomy: Ninth Report of the International Committee on Taxonomy of Viruses. Volume 9. Elsevier; San Diego, CA, USA: 2011. pp. 477–495.
-
- OIE . Manual of Diagnostic Tests and Vaccines for Terrestrial Animals 2019. World Health Organization for Animal Health; Paris, France: 2019. Enzootic bovine leukosis; pp. 1113–1124.
Publication types
MeSH terms
LinkOut - more resources
Full Text Sources

