. 2022 Jun 2;14(6):1210.
doi: 10.3390/v14061210.

EGR1 Upregulation during Encephalitic Viral Infections Contributes to Inflammation and Cell Death

Affiliations

EGR1 Upregulation during Encephalitic Viral Infections Contributes to Inflammation and Cell Death

Caitlin W Lehman et al. Viruses. .

Abstract

Early growth response 1 (EGR1) is an immediate early gene and transcription factor previously found to be significantly upregulated in human astrocytoma cells infected with Venezuelan equine encephalitis virus (VEEV). The loss of EGR1 resulted in decreased cell death but had no significant impact on viral replication. Here, we extend these studies to determine the impacts of EGR1 on gene expression following viral infection. Inflammatory genes CXCL3, CXCL8, CXCL10, TNF, and PTGS2 were upregulated in VEEV-infected cells, which was partially dependent on EGR1. Additionally, transcription factors, including EGR1 itself, as well as ATF3, FOS, JUN, KLF4, EGR2, and EGR4 were found to be partially transcriptionally dependent on EGR1. We also examined the role of EGR1 and the changes in gene expression in response to infection with other alphaviruses, including eastern equine encephalitis virus (EEEV), Sindbis virus (SINV), and chikungunya virus (CHIKV), as well as Zika virus (ZIKV) and Rift Valley fever virus (RVFV), members of the Flaviviridae and Phenuiviridae families, respectively. EGR1 was significantly upregulated to varying degrees in EEEV-, CHIKV-, RVFV-, SINV-, and ZIKV-infected astrocytoma cells. Genes that were identified as being partially transcriptionally dependent on EGR1 in infected cells included ATF3 (EEEV, CHIKV, ZIKV), JUN (EEEV), KLF4 (SINV, ZIKV, RVFV), CXCL3 (EEEV, CHIKV, ZIKV), CXCL8 (EEEV, CHIKV, ZIKV, RVFV), CXCL10 (EEEV, RVFV), TNF-α (EEEV, ZIKV, RVFV), and PTGS2 (EEEV, CHIKV, ZIKV). Additionally, inhibition of the inflammatory gene PTGS2 with Celecoxib, a small molecule inhibitor, rescued astrocytoma cells from VEEV-induced cell death but had no impact on viral titers. Collectively, these results suggest that EGR1 induction following viral infection stimulates multiple inflammatory mediators. Managing inflammation and cell death in response to viral infection is of utmost importance, especially during VEEV infection where survivors are at-risk for neurological sequalae.

Keywords: EGR1; Venezuelan equine encephalitis; alphaviruses; astrocytes; inflammation.


Conflict of interest statement

The authors declare no conflict of interest. The funders had no role in the design of the study; in the collection, analyses, or interpretation of data; in the writing of the manuscript; or in the decision to publish the results.

Figures
Figure 1
Figure 1
Differentially expressed genes consistent with neuronal cell death, inflammation, encephalitis, and/or EGR1 upregulation. Upregulated genes are displayed in shades of red. The darker the shade, the greater the differential gene expression. Genes with a yellow star contain predicted EGR1 binding sites within their promoter.
Figure 2
Figure 2
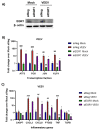
Transcription factors ATF3, FOS, JUN, and KLF4 and inflammatory genes CXCL8, PTGS2, and TNF-α transcription are partially dependent on EGR1 following VEEV infection after knockdown of EGR1 with siRNA. (A) U87MG cells were transfected with siNeg or siEGR1 for 48 h prior to infection with VEEV. Knockdown of EGR1 was confirmed via Western blot with β-actin used as the loading control. (B,C) U87MG cells were transfected in triplicate with either siNeg or siEGR1 for 48 h and then infected with VEEV TrD at an MOI of 5 for 1 h. RNA was extracted from samples collected at 16 hpi. Gene expression for transcription factors (B) and inflammatory genes (C) was determined by RT-qPCR using TaqMan assays. Data were normalized to mock-infected cells and 18S RNA by the ∆∆CT method. ## p-Value ≤ 0.01, ### p-Value ≤ 0.001 (comparison between mock siNeg and VEEV siNeg), * p-Value < 0.05, ** p-Value ≤ 0.01, (comparison between VEEV siNeg and VEEV siEGR1), $ p-Value < 0.05, $$ p-Value ≤ 0.01 (comparison between mock siNeg and mock siEGR1).
Figure 3
Figure 3
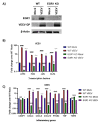
Increased transcription of transcription factors ATF3, FOS, and JUN, as well as inflammatory genes CXCL3 and CXCL8, are at least partially dependent on EGR1 following VEEV infection in EGR1 knockout U87MG cells. (A) U87MG WT or EGR1−/−cells were infected with VEEV TC-83 at an MOI of 5 for 1 h. Lysates were collected at 16h post-infection and Western blot analysis performed for EGR1, VEEV GP, and actin. (B,C) U87MG WT or EGR1−/− cells were infected with VEEV TrD at an MOI of 5 for 1 h. RNA was extracted from samples collected at 16 hpi. Gene expression for transcription factors (B) and inflammatory genes (C) was determined by RT-qPCR using TaqMan assays. Data were normalized to mock-infected cells and 18S RNA by the ∆∆CT method. ### p-Value ≤ 0.001, #### p-Value ≤ 0.0001 (comparison between WT mock and WT VEEV), * p-Value < 0.05, ** p-Value ≤ 0.01, *** p-Value ≤ 0.001, **** p-Value ≤ 0.0001 (comparison between WT VEEV and EGR1 −/− VEEV), $ p-Value < 0.05, $$$ p-Value ≤ 0.001, $$$$ p-Value ≤ 0.0001 (comparison between WT mock and EGR1−/− mock).
Figure 4
Figure 4
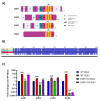
EGR family members are at least partially regulated by EGR1. (A) Schematic of EGR family members gene regions. Figure adapted from [49]. (B) Alignment of EGR family member DNA binding domains. (C) Wildtype or EGR1−/− U87MG cells were infected with VEEV TrD at an MOI of 5 for 1 h. RNA was extracted from samples collected at 16 hpi. Gene expression was determined by RT-qPCR using TaqMan assays. Data were normalized to mock-infected cells and 18S RNA by the ∆∆CT method. #### p-Value ≤ 0.0001 (comparison between WT mock and WT VEEV), *** p-Value ≤ 0.001, **** p-Value ≤ 0.0001 (comparison between WT VEEV and EGR1−/− VEEV), $$ p-Value ≤ 0.01, $$$ p-Value ≤ 0.001, $$$$ p-Value ≤ 0.0001 (comparison between WT mock and EGR1−/− mock).
Figure 5
Figure 5
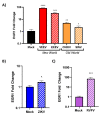
EGR1 is upregulated in VEEV-, EEEV-, SINV-, CHIKV-, ZIKV-, and RVFV-infected cells. WT U87MG cells were seeded at 1 × 10⁵ cells/well. The following day, cells were infected with alphaviruses, including (A) VEEV, EEEV, SINV, or CHIKV, (B) ZIKV, a flavivirus, or (C) RVFV, a phlebovirus, at an MOI of 5 in serum-free media for 1 h. After 1 h incubation, cells were washed 2× with PBS and replenished with fresh serum-free media. Cell lysates were collected 16 hpi and RNA was extracted and normalized to 10 ng/uL. Gene expression was measured using TaqMan assays for EGR1 and 18s. Data were normalized to 18s and mock was set to 1. *—indicates significance as compared to mock, * p-value < 0.05, ** p-value < 0.007, *** p-value < 0.0005, **** p-value < 0.0001.
Figure 6
Figure 6
Loss of EGR1 has minimal impact on VEEV, EEEV, CHIKV, SINV, RVFV, and ZIKV viral titers. WT U87MG or EGR1−/− U87MG cells were seeded at 1 × 10⁵ cells/well. The following day, cells were infected with either (A) VEEV, (B) EEEV, (C) RVFV, (D) SINV, (E) CHIKV, or (F) ZIKV at an MOI 5 in serum-free media for 1 h. After 1 h incubation, cells were washed 2× with PBS and replenished with fresh serum-free media. At 16 hpi, the supernatant was collected, and viral titers were determined via plaque assay. ** p-value: 0.0011 (VEEV); 0.0082 (SINV).
Figure 7
Figure 7
EGR1-dependent gene expression in EEEV-, SINV-, CHIKV-, ZIKV-, and RVFV-infected cells. WT and EGR1−/− U87MG cells were infected with either mock, (A) EEEV, (B) SINV, (C) CHIKV, (D) ZIKV, or (E) RVFV at an MOI of 5 for 1 h. RNA was extracted from samples collected 16 hpi. Gene expression for transcription factors and inflammatory genes was determined by RT-qPCR using TaqMan assays. Data were normalized to mock-infected cells and 18S RNA by the ∆∆CT method. # p-Value < 0.05, ## p-Value ≤ 0.01, ### p-Value ≤ 0.001, #### p-Value ≤ 0.0001 (comparison between WT mock and WT VEEV), * p-Value < 0.05, ** p-Value ≤ 0.01, *** p-Value ≤ 0.001, **** p-Value ≤ 0.0001 (comparison between WT VEEV and EGR1−/− VEEV).
Figure 8
Figure 8
Inhibition of PTGS2 with Celecoxib rescues cells from VEEV-induced cell death but has no effect on viral titers. (A) U87MG cells were treated with ≤200 µM of celecoxib for 24 h. Cell viability was determined using Cell Titer Glo with mock set to 100%. (B) U87MG cells were pre-treated with 25, 12.5, or 6.25 µM of celecoxib or DMSO vehicle control prior to infection with VEEV for 1 h. After 1 h infection, inoculum was removed and washed 2× with PBS prior to treated media being added back to the cells. Viability was determined 24 hpi using Cell Titer Glo with vehicle + mock-infected cells being set to 100%. *** p-Value ≤ 0.0001, ** p-Value ≤ 0.005. Mock treated vs. mock vehicle p-value 0.0005. (C) U87MG cells were pre-treated with 25, 12.5, or 6.25 µM of celecoxib or DMSO vehicle control prior to infection with VEEV for 1 h. After 1 h infection, cells were washed 2× with PBS prior to treated media being added back to cells. Supernatant was collected 16 hpi and viral titers determined via plaque assay.
Figure 9
Figure 9
EGR1 may work directly or indirectly with target genes to induce transcription of inflammatory cytokines and chemokines and apoptotic transcriptional machinery. (A) Overview of proposed direct mechanism of action. Susceptible cells become virally infected, resulting in EGR1 activation and translocation to the nucleus. Once in the nucleus, EGR1 binds directly to promoters of target genes and induces their transcription, thereby contributing to inflammation and cell death associated with viral infection. (B) Overview of proposed indirect mechanism of action. Susceptible cells become virally infected, resulting in EGR1 activation and translocation to the nucleus. Once in the nucleus, EGR1 binds to target genes, such as transcription factor x, resulting in their upregulation. Transcription factor(s) X then binds to promoter regions of inflammatory genes and apoptotic machinery, inducing their transcription and subsequent release of inflammatory cytokines and chemokines, ultimately contributing to neuronal cell death within the brain. Figures were created with BioRender.com.

Similar articles

Cited by

References

    1. Ryman K.D., Klimstra W.B. Host responses to alphavirus infection. Immunol. Rev. 2008;225:27–45. doi: 10.1111/j.1600-065X.2008.00670.x. - DOI - PubMed
    1. Paredes A., Weaver S., Watowich S., Chiu W. Structural biology of old world and new world alphaviruses. Arch. Virol. Suppl. 2005;19:179–185. - PubMed
    1. Azar S.R., Campos R.K., Bergren N.A., Camargos V.N., Rossi S.L. Epidemic Alphaviruses: Ecology, Emergence and Outbreaks. Microorganisms. 2020;8:1167. doi: 10.3390/microorganisms8081167. - DOI - PMC - PubMed
    1. Ronca S.E., Dineley K.T., Paessler S. Neurological Sequelae Resulting from Encephalitic Alphavirus Infection. Front. Microbiol. 2016;7:959. doi: 10.3389/fmicb.2016.00959. - DOI - PMC - PubMed
    1. Baer A., Lundberg L., Swales D., Waybright N., Pinkham C., Dinman J.D., Jacobs J.L., Kehn-Hall K. Venezuelan Equine Encephalitis Virus Induces Apoptosis through the Unfolded Protein Response Activation of EGR1. J. Virol. 2016;90:3558–3572. doi: 10.1128/JVI.02827-15. - DOI - PMC - PubMed

Publication types