. 2022 Jun 3;14(6):1218.
doi: 10.3390/v14061218.

Non-Productive Infection of Glial Cells with SARS-CoV-2 in Hamster Organotypic Cerebellar Slice Cultures

Affiliations

Non-Productive Infection of Glial Cells with SARS-CoV-2 in Hamster Organotypic Cerebellar Slice Cultures

Lise Lamoureux et al. Viruses. .

Abstract

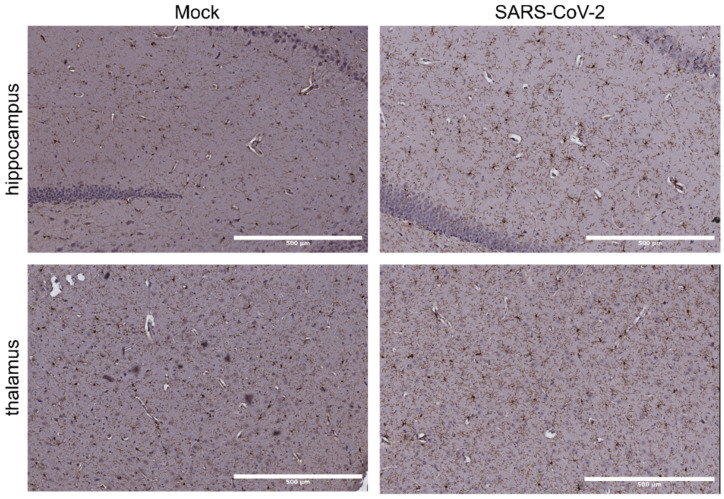
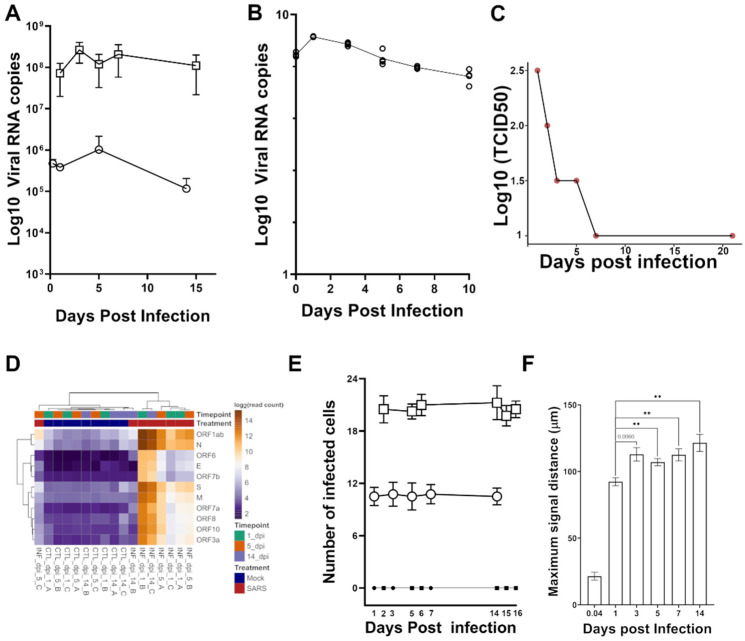
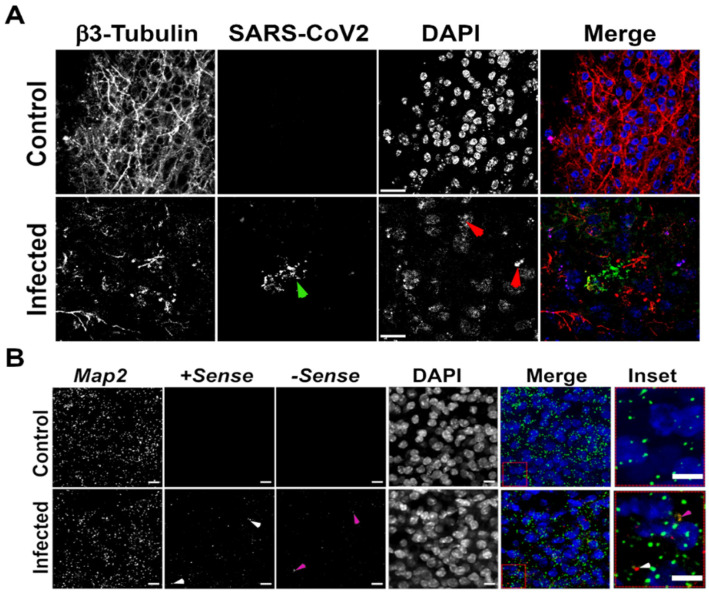
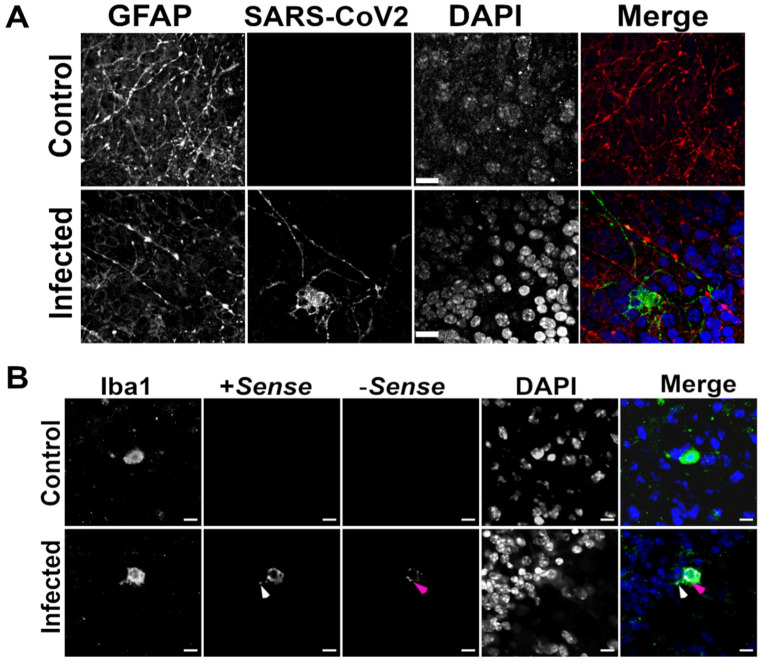
The numerous neurological syndromes associated with COVID-19 implicate an effect of viral pathogenesis on neuronal function, yet reports of direct SARS-CoV-2 infection in the brain are conflicting. We used a well-established organotypic brain slice culture to determine the permissivity of hamster brain tissues to SARS-CoV-2 infection. We found levels of live virus waned after inoculation and observed no evidence of cell-to-cell spread, indicating that SARS-CoV-2 infection was non-productive. Nonetheless, we identified a small number of infected cells with glial phenotypes; however, no evidence of viral infection or replication was observed in neurons. Our data corroborate several clinical studies that have assessed patients with COVID-19 and their association with neurological involvement.

Keywords: COVID-19; SARS-CoV-2; astrocytes; brain; microglia; neuroinflammation; organotypic culture.


Conflict of interest statement

The authors declare no conflict of interest.

Figures

Figure 1
Figure 1
Mild increase in IBA1 staining in the hippocampus and thalamus of SARS-CoV-2-infected hamsters. IHCwith IBA1 and counterstained with hemotoxylin was performed in the hippocampus (top row) and thalamus (bottom row) of brain sections taken from hamsters that were either mock-infected (left column) or infected with SARS-CoV-2 (right column). Microglia in infected tissue, particularly the hippocampal region, show changes in phenotype such as thickening and increased staining of processes, and an increase in staining of the soma of some cells. Microglia remain in a ramified state; activated microglia with amoeboid phenotypes were not observed. Scale bar indicates 500 µm.
Figure 2
Figure 2
SARS-CoV-2 shows negligible infectivity in hamster brain cerebellar slice culture. Viral RNA in (A) lysate or (B) culture medium from cerebellar slice cultures infected with SARS-CoV-2 was quantified using qRT-PCR targeting the nucleocapsid sequence. Either 450 (A; open circles) or 6850 (A; open squares) PFU of SARS-CoV-2 inoculum was used to challenge the cerebellar slice cultures. DPI is indicated on the x-axes and the viral RNA (log10) quantified by qRT-PCR is indicated on the y-axes. Live virus in hamster brain cerebellar slice cultures was quantified (C) following inoculation with SARS-CoV-2 using TCID50 assay. DPI are indicated on the x-axis and the viral titer is indicated on the y-axis. (D) Hierarchical clustering of RNAseq raw read counts mapping to SARS-CoV-2 transcripts were normalized and abundance was calculated as log2 transformed read counts using DESeq2. Bar diagrams depicting (E) the number of cells infected with SARS-CoV-2; circles and squares indicate slices infected (white) with 450 PFU and 6850 PFU respectively as compared to relevant controls (black) and (F) maximum signal distance (in µm) of viral nucleocapsid protein from the centre of the infected cells as visualized by indirect immune fluorescence imaging. The time points are indicated on the x-axis; 0.04 is 1 h post infection. Values are depicted as mean ± SEM; N = 4 ** indicates a statistical significance with a p-value < 0.005; actual p-value (0.006) is indicated otherwise.
Figure 3
Figure 3
SARS-CoV-2 does not infect neurons in a hamster brain cerebellar slice culture. Representative images of hamster brain cerebellar slices labelled to visualize (A) β3-tubulin (red) and SARS-CoV-2 nucleocapsid (green) by indirect immunofluorescence or (B) neuronal (Map2; green) and SARS-CoV-2 markers by RNA ISH. Nuclei were counterstained with DAPI (blue). Merge is a composite of all individual images. Arrowheads identify either viral nucleocapsid protein (green; (A)), +sense (white; (B)) or -sense (magenta; (B)) viral RNA strands indicating areas of active infection and replication respectively. The red arrowheads (A) indicate fragmenting nuclei and blebbing, surrogate markers for apoptosis. Scale bar = 10 βm.
Figure 4
Figure 4
SARS-CoV-2 may infect glial cells in a hamster brain cerebellar slice culture. Representative images of hamster brain cerebellar slices identifying either astrocytic (Gfap (red); (A)) or microglial (Iba1 (green); (B)) markers and SARS-CoV-2 nucleopasid (green; (A)) or +sense (white arrowheads (red); (B)) or -sense (magenta arrowheads (yellow); (B)) viral RNA strands. Nuclei were counterstained with DAPI/ blue; merge depicts a composite image. Scale bar = 10 µm. We also calculated the corrected total intensity of each marker to compensate for background fluorescence (Supplementary Figure S4). Additionally, since both β3-Tubulin and Map2 were cytoskeletal markers, we used NeuN, a nuclear marker for neurons, to prevent unconscious observational bias of the surrogate markers we used. We found no overlap in fluorescence signals from probes identifying SARS-CoV-2 and NeuN. These data further confirm our observation that SARS-CoV-2 does not infect hamster neurons in organotypic cerebellar brain slices.
Figure 5
Figure 5
A limited transcriptional response is observed in hamster brain cerebellar slices infected with SARS-CoV-2. (A) PCA plot of all samples used for gene expression analysis at DPI 1, 5 and 14. (B) Number of differentially expressed genes in cerebellar sections at 1, 5 and 14 DPI. Differentially expressed genes were defined as mean read count >25, absolute value log2 (fold change) > 0.5 and FDR corrected p-value < 0.1. (C) Hierarchical clustering of differentially expressed genes at DPI 1, 5 and 14. Z-scores were calculated from log2 transformed normalized read counts and used for hierarchical clustering. (DI) Enriched BioPlanet2019, WikiPathways 2021 and GO Biological Process 2021 pathways within list of differentially expressed genes. The combined list of differentially expressed genes was supplied to Enrichr for enrichment analysis.

Similar articles

Cited by

References

    1. Iadecola C., Anrather J., Kamel H. Effects of COVID-19 on the nervous system. Cell. 2020;183:16–27.e11. doi: 10.1016/j.cell.2020.08.028. - DOI - PMC - PubMed
    1. Beghi E., Michael M.B.D., Msc E.W., Winkler A.S., Global COVID-19 Neuro Research Coalition. Michael B.D., Solomon T., Westenberg E., Knauss S., Sejvar J., et al. Approaches to understanding COVID-19 and its neurological associations. Ann. Neurol. 2021;89:1059–1067. doi: 10.1002/ana.26076. - DOI - PMC - PubMed
    1. Taquet M., Luciano S., Geddes J.R., Harrison P.J. Bidirectional associations between COVID-19 and psychiatric disorder: Retrospective cohort studies of 62 354 COVID-19 cases in the USA. Lancet Psychiatry. 2021;8:130–140. doi: 10.1016/S2215-0366(20)30462-4. - DOI - PMC - PubMed
    1. Raman B., Cassar M.P., Tunnicliffe E.M., Filippini N., Griffanti L., Alfaro-Almagro F., Okell T., Sheerin F., Xie C., Mahmod M., et al. Medium-term effects of SARS-CoV-2 infection on multiple vital organs, exercise capacity, cognition, quality of life and mental health, post-hospital discharge. eClinicalMedicine. 2021;31:100683. doi: 10.1016/j.eclinm.2020.100683. - DOI - PMC - PubMed
    1. Vindegaard N., Benros M.E. COVID-19 pandemic and mental health consequences: Systematic review of the current evidence. Brain Behav. Immun. 2020;89:531–542. doi: 10.1016/j.bbi.2020.05.048. - DOI - PMC - PubMed

Publication types