. 2022 Jun 10;14(6):1265.
doi: 10.3390/v14061265.

High and Sustained Ex Vivo Frequency but Altered Phenotype of SARS-CoV-2-Specific CD4+ T-Cells in an Anti-CD20-Treated Patient with Prolonged COVID-19

Affiliations

High and Sustained Ex Vivo Frequency but Altered Phenotype of SARS-CoV-2-Specific CD4+ T-Cells in an Anti-CD20-Treated Patient with Prolonged COVID-19

Leon Cords et al. Viruses. .

Abstract

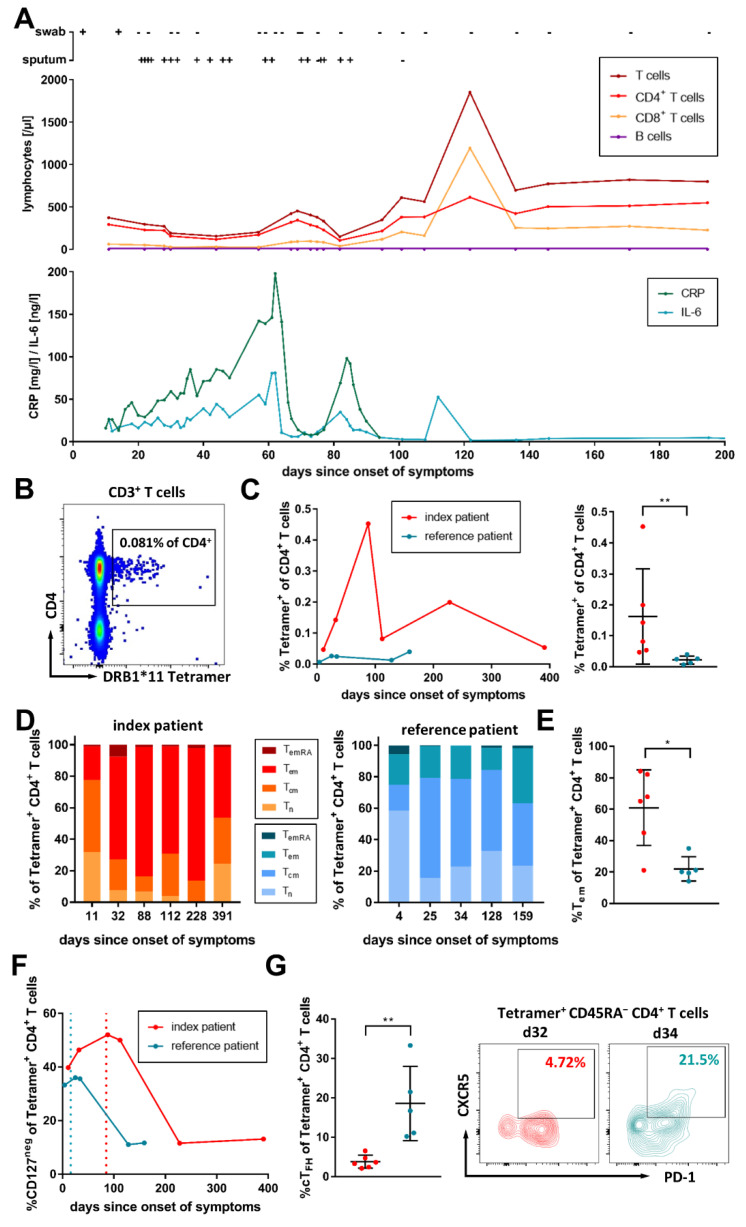
Here, we longitudinally assessed the ex vivo frequency and phenotype of SARS-CoV-2 membrane protein (aa145-164) epitope-specific CD4+ T-cells of an anti-CD20-treated patient with prolonged viral positivity in direct comparison to an immunocompetent patient through an MHC class II DRB1*11:01 Tetramer analysis. We detected a high and stable SARS-CoV-2 membrane-specific CD4+ T-cell response in both patients, with higher frequencies of virus-specific CD4+ T-cells in the B-cell-depleted patient. However, we found an altered virus-specific CD4+ T-cell memory phenotype in the B-cell-depleted patient that was skewed towards late differentiated memory T-cells, as well as reduced frequencies of SARS-CoV-2-specific CD4+ T-cells with CD45RA- CXCR5+ PD-1+ circulating T follicular helper cell (cTFH) phenotype. Furthermore, we observed a delayed contraction of CD127- virus-specific effector cells. The expression of the co-inhibitory receptors TIGIT and LAG-3 fluctuated on the virus-specific CD4+ T-cells of the patient, but were associated with the inflammation markers IL-6 and CRP. Our findings indicate that, despite B-cell depletion and a lack of B-cell-T-cell interaction, a robust virus-specific CD4+ T-cell response can be primed that helps to control the viral replication, but which is not sufficient to fully abrogate the infection.

Keywords: CD39; CD4+ T-cells; CD73; COVID-19; MHC class II Tetramer; PD-1; SARS-CoV-2; T-cell memory; TIGIT; anti-CD20 therapy.


Conflict of interest statement

The authors declare no conflict of interest.

Figures

Figure 1
Figure 1
Clinical course and kinetics of Tetramer+ SARS-CoV-2-specific CD4+ T-cells. (A) PCR results for SARS-CoV-2 from nasopharyngeal swabs and sputum are shown as “+” for a positive and “−“ for a negative test result. Overview of the lymphocytes (B- and T-cells) and inflammatory blood markers CRP [mg/L] and IL-6 [ng/L] during the infection of the index patient are depicted. (B) Representative flow cytometry plot of DRB1*11 Tetramer staining of PBMC from the index patient on day 112 after the onset of symptoms. Shown are living CD3+ T-cells. (C) The frequencies of Tetramer+ CD4+ T-cells in the peripheral blood of the index patient (red) and a reference patient (blue) are depicted longitudinally (left), and pooled for each patient (right). (D) Comparison of the proportions of naïve (Tn; CCR7+ CD45RA+), central memory (Tcm; CCR7+ CD45RA), effector memory (Tem; CCR7 CD45RA), and late effector memory (TemRA; CCR7 CD45RA+) T-cells between the index patient (red) and the reference patient (blue) among the SARS-CoV-2-specific T-cells. (E) The index patient showed cumulatively increased frequencies of SARS-CoV-2-specific CD4+ T-cells with a Tem phenotype. (F) Development of IL7Rα (CD127) negative SARS-CoV-2-specific effector CD4+ T-cells of the index (red) and the reference patient (blue). Dotted lines indicate the last positive PCR result. (G) The index patient showed cumulatively reduced frequencies of SARS-CoV-2-specific CD4+ T-cells with a circulating T follicular helper cell (cTFH) phenotype. Shown are representative flow cytometry plots for both patients from day 32 (index patient; red) or day 34 (reference patient; blue). In cumulative analyses, data are depicted as mean with SD, and for statistical testing, a Mann–Whitney test was performed. Results were considered statistically significant if p < 0.05. Levels of significance are translated to asterisks as follows: * p < 0.05; ** p < 0.01.
Figure 2
Figure 2
Co-inhibitory receptors on SARS-CoV-2-specific CD4+ T-cells. Expression frequencies of PD-1, LAG-3, and TIGIT on SARS-CoV-2-specific CD4+ T-cells of the index patient (red) and the reference patient (blue), as well as the respective relevant correlations, are depicted. (A) PD-1 expression was elevated on virus-specific CD4+ T-cells of the index patient, and correlated with CD127 expression. (B) LAG-3 expression on virus-specific CD4+ T-cells was elevated in early infection, and was associated with plasma CRP levels in the index patient (r = 0.945; p = 0.055). (C) TIGIT expression was elevated on virus-specific CD4+ T-cells of the reference patient, and significantly correlated with plasma IL-6 levels in the index patient (r = 0.997; p = 0.003). In correlation analyses, each dot represents an individual time point, and values are given as Pearsons’s r. Results were considered statistically significant if p < 0.05. Levels of significance are translated to asterisks as follows: * p < 0.05; ** p < 0.01.
Figure 3
Figure 3
Ectonucleotidases CD39 and CD73 on SARS-CoV-2-specific CD4+ T-cells. Exemplary flow cytometry plots of the index patient (day 112) for expression of CD39 (A) and CD73 (B) on bulk and virus-specific CD4+ T-cells. Shown are living CD3+ CD4+ T-cells. (C) Longitudinal assessment of CD39 expression on bulk and virus-specific CD4+ T-cells of the index patient (left) and the reference patient (right). (D) Longitudinal assessment of CD73 expression on bulk and virus-specific CD4+ T-cells of the index patient (left) and the reference patient (right). (E) Representative flow cytometry plot of the reference patient, with backgating of the virus-specific CD4+ T-cells illustrating the CD39/CD37 expression pattern. (F) Correlation of CD39+ virus-specific T-cells with overall Tetramer+ CD4+ T-cells (r = 0.695; p = 0.018) and PD-1 expression frequency (r = 0.725; p = 0.012). In correlation analyses, each dot represents an individual time point, and values are given as Pearsons’s r. Results were considered statistically significant if p < 0.05. Levels of significance are translated to asterisks as follows: * p < 0.05; ** p < 0.01.

Similar articles

Cited by

References

    1. Zheng Z., Peng F., Xu B., Zhao J., Liu H., Peng J., Li Q., Jiang C., Zhou Y., Liu S., et al. Risk factors of critical & mortal COVID-19 cases: A systematic literature review and meta-analysis. J. Infect. 2020;81:e16–e25. doi: 10.1016/j.jinf.2020.04.021. - DOI - PMC - PubMed
    1. Andersen K.M., Bates B.A., Rashidi E.S., Olex A.L., Mannon R.B., Patel R.C., Singh J., Sun J., Auwaerter P.G., Ng D.K., et al. Long-term use of immunosuppressive medicines and in-hospital COVID-19 outcomes: A retrospective cohort study using data from the National COVID Cohort Collaborative. Lancet Rheumatol. 2022;4:e33–e41. doi: 10.1016/S2665-9913(21)00325-8. - DOI - PMC - PubMed
    1. Choi B., Choudhary M.C., Regan J., Sparks J.A., Padera R.F., Qiu X., Solomon I.H., Kuo H.H., Boucau J., Bowman K., et al. Persistence and Evolution of SARS-CoV-2 in an Immunocompromised Host. N. Engl. J. Med. 2020;383:2291–2293. doi: 10.1056/NEJMc2031364. - DOI - PMC - PubMed
    1. Kemp S.A., Collier D.A., Datir R.P., Ferreira I., Gayed S., Jahun A., Hosmillo M., Rees-Spear C., Mlcochova P., Lumb I.U., et al. SARS-CoV-2 evolution during treatment of chronic infection. Nature. 2021;592:277–282. doi: 10.1038/s41586-021-03291-y. - DOI - PMC - PubMed
    1. Weigang S., Fuchs J., Zimmer G., Schnepf D., Kern L., Beer J., Luxenburger H., Ankerhold J., Falcone V., Kemming J., et al. Within-host evolution of SARS-CoV-2 in an immunosuppressed COVID-19 patient as a source of immune escape variants. Nat. Commun. 2021;12:6405. doi: 10.1038/s41467-021-26602-3. - DOI - PMC - PubMed

Publication types