. 2022 Jun 15;14(6):1313.
doi: 10.3390/v14061313.

Immunometabolic Reprogramming in Response to HIV Infection Is Not Fully Normalized by Suppressive Antiretroviral Therapy

Affiliations

Immunometabolic Reprogramming in Response to HIV Infection Is Not Fully Normalized by Suppressive Antiretroviral Therapy

Pragney Deme et al. Viruses. .

Abstract

Background: HIV infection results in immunometabolic reprogramming. While we are beginning to understand how this metabolic reprogramming regulates the immune response to HIV infection, we do not currently understand the impact of ART on immunometabolism in people with HIV (PWH).

Methods: Serum obtained from HIV-infected (n = 278) and geographically matched HIV seronegative control subjects (n = 300) from Rakai Uganda were used in this study. Serum was obtained before and ~2 years following the initiation of ART from HIV-infected individuals. We conducted metabolomics profiling of the serum and focused our analysis on metabolic substrates and pathways assocaited with immunometabolism.

Results: HIV infection was associated with metabolic adaptations that implicated hyperactive glycolysis, enhanced formation of lactate, increased activity of the pentose phosphate pathway (PPP), decreased β-oxidation of long-chain fatty acids, increased utilization of medium-chain fatty acids, and enhanced amino acid catabolism. Following ART, serum levels of ketone bodies, carnitine, and amino acid metabolism were normalized, however glycolysis, PPP, lactate production, and β-oxidation of long-chain fatty acids remained abnormal.

Conclusion: Our findings suggest that HIV infection is associated with an increased immunometabolic demand that is satisfied through the utilization of alternative energetic substrates, including fatty acids and amino acids. ART alone was insufficient to completely restore this metabolic reprogramming to HIV infection, suggesting that a sustained impairment of immunometabolism may contribute to chronic immune activation and comorbid conditions in virally suppressed PWH.

Keywords: HIV infection; amino acid catabolism; antiretroviral therapy; comorbid conditions; fatty acid oxidation; glucose oxidation; immunometabolism.


Conflict of interest statement

The authors declare no conflict to interest.

Figures

Figure 1
Figure 1
Glycolysis, PPP, and Lactate metabolism. Serum levels of (A) glucose, (B) glucose 6-phosphate, (C,D) PPP products, (E) pyruvate, and (F) lactate in PWH before and after ART compared with HIVSN. Scatter plots show mean and significance notations of adjusted p-values (95% CI) at * = p < 0.05, ** = p < 0.01, *** = p < 0.001, and **** = p < 0.0001. For multiple group comparisons, Brown–Forsythe and Welch ANOVA tests were performed in combination with Games-Howell multiple comparisons correction for a sample size >50 with a 95% confidence interval. (G) Diagrammatic representation of metabolic pathways modified by HIV and ART. In pre-ART HIV blue text indicates pathway name, black text indicates no change, red text indicates significantly increased levels, and aqua text indicates significantly decreased levels compared with HIVSN. Solid line up-arrows (↑) indicate significantly increased and solid line down-arrows (↓) indicate significantly decreased levels following ART, compared with pre-ART HIV.
Figure 1
Figure 1
Glycolysis, PPP, and Lactate metabolism. Serum levels of (A) glucose, (B) glucose 6-phosphate, (C,D) PPP products, (E) pyruvate, and (F) lactate in PWH before and after ART compared with HIVSN. Scatter plots show mean and significance notations of adjusted p-values (95% CI) at * = p < 0.05, ** = p < 0.01, *** = p < 0.001, and **** = p < 0.0001. For multiple group comparisons, Brown–Forsythe and Welch ANOVA tests were performed in combination with Games-Howell multiple comparisons correction for a sample size >50 with a 95% confidence interval. (G) Diagrammatic representation of metabolic pathways modified by HIV and ART. In pre-ART HIV blue text indicates pathway name, black text indicates no change, red text indicates significantly increased levels, and aqua text indicates significantly decreased levels compared with HIVSN. Solid line up-arrows (↑) indicate significantly increased and solid line down-arrows (↓) indicate significantly decreased levels following ART, compared with pre-ART HIV.
Figure 2
Figure 2
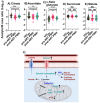
TCA cycle intermediates. The levels of (A) citrate, (B) aconitate, (C) α-KG, (D) succinate, and (E) malate in PWH before and after ART compared with HIVSN. Scatter plots show mean and significance notations of adjusted p-values (95% CI) at ** = p < 0.01, *** = p < 0.001, and **** = p < 0.0001. For multiple group comparisons, Brown–Forsythe and Welch ANOVA tests were performed in combination with Games-Howell multiple comparisons correction for sample sizes >50 with a 95% confidence interval. (F) Diagrammatic representation of metabolic pathways modified by HIV and ART. In pre-ART HIV blue text indicates pathway name, black text indicates no change, red text indicates significantly increased levels, and aqua text indicates significantly decreased levels compared with HIVSN. Solid line up-arrows (↑) indicate significantly increased and solid line down-arrows (↓) indicate significantly decreased levels following ART compared with pre-ART HIV.
Figure 3
Figure 3
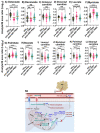
Fatty acid β-oxidation, fatty acids, and their carnitines. The levels of (A) octanoate, (B) decanoate, (C) octanoylcarnitine, (D) decanoylcarnitine, (E) laurate, (F) myristate, (G) palmitate, (H) stearate, (I) lauroylcarnitine, (J) myristoylcarnitine, (K) palmitoylcarnitine, and (L) stearoylcarnitine in PWH before and after ART compared with HIVSN. Scatter plots show the mean and significance notations of adjusted p-values (95% CI) at * = p < 0.05, ** = p < 0.01, *** = p < 0.001, and **** = p < 0.0001. For multiple group comparisons, Brown–Forsythe and Welch ANOVA tests were performed in combination with Games-Howell multiple comparisons correction for sample sizes >50 with a 95% confidence interval. (M) Diagrammatic representation of metabolic pathways modified by HIV and ART. In pre-ART HIV blue text indicates CoA conjugate, enzyme, and pathway names; black text indicates no change; red text indicates significantly increased levels; and aqua text indicates significantly decreased levels compared with HIVSN. Solid line up-arrows (↑) indicate significantly increased and solid line down-arrows (↓) indicate significantly decreased levels following ART compared with pre-ART HIV.
Figure 4
Figure 4
Long-chain fatty acylcarnitine and their corresponding fatty acid ratios. The ratios of (A) lauroylcarnitine to laurate, (B) myristoylcarnitine to myristate, (C) palmitoylcarnitine to palmitate, and (D) stearoylcarnitine to stearate in PWH before and after ART compared with HIVSN. Scatter plots show mean and significance notations of adjusted p-values (95% CI) at **** = p < 0.0001. For multiple group comparisons, Brown–Forsythe and Welch ANOVA tests were performed in combination with Games-Howell multiple comparisons correction for sample sizes >50 with a 95% confidence interval.
Figure 5
Figure 5
Amino acid oxidative catabolism. The levels of (A) lysine, (B) methionine, (C) leucine, (D) isoleucine, (E) valine, (F) glutamate, (G) glutamine, and (H) alanine in PWH before and after ART compared with HIVSN. Scatter plots show mean and significance notations of adjusted p-values (95% CI) at * = p < 0.05, *** = p < 0.001, and **** = p < 0.0001. For multiple group comparisons, Brown–Forsythe and Welch ANOVA tests were performed in combination with Games-Howell multiple comparisons correction for sample sizes >50 with a 95% confidence interval. (I) Diagrammatic representation of metabolic pathways modified by HIV and ART. In pre-ART HIV blue text indicates CoA conjugate, enzyme, and pathway names; black text indicates no change; red text indicates significantly increased levels; aqua text indicates significantly decreased levels, compared with HIVSN. Solid line up-arrows (↑) indicate significantly increased and solid line down-arrows (↓) indicate significantly decreased levels following ART compared with pre-ART HIV.
Figure 6
Figure 6
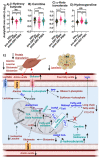
β-Hydroxybutyrate and amino acid derivative metabolism. The levels of (A) β-hydroxybutyrate, (B) carnitine, (C) α-ketoisovalerate, and (D) hydroxyproline in PWH before and after ART compared with HIVSN. Scatter plots show mean and significance notations of adjusted p-values at * = p < 0.05, *** = p < 0.001, and **** = p < 0.0001. For multiple group comparisons, Brown–Forsythe and Welch ANOVA tests were performed in combination with Games-Howell multiple comparisons correction for sample sizes >50 with a 95% confidence interval. (E) Diagrammatic representation of metabolic pathways modified by HIV and ART. In pre-ART HIV, blue indicates CoA conjugate, enzyme, and pathway names; black indicates no change; red indicates significantly increased levels; and aqua indicates significantly decreased levels, compared with HIVSN. Solid line up-arrows (↑) indicate significantly increased and solid line down-arrows (↓) indicate significantly decreased levels following ART compared with pre-ART HIV.
Figure 7
Figure 7
Associations between serum metabolites, demographics, and clinical markers in PWH. Heatmap visualizations of the correlations between bioenergetics substrates and age, gender, biomarkers of liver function (ALT and AST), and biomarkers of HIV disease status (CD4+ T-cell count and HIV viral load) among PWH (A) before ART and (G) after ART. Numbers in the heatmap cells are Pearson’s correlation coefficient R-values. Blue represents positive correlations and red represents negative correlations. Linear regression graphs between significantly associated covariates. (B) Glucose vs. CD4 (0.46), (C) G6P vs. CD4 (0.47), (D) citrate vs. CD4 (0.51), (E) α-KG vs. viral load (0.53), and (F) CD4 vs viral load (−0.50) in pre-ART PWH. (H) G.6P vs. CD4 (0.47), (I) lactate vs. CD4 (−0.52), (J) citrate vs. CD4 (0.58), (K) aconitate vs. CD4 (0.56), and (L) succinate vs. CD4 (0.61) in post-ART PWH.
Figure 8
Figure 8
Associations between serum metabolites, demographics, and clinical markers in PWH. Heatmap visualizations of the correlations between FAO metabolic substrates and age, gender, biomarkers of liver function (ALT and AST), and biomarkers of HIV disease status (CD4+ T-cell count and HIV viral load) among PWH (A) before ART and (H) after ART. Numbers in the heatmap cells are Pearson’s correlation coefficient R-values. Blue represents positive correlations and red represents negative correlations. Linear regression graphs between significantly associated covariates. (B) myristate vs. viral load (r = 0.62), (C) palmitate vs. viral load (r = 0.46), (D) stearate vs. viral load (r = 0.54), (E) myristoylcarnitine vs. viral load (r = −0.50), (F) palmitoylcarnitine (r = −0.39), and (G) stearoylcarnitine vs. viral load (r = −0.48) in pre-ART PWH.
Figure 9
Figure 9
Associations between serum metabolites, demographics, and clinical markers in PWH. Heatmap visualizations of the correlations between AA oxidative catabolism substrates and age, gender, biomarkers of liver function (ALT and AST), and biomarkers of HIV disease status (CD4+ T-cell count and HIV viral load) among PWH (A) before ART and (H) after ART. Numbers in the heatmap cells are Pearson’s correlation coefficient R-values. Blue represents positive correlations and red represents negative correlations. Linear regression graphs between significantly associated covariates. (B) Carnitine vs. viral load (r = −0.7), (C) leucine vs. viral load (r = 0.56), (D) glutamine vs. viral load (r = 0.59), (E) glutamate vs. viral load (r = 0.55), (F) methionine vs. CD4 (r = 0.65), and (G) isoleucine vs. CD4 (r = 0.71) in pre-ART PWH. (I) Lysine vs. CD4 (r = 0.51) and (J) isoleucine vs. CD4 (r = 0.49) in post-ART PWH.

References

    1. Saez-Cirion A., Sereti I. Immunometabolism and HIV-1 pathogenesis: Food for thought. Nat. Rev. Immunol. 2021;21:5–19. doi: 10.1038/s41577-020-0381-7. - DOI - PubMed
    1. O’Neill L.A.J., Kishton R.J., Rathmell J. A guide to immunometabolism for immunologists. Nat. Rev. Immunol. 2016;16:553–565. doi: 10.1038/nri.2016.70. - DOI - PMC - PubMed
    1. Chapman N.M., Boothby M.R., Chi H. Metabolic coordination of T cell quiescence and activation. Nat. Rev. Immunol. 2020;20:55–70. doi: 10.1038/s41577-019-0203-y. - DOI - PubMed
    1. Herbel C., Patsoukis N., Bardhan K., Seth P., Weaver J.D., Boussiotis V.A. Clinical significance of T cell metabolic reprogramming in cancer. Clin. Transl. Med. 2016;5:29. doi: 10.1186/s40169-016-0110-9. - DOI - PMC - PubMed
    1. Valle-Casuso J.C., Angin M., Volant S., Passaes C., Monceaux V., Mikhailova A., Bourdic K., Avettand-Fenoel V., Boufassa F., Sitbon M., et al. Cellular Metabolism Is a Major Determinant of HIV-1 Reservoir Seeding in CD4(+) T Cells and Offers an Opportunity to Tackle Infection. Cell Metab. 2019;29:611–626.e5. doi: 10.1016/j.cmet.2018.11.015. - DOI - PubMed

Publication types