. 2022 Jan;1(1):28-44.
doi: 10.1038/s44161-021-00002-8. Epub 2021 Dec 23.

Bone marrow endothelial dysfunction promotes myeloid cell expansion in cardiovascular disease

Affiliations

Bone marrow endothelial dysfunction promotes myeloid cell expansion in cardiovascular disease

David Rohde et al. Nat Cardiovasc Res. 2022 Jan.

Abstract

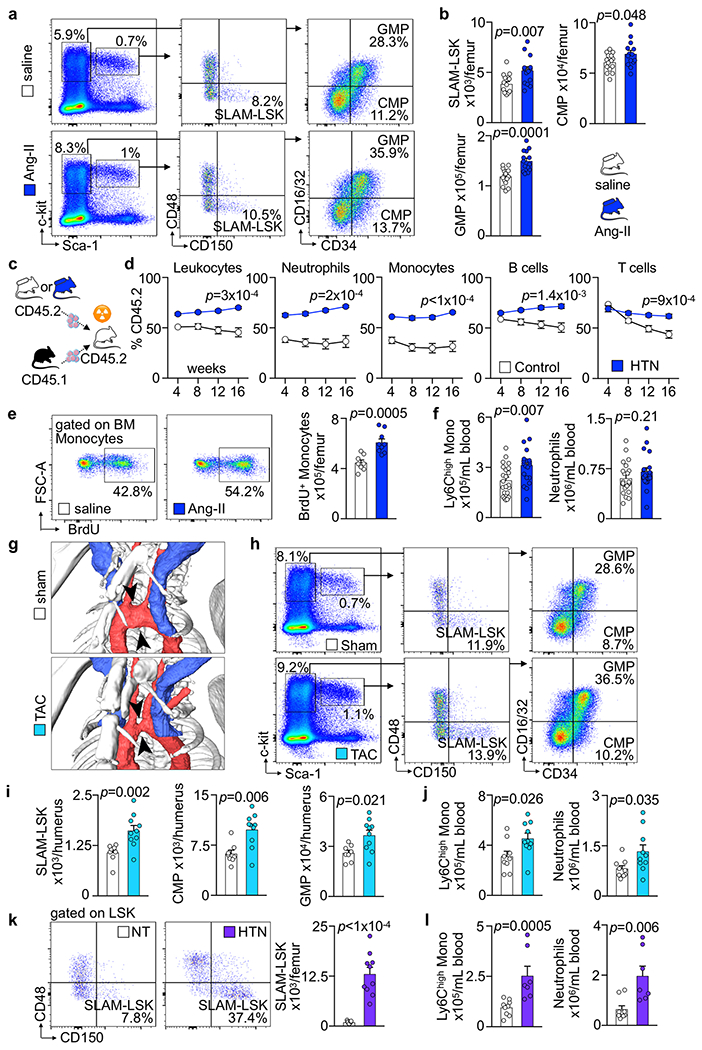
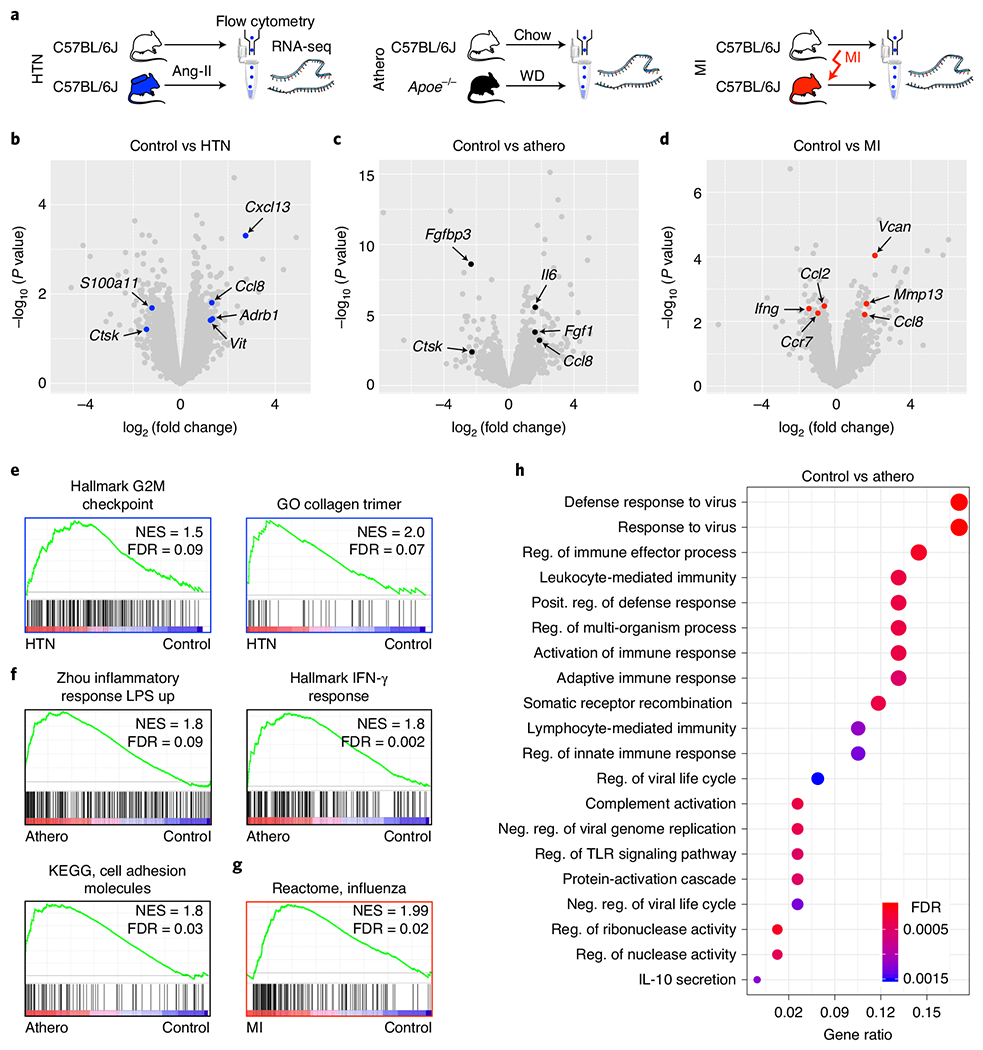
Abnormal hematopoiesis advances cardiovascular disease by generating excess inflammatory leukocytes that attack the arteries and the heart. The bone marrow niche regulates hematopoietic stem cell proliferation and hence the systemic leukocyte pool, but whether cardiovascular disease affects the hematopoietic organ's microvasculature is unknown. Here we show that hypertension, atherosclerosis and myocardial infarction (MI) instigate endothelial dysfunction, leakage, vascular fibrosis and angiogenesis in the bone marrow, altogether leading to overproduction of inflammatory myeloid cells and systemic leukocytosis. Limiting angiogenesis with endothelial deletion of Vegfr2 (encoding vascular endothelial growth factor (VEGF) receptor 2) curbed emergency hematopoiesis after MI. We noted that bone marrow endothelial cells assumed inflammatory transcriptional phenotypes in all examined stages of cardiovascular disease. Endothelial deletion of Il6 or Vcan (encoding versican), genes shown to be highly expressed in mice with atherosclerosis or MI, reduced hematopoiesis and systemic myeloid cell numbers in these conditions. Our findings establish that cardiovascular disease remodels the vascular bone marrow niche, stimulating hematopoiesis and production of inflammatory leukocytes.


Figures

Extended Data Fig. 1 |
Extended Data Fig. 1 |. Arterial hypertension activates murine hematopoiesis.
a, b, Flow plots (a) and numbers (b) of SLAM-LSK, CMP and GMP per femur in mice with saline or Angiotensin II (Ang-II) minipumps (saline n=15 mice, Ang-II n=14, two-tailed Welch’s t-test). c, Experimental outline for (d). 5×10⁵ bone marrow mononuclear cells (BMNC) were isolated from wild type mice (CD45.2) treated with saline or Angiotensin II (Ang-II) minipumps for 8 weeks and mixed with equal numbers of cells isolated from naive CD45.1 mice before transplantation into lethally irradiated CD45.2 recipients. d, Blood leukocyte chimerism after bone marrow transplantation (n=10 recipient mice per group, two-tailed Welch’s t-test for %CD45.2 in week 16). e, Flow plots and quantification of BrdU+ bone marrow monocytes (saline n=8 mice, Ang-II n=9, two-tailed Welch’s t-test). f, Ly6Chigh monocytes and neutrophil numbers in the blood (saline n=22, Ang-II n=20, two-tailed Welch’s t-test). g, In vivo 3D computed tomography (CT) angiography. Arrowheads indicate transverse aortic constriction (TAC). h, i, Flow plots (h) and quantification (i) of SLAM-LSK, CMP and GMP in the right hypertensive humerus of sham- or TAC-operated animals 4 weeks after surgery (sham n=8 mice, TAC n=10, two-tailed Mann-Whitney test). j, Ly6Chigh monocytes and neutrophils in blood (sham n=9, TAC n=10, two-tailed Welch’s t-test). k, Flow plots and quantification of SLAM-LSK in the femur of normotensive BPN/3J (NT) or hypertensive BPH/2J (HT) mice (NT n=13, HT n=10, two-tailed Welch’s t-test). l, Enumeration of blood Ly6Chigh monocytes and neutrophils (NT n=9, HT n=7, two-tailed Mann-Whitney test). Data are displayed as mean±SEM.
Extended Data Fig. 2 |
Extended Data Fig. 2 |. Bone marrow niche factor expression in mice with arterial hypertension and atherosclerosis.
a, Quantification of niche factor expression in whole bone marrow of mice 2 weeks after initiating Ang-II treatment or starting atherogenic diet in Apoe−/− mice (saline n=11 mice, Ang-II n=11, wild type n=8, Apoe−/− n=8, two-tailed Welch’s t-test). b, Quantification of niche factor expression in whole bone marrow of mice 8 weeks after initiating Ang-II treatment or starting atherogenic diet in Apoe−/− mice (n=7 mice per group, two-tailed Mann-Whitney test). Data are displayed as mean±SEM.
Extended Data Fig. 3 |
Extended Data Fig. 3 |. Cardiovascular disease-induced structural changes in bone marrow vasculature.
a, b, Immunohistochemical staining for collagen III (a) and quantification of collagen I (Coll-I) and collagen III (Coll-III) (b) in hypertensive Ang-II-treated mice (Coll-I: saline n=15, Ang-II n=18; Coll-III: saline n=15, Ang-II n=16; two-tailed Welch’s t-test). c, Representative confocal immunofluorescence microcopy (tile scans) displaying the distribution of CD31+Sca-1+ blood vessels across the distal femoral bone marrow of naive controls, mice with Angiotensin II induced arterial hypertension (HTN), atherosclerotic Apoe−/− mice on Western diet (Athero), and mice 6 days after myocardial infarction (MI).d, Quantification of blood vessel area (n=6 fields of view from n=6 controls and n=4 HTN/Athero/MI mice, one-way ANOVA with Dunnett’s T3 post-test).e, CD31 immunohistochemistry obtained in M. quadriceps femoris from naive controls, mice with Angiotensin II-induced arterial hypertension (Ang-II) and mice on day 6 after MI. Arrowheads indicate CD31+ capillaries. g, Flow plots and quantification of endothelial cells in the M. quadriceps femoris of controls and mice 6 days post myocardial infarction (n=8 mice per group, two-tailed Welch’s t-test). h, Quantification of endothelial cells in the spleen of WT and Apoe−/− mice with atherosclerosis by flow cytometry (n=10 WT mice, n=8 Apoe−/−, two-tailed Welch’s t-test). Data are displayed as mean±SEM.
Extended Data Fig. 4 |
Extended Data Fig. 4 |. Bone marrow angiogenesis in response to myocardial infarction.
a, Experimental outline. b, Image of the heart’s infarct border zone showing the formation of new ZsGreen+ blood vessels after MI (n=3 animals). c, Serial intravital immunofluorescence imaging of Tamoxifen-treated AplnCreER;Rosa26ZsGreen/+ mice 1 day before and 6 days after MI, showing newly formed ZsGreen-labelled blood vessels (arrows; n=3 animals per group). d, Images of the femur 6 days after MI, showing CD31+Sca-1+ vasculature, newly formed ZsGreen+ blood vessels and CD11b+ myeloid cells (n=5 animals). e, Distances from leukocyte-containing CD11b+ pixels to CD31+Sca-1+ and to newly formed ZsGreen+ vasculature in femora of control and mice after MI (n=17 regions of n=5 animals 6 days post MI, multiple two-tailed t-tests). f, In vivo calvarial bone marrow imaging after transplantation of DiD-labelled hematopoietic progenitor cells (LSK, Lin Sca-1+ c-kit+) in Tamoxifen-treated AplnCreER;Rosa26ZsGreen/+ mice (naive controls and day 6 after MI). Circles indicate individual DiD-labelled cells (n=3 animals per group). g, Mean target-to-background ratios (TBR) of individual DiD-labelled cells at a distance of either <40μm or >40μm to the closest ZsGreen-labelled new blood vessel in controls and mice after MI (control <40μm: n=92 cells analyzed; control >40μm: n=163; MI <40μm: n=98; MI >40μm: n=90; n=3 mice per group; two-way ANOVA with Sidak’s post-test). Data are displayed as mean±SEM.
Extended Data Fig. 5 |
Extended Data Fig. 5 |. Bone marrow stroma cell composition, vascular leakage, blood flow, and endothelial function in cardiovascular disease.
a, Flow plots showing the gating strategy for bone marrow mesenchymal stromal cells (MSC) and fibroblasts (Fibro). b, Flow cytometry enumeration of bone marrow MSC and fibroblasts (n=6 control mice, n=4 Ang-II induced hypertension (HTN), n=5 Apoe−/− with atherosclerosis (Athero) and MI, two-tailed Kruskal-Wallis test). c, Quantification of vascular albumin leakage for each time frame acquired by intravital microscopy of the skull bone marrow (n=7 wild type control animals, n=6 Angiotensin II (HTN), n=5 Apoe−/− (Athero), n=6 controls for myocardial infarction (MI), n=5 MI). d, Mean blood flow velocity in bone marrow arterioles at baseline (n=8 controls, n=8 HTN, n=6 Athero, n=8 controls for MI, n=12 MI, two-tailed Mann-Whitney test). e, Cardiac output in controls and mice 3 weeks after MI. Stroke volumes were measured by magnetic resonance imaging (n=6 controls, n=8 MI mice, two-tailed Welch’s t test). f, Quantification of nitric oxide (NO) in bone marrow endothelial cells by flow cytometry (n=6 saline control, n=5 Ang-II (HTN); n=6 wild type controls, n=6 Apoe−/− (Athero); n=8 controls, n=6 MI day 2; two-tailed Mann-Whitney test). Data are displayed as mean±SEM.
Extended Data Fig. 6 |
Extended Data Fig. 6 |. Endothelial Vegf receptor 2 (Vegfr2) signaling in myocardial infarction.
a, Vegf in blood plasma of controls and 3 days post myocardial infarction (MI) by ELISA (control n=12, MI n=13, two-tailed Welch’s t-test). b-e, Blood leukocyte (b), bone marrow HSPC numbers (c, d), and proliferation (e) obtained in naive Cdh5CreERT2 and Cdh5CreERT2;Kdrfl/fl mice. Both groups were treated with Tamoxifen (B, n=8 mice per group; C-E, n=6 mice per group; two-tailed Mann-Whitney test). f, Experimental outline. Bone marrow mononuclear cells (BMNC) were isolated from Vav1Cre and Vav1Cre;Kdrf/fl mice and transplanted into lethally irradiated wild type recipients. 8 weeks after bone marrow transplantation (BMT), baseline blood data were obtained by flow cytometry. Both groups were then subjected to MI.g, Blood monocyte and neutrophil numbers 8 weeks post BMT (n=13 Vav1Cre recipients, n=15 Vav1Cre;Kdrf/fl recipients, two-tailed Welch’s t-test). h, Blood myeloid cell numbers 3 days post MI (n=8 mice per group, two-tailed Welch’s t-test). i, j, Bone marrow Lin Sca-1+ c-kit+ (LSK), common myeloid progenitor (CMP) and granulocyte/monocyte progenitor (GMP) numbers (i) (n=8 Vav1Cre recipients, n=7 Vav1Cre;Kdrfl/fl recipients, two-tailed Mann-Whitney test) and proliferation (j) 3 days post MI (n=6 mice per group, two-tailed Mann-Whitney test). k, Image and analysis of colony forming units (CFU) for hematopoietic progenitor cells in blood taken 3 days after MI (n=6 mice pre group, two-tailed Mann-Whitney test). l, Cxcl12 expression in flow-sorted bone marrow endothelial cells on day 2 after MI (n=7 Cdh5CreERT2, n=10 Cdh5CreERT2;Kdrf/fl, two-tailed Mann-Whitney test). m, Relative expression of Vegfa in flow sorted BMEC isolated from Cdh5CreERT2 and Cdh5CreERT2;Kdrf/fl mice 3 days post MI by qPCR (n=4 mice per group, two-tailed Mann-Whitney test). n, Vegfa expression in different organs in controls and 48hrs post MI (n=5 mice per group, individual two-tailed Mann-Whitney tests comparing control and MI for each organ). o, mRNA levels of Vegfa (in relation to Gapdh) in FACS-isolated bone marrow cell populations from controls and mice 48hrs after MI (n=5 mice per group, individual two-tailed Mann-Whitney tests comparing control and MI for each cell type). p, Vegfa gene expression on day 2 after myocardial infarction. Relative gene expression of Vegfa in cell populations flow-sorted from leftventricular healthy (Control) and infarct tissue (MI) in relation to Gapdh, as measured by qPCR (n=6 mice per group, two-sided Mann-Whitney test for all).q, Relative Vegfa mRNA assessed by qPCR in bone marrow endothelial cells (BMEC) FACS-isolated from mice with saline or Angiotensin II (HTN) minipumps for 8 weeks (n=5 mice per group, two-tailed Mann-Whitney test). r, Vegfa expression in BMEC from wild type (Control) and Apoe−/− mice on a Western Diet for 12 weeks (Athero) (n=6 mice per group, two-tailed Mann-Whitney test). s, Flow cytometry of splenic LSK and myeloid cells in Cdh5CreERT2 controls and Cdh5CreERT2;Kdrf/fl mice 3 days post MI (n=4 mice per group, two-tailed Mann-Whitney test). Data are displayed as mean±SEM.
Extended Data Fig. 7 |
Extended Data Fig. 7 |. Gene deletion in bone marrow endothelial cells.
a, Relative Il6 mRNA levels assessed by qPCR in bone marrow endothelial cells (BMEC) FACS-isolated from mice with saline or Angiotensin II (HTN) for 8 weeks (n=5 mice per group), from wild type (Control) and Apoe−/− mice on a Western Diet for 10 weeks (Athero, n=6 mice per group), and from controls and mice on day 4 after MI (n=6 mice per group, two-tailed Mann-Whitney test). b, c, Concentration of Il6 in blood plasma (b) and bone marrow interstitial fluid (c) in wild type (Control) and Apoe−/− mice on a Western Diet for 10 weeks (Athero) by ELISA (n=5 controls, n=7 Apoe−/−, two-tailed Mann-Whitney test). d, Experimental outline. e, Flow cytometry enumeration of splenic LSK and myeloid cells in Cdh5CreERT2 and Cdh5CreERT2;Il6fl/fl mice 12 weeks after PCSK9-AAV injection and start of an atherogenic diet in order to induce atherosclerosis (n=6 Cdh5CreERT2, n=5 Cdh5CreEBT2;Il6f/fl mice, two-tailed Mann-Whitney test). f, Vascular permeability measured by Evans Blue extravasation in the femoral bone marrow of Cdh5CreERT2 and Cdh5CreERT2;Il6fl/fl mice with atherosclerosis (n=6 per group, two-tailed Mann-Whitney test). g, Versican (Vcan) expression in flow-sorted bone marrow endothelial cells from mice with saline or Angiotensin II (HTN) for 8 weeks (n=5 mice per group), from wild type (Control) and Apoe−/− mice on a Western Diet for 10 weeks (n=6 mice per group) and from controls and mice 4 days after MI (n=6 mice per group, two-tailed Mann-Whitney tests). h, Experimental outline. i, Flow cytometry enumeration of splenic LSK and myeloid cells in Cdh5CreERT2 and Cdh5CreERT2;Vcanfl/fl mice 3 days after MI (n=4 mice per group, two-tailed Mann-Whitney test). j, Vascular permeability measured by Evans Blue extravasation in the femoral bone marrow of Cdh5CreERT2 and Cdh5CreERT2;Vcanfl/fl mice on day 2 after MI (n=5 mice per group, two-tailed Mann-Whitney test). Data are displayed as mean±SEM.
Extended Data Fig. 8 |
Extended Data Fig. 8 |. Summary cartoons, depicting the distinct bone marrow vascular phenotypes found in mice with arterial hypertension, atherosclerosis and myocardial infarction.
a, In the bone marrow of mice with hypertension, we observed angiogenesis, increased perivascular collagen deposition and higher integrin expression. Functionally, bone marrow vessels were more leaky and the vasodilation response to acetylcholine was impaired, indicating endothelial dysfunction. These changes in the vascular niche were associated with increased hematopoietic progenitor proliferation and higher systemic numbers of innate immune cells. b, In the bone marrow of mice with atherosclerosis, we observed perivascular lipid deposition, vascular fibrosis, vascular leakiness, endothelial dysfunction, inflammatory endothelial cell activation, including increased Il6 expression. Il6 deletion from endothelial cells reduced hematopoiesis, indicating that the inflamed endothelium increases the production of immune cells in atherosclerosis. c, Mice with acute myocardial infarction exhibit Vegfa/Vefr2 dependent angiogenesis, which licensed emergency myelopoiesis (endothelial cell-specific Vegfr2 deletion dampened post-MI leukocytosis). In addition, bone marrow endothelial cells expressed more Versican, and deletion of the gene indicated that Versican also contributed to increased proliferation of hematopoietic stem and progenitor cells after MI. In the bone marrow of mice with acute MI we also observed endothelial dysfunction, vascular leakiness and inflammatory endothelial cell activation.
Fig. 1 |
Fig. 1 |. Increased bone marrow myelopoiesis in human CVD.
a, Gating on human bone marrow HSPCs and their proliferative state by Ki-67 staining. Flow cytometry gating was defined by the use of fluorescence-minus-one controls for each sample. b, Quantification of Ki-67+ proliferation rates in phenotypic HSCs, CMPs and GMPs (n = 6 healthy control participants, n = 6 patients with arterial hypertension, n = 8 patients with atherosclerosis and arterial hypertension, n = 8 patients on day 3 to day 7 after acute MI; two-tailed Mann-Whitney tests between controls and each patient cohort without multiple-comparison correction). Data are displayed as mean ± s.e.m.
Fig. 2 |
Fig. 2 |. Arterial hypertension, atherosclerosis and MI alter the bone marrow vasculature.
a, Experimental outline for mouse models of Ang-II-induced arterial hypertension (HTN), atherosclerosis (athero) and acute MI. b, Immunohistochemical staining for collagen IV and wall-to-lumen ratios of femoral bone marrow arterioles (n = 12 saline-treated mice, n = 16 with Ang-II (hypertension); n = 12 wild-type mice, n = 13 Apoe−/− mice on a western diet (atherosclerosis); n = 10 controls, n = 10 with MI (day 6); two-tailed Mann-Whitney test). c, Staining and quantification of Oil Red O+ bone marrow blood vessels in wild-type (control) and Apoe−/− mice (atherosclerosis, n = 8 mice per group, two-tailed Mann-Whitney test). Images (d) and quantification (e) of endomucin (EMCN) immunofluorescence for sinusoids and laminin α1 (LAMA1) for arterioles in the femur metaphysis (n = 13 mice per group for hypertension, n = 12 for atherosclerosis, n = 11 controls and n = 13 for MI; two-tailed Mann-Whitney test). DAPI, 4′,6-diamidino-2-phenylindole. Experimental outline (f), images (g) and quantification (h) of vascular branch points by serial intravital microscopy of the skull bone marrow 1 d before and 6d after MI (n = 8 mice per group, two-tailed paired t-test). SCA-1, stem cell antigen 1. Data are displayed as mean ± s.e.m.
Fig. 3 |
Fig. 3 |. Bone marrow angiogenesis in mice with CVD.
a, Experimental outline for mouse models of arterial hypertension, atherosclerosis and MI. b-d, Flow plots and quantification of bone marrow endothelial cells (BMECs) and their proliferation in the femur of mice with hypertension (b), atherosclerosis (c) and MI (d) (n = 9 mice per group for hypertension, n = 7 for atherosclerosis; two-tailed Welch’s t-test; n = 20 controls, n = 10 for each day after MI for bone marrow endothelial cell (EC) numbers, n = 16 controls, n = 8 for each day after MI for Ki-67, two-tailed Kruskal-Wallis test with Dunn’s post-test). e, Experimental outline. f, Immunofluorescence of femurs in AplnCreER;Rosa26ZsGreen/+ mice displaying ZsGreen-positive arterioles (arrowheads) and sinusoids (arrows) on day 6 after MI (control, n = 214 images of n = 10 mice; MI, n = 316 images of n = 17 mice, two-tailed Mann-Whitney test). g, Flow cytometry quantification of new arteriolar (aECs) and sinusoidal endothelial cells (sECs) in the bone marrow of AplnCreER;Rosa26ZsGreen/+ mice (n = 5 control mice, n = 7 with MI, two-tailed Mann-Whitney test). PDPN, podoplanin. h, Enumeration of bone marrow blood vessel sprouts (arrows) per region of interest (ROI) in controls and mice 6 d after MI (n = 13 ROI from n = 6 controls, n = 17 ROI from n = 5 mice after MI; two-tailed Mann-Whitney test). Data are displayed as mean ± s.e.m.
Fig. 4 |
Fig. 4 |. CVD increases integrin abundance, compromises barrier function and leads to endothelial dysfunction in the bone marrow.
a, Experimental outline. Intravital microscopy images (b), quantification of integrin binding (c) and albumin extravasation (d) in the skull bone marrow (IntegriSense, n = 6 control mice for hypertension and atherosclerosis, hypertension (n = 6), atherosclerosis (n = 7), n = 6 controls for MI, MI (n = 5); vascular leakage, n = 7 controls for hypertension and atherosclerosis, hypertension (n = 6), atherosclerosis (n = 5), n = 6 controls for MI, MI (n = 5); two-tailed Mann-Whitney test). AU, arbitrary units; TBR, target-to-background ratio; Iratio = signal intensity outside/inside vessels. Intravital microscopy (e) and analysis (f) of arteriolar blood flow velocity by line scanning in skull marrow (n = 7 controls for hypertension and atherosclerosis, hypertension (n = 8), atherosclerosis (n = 6); n = 6 controls for MI, MI (n = 12); two-tailed Mann-Whitney test). RBC, red blood cell. Data are displayed as mean ± s.e.m.
Fig. 5 |
Fig. 5 |. MI leads to integrin activation and vascular permeability in the bone marrow.
a, In vivo precontrast T2-weighted rapid acquisition with refocused echoes (RARE) MRI (left), post-contrast parametric map of the permeability surface area product (MRI permeability, middle) and three-dimensional (3D) PET-computed tomography (CT) of 68Ga-RGD uptake in the femur (right). b, 68Ga-RGD PET-CT fused with MRI parametric permeability maps. In vivo mean permeability (c) and PET standardized uptake value (SUV) (d) (n = 6 control mice, n = 4 with MI, two-tailed Mann-Whitney test). e, 68Ga-RGD autoradiography of femora. f, Scintillation counting of femora yielding percent injection dose per g tissue (IDGT) (n = 7 control mice, n = 10 for MI, two-tailed Mann-Whitney test). g, Post-MI 68Ga-RGD uptake in different bone marrow locations normalized to that in the control (n = 9 mice for all, two-sided Friedman test with Dunn’s post-test). Data are displayed as mean ± s.e.m.
Fig. 6 |
Fig. 6 |. VEGF signaling expands angiogenesis and enables emergency hematopoiesis after MI.
a, Experimental outline. b, Immunofluorescence of EMCN-positive sinusoids and LAMA1+ arterioles (arrowheads) in the femur of controls, 6 d after MI and 6 d after MI with anti-VEGFR2 treatment (n = 8 controls, n = 9 with MI, n = 9 with MI and anti-VEGFR2; two-tailed Kruskal-Wallis test with Dunn’s post-test). c, Flow plots and bone marrow endothelial cell numbers in the femur (n = 7 controls, n = 6 with MI, n = 8 with MI and anti-VEGFR2 treatment; two-tailed Kruskal-Wallis test with Dunn’s post-test). Intravital microscopy (d) and analysis of integrin binding and vascular permeability (e) in skull bone marrow 2 d after MI (IntegriSense, MI (n = 9 mice), MI with anti-VEGFR2 treatment (n = 8); vascular leakage, MI (n = 7), MI with anti-VEGFR2 treatment (n = 8); two-tailed Mann-Whitney test). Frequency (f) and proliferation (g) of SLAM-LSK and GMPs in the femur (numbers, n = 8 controls, n = 9 with MI (day 3), n = 11 with MI and anti-VEGFR2 treatment; proliferation, n = 8 controls, n = 9 with MI (day 3), n = 8 with MI and anti-VEGFR2 treatment; one-way ANOVA with Holm-Sidak’s post-test). BrdU, bromodeoxyuridine. h, Blood monocyte (mono) and neutrophil numbers by flow cytometry (n = 11 controls, n = 10 with MI (day 3), n = 11 with MI and anti-VEGFR2 treatment; one-way ANOVA with Holm-Sidak’s post-test). i, Experimental outline. Flow plots (j), numbers (k) and proliferation (l) of HSPCs in the femora of Cdh5CreERT2 controls and Cdh5CreERT2;Kdrfl/fl mice 3 d after MI (n = 9 Cdh5CreERT2 mice, n = 8 Cdh5CreERT2;Kdrfl/fl mice; two-tailed Welch’s t-test). Both groups received tamoxifen injections 2 weeks before MI surgery. m, Blood monocytes and neutrophils 3 d after MI (n = 9 Cdh5CreERT2 mice, n = 8 Cdh5CreERT2;Kdrfl/fl mice; two-tailed Welch’s t-test). n, Bone marrow endothelial cells per femur on day 7 after MI (n = 5 mice per group, two-tailed Mann-Whitney test). Data are displayed as mean ± s.e.m.
Fig. 7 |
Fig. 7 |. CVD induces inflammatory bone marrow endothelial cell gene expression.
a, Experimental outline. WD, western diet. bd, Differential gene expression in bone marrow endothelial cells assessed by RNA-seq (n = 3 mice per group). eg, GSEA plots of gene sets related to inflammation. NES, normalized enrichment score; FDR, false discovery rate; GO, gene ontology; IFN-γ; interferon-γ; KEGG, Kyoto Encyclopedia of Genes and Genomes; LPS, lipopolysaccharide. h, Plot of gene set enrichment in Apoe−/− mice compared to controls. Neg., negative; posit., positive; reg., regulation; TLR, Toll-like receptor.
Fig. 8 |
Fig. 8 |. IL-6 and versican derived from bone marrow endothelial cells boost leukocytosis in atherosclerosis and MI.
a, Experimental outline. Atherosclerosis was induced in Cdh5CreERT2 and Cdh5CreERT2;Il6fl/fl mice by injecting PCSK9-AAV and administering a high-cholesterol diet (HCD) for 12 weeks. Both groups received tamoxifen injections 2 weeks before AAV injection and the start of the high-cholesterol diet. b, Flow plots, frequency and proliferation of SLAM-LSK in Cdh5CreERT2 and Cdh5CreERT2;Il6fl/fl mice with atherosclerosis (n = 10 Cdh5CreERT2 mice, n = 8 Cdh5CreERT2;Il6fl/fl mice for numbers; n = 8 mice per group for BrdU; two-tailed Welch’s t-test). c, Blood monocyte and neutrophil numbers (n = 9 Cdh5CreERT2 mice, n = 7 Cdh5CreERT2;Il6fl/fl mice; two-tailed Mann-Whitney test). d,e, Competitive bone marrow-transplantation assay. Bone marrow mononuclear cells (BMNCs) were isolated from Cdh5CreERT2 and Cdh5CreERT2;Il6fl/fl mice with atherosclerosis and mixed with BMNCs from naive CD45.1 mice in equal proportions before transplantation into lethally irradiated CD45.2 recipients. Flow plot (d) and time course (e) of blood leukocyte chimerism, showing reduced contribution from Cdh5CreERT2;Il6fl/fl donors (n = 8 recipient mice per group, two-tailed Welch’s t-test for percent CD45.2 at week 16). f, Experimental outline. Cdh5CreERT2 and Cdh5CreERT2;Vcanfl/fl mice received tamoxifen injections 2 weeks before MI. g,h, Flow plots, numbers and proliferation of bone marrow SLAM-LSK (g) and blood myeloid cells (h) in Cdh5CreERT2 controls and Cdh5CreERT2;Vcanfl/fl mice, all 3 d after MI (n = 8 mice per group, two-tailed Mann-Whitney test). i,j, Competitive bone marrow-transplantation assay. BMNCs were taken from Cdh5CreERT2 and Cdh5CreERT2;Vcanfl/fl mice, both 3 d after MI, and mixed with BMNCs from naive CD45.1 mice in equal proportions before transplantation into lethally irradiated CD45.2 recipients. Flow plot (i) and time course (j) of blood leukocyte chimerism, showing reduced contribution from Cdh5CreERT2;Vcanfl/fl donors (n = 8 recipient mice per group, two-tailed Welch’s t-test for percent CD45.2 at week 16). Data are displayed as mean ± s.e.m.

References

    1. Moore KJ & Tabas I Macrophages in the pathogenesis of atherosclerosis. Cell 145, 341–355 (2011). - PMC - PubMed
    1. Murphy AJ & Tall AR Disordered haematopoiesis and atherothrombosis. Eur. Heart J 37, 1113–1121 (2016). - PMC - PubMed
    1. Weber C & Noels H Atherosclerosis: current pathogenesis and therapeutic options. Nat. Med 17, 1410–1422 (2011). - PubMed
    1. Grimm RHJ, Neaton JD & Ludwig W Prognostic importance of the white blood cell count for coronary, cancer, and all-cause mortality. JAMA 254, 1932–1937 (1985). - PubMed
    1. Madjid M, Awan I, Willerson JT & Casscells SW Leukocyte count and coronary heart disease: implications for risk assessment. J. Am. Coll. Cardiol 44, 1945–1956 (2004). - PubMed

MeSH terms