. 2022 Jun 7;25(7):104551.
doi: 10.1016/j.isci.2022.104551. eCollection 2022 Jul 15.

The origin of bladder cancer from mucosal field effects

Affiliations

The origin of bladder cancer from mucosal field effects

Jolanta Bondaruk et al. iScience. .

Erratum in

  • Erratum: The origin of bladder cancer from mucosal field effects.
    Bondaruk J, Jaksik R, Wang Z, Cogdell D, Lee S, Chen Y, Dinh KN, Majewski T, Zhang L, Cao S, Tian F, Yao H, Kuś P, Chen H, Weinstein JN, Navai N, Dinney C, Gao J, Theodorescu D, Logothetis C, Guo CC, Wang W, McConkey D, Wei P, Kimmel M, Czerniak B. Bondaruk J, et al. iScience. 2022 Jul 4;25(7):104715. doi: 10.1016/j.isci.2022.104715. eCollection 2022 Jul 15. iScience. 2022. PMID: 35811851 Free PMC article.

Abstract

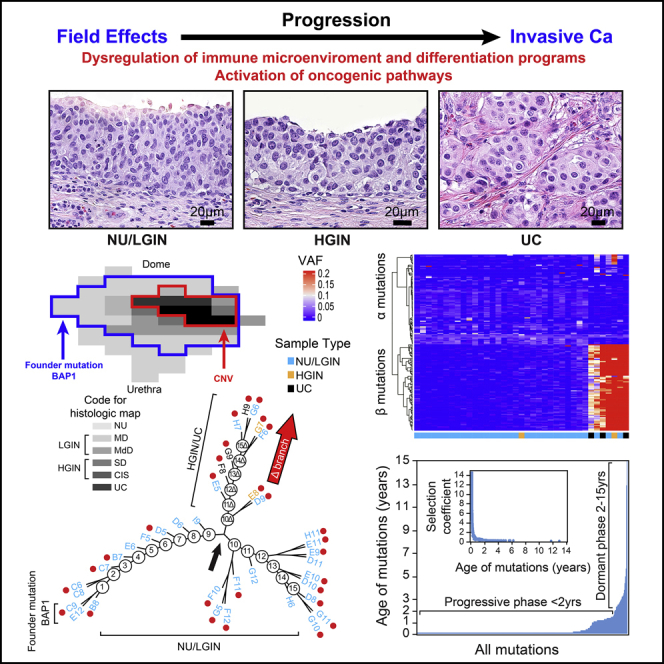
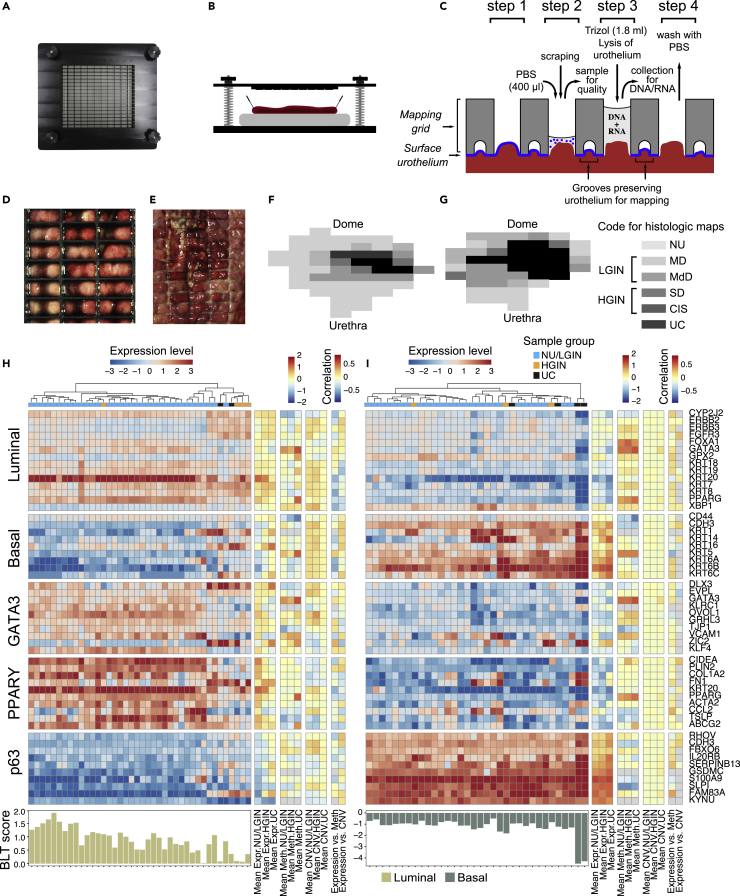
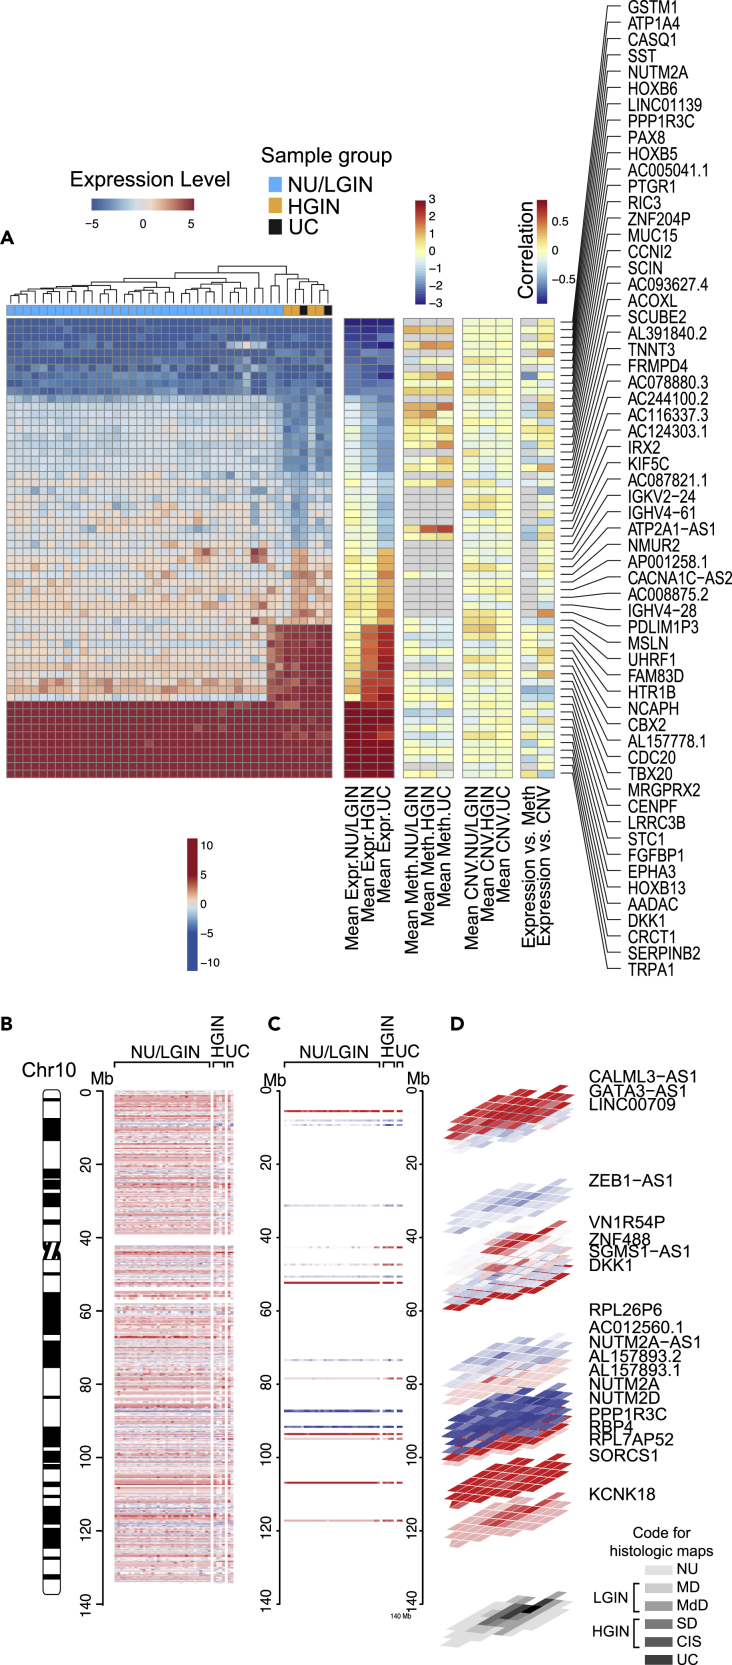
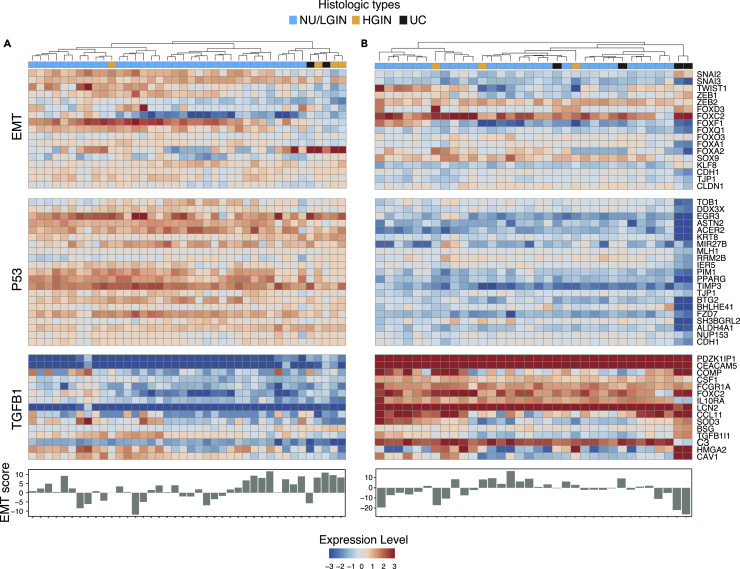
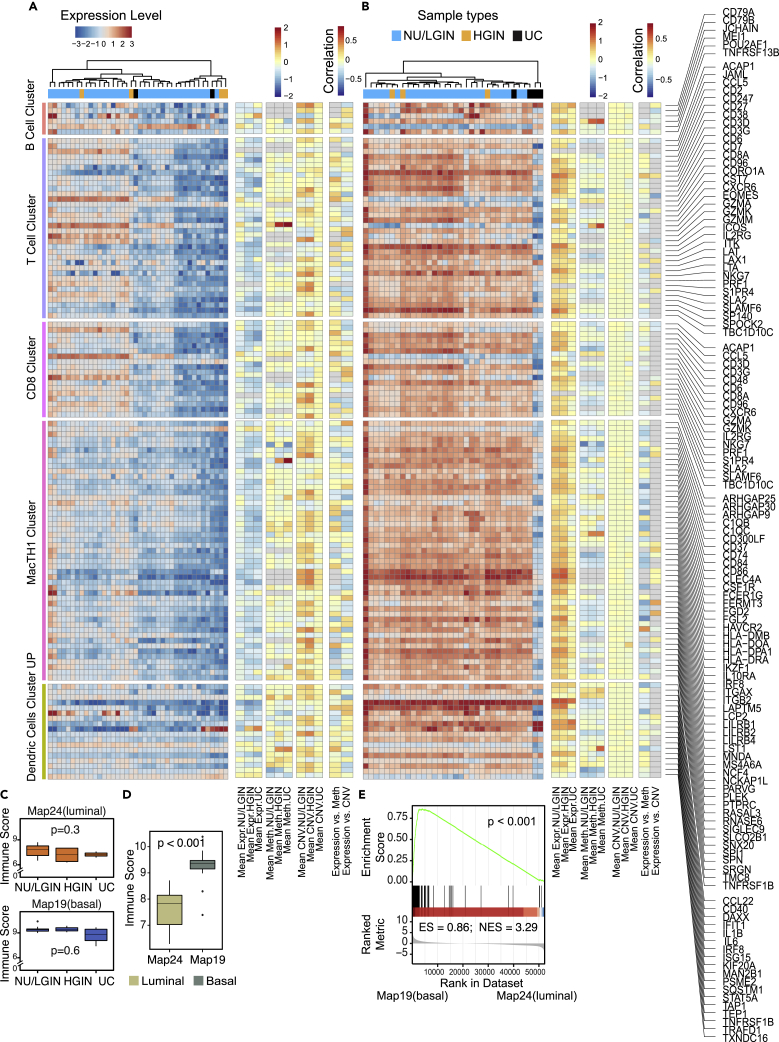
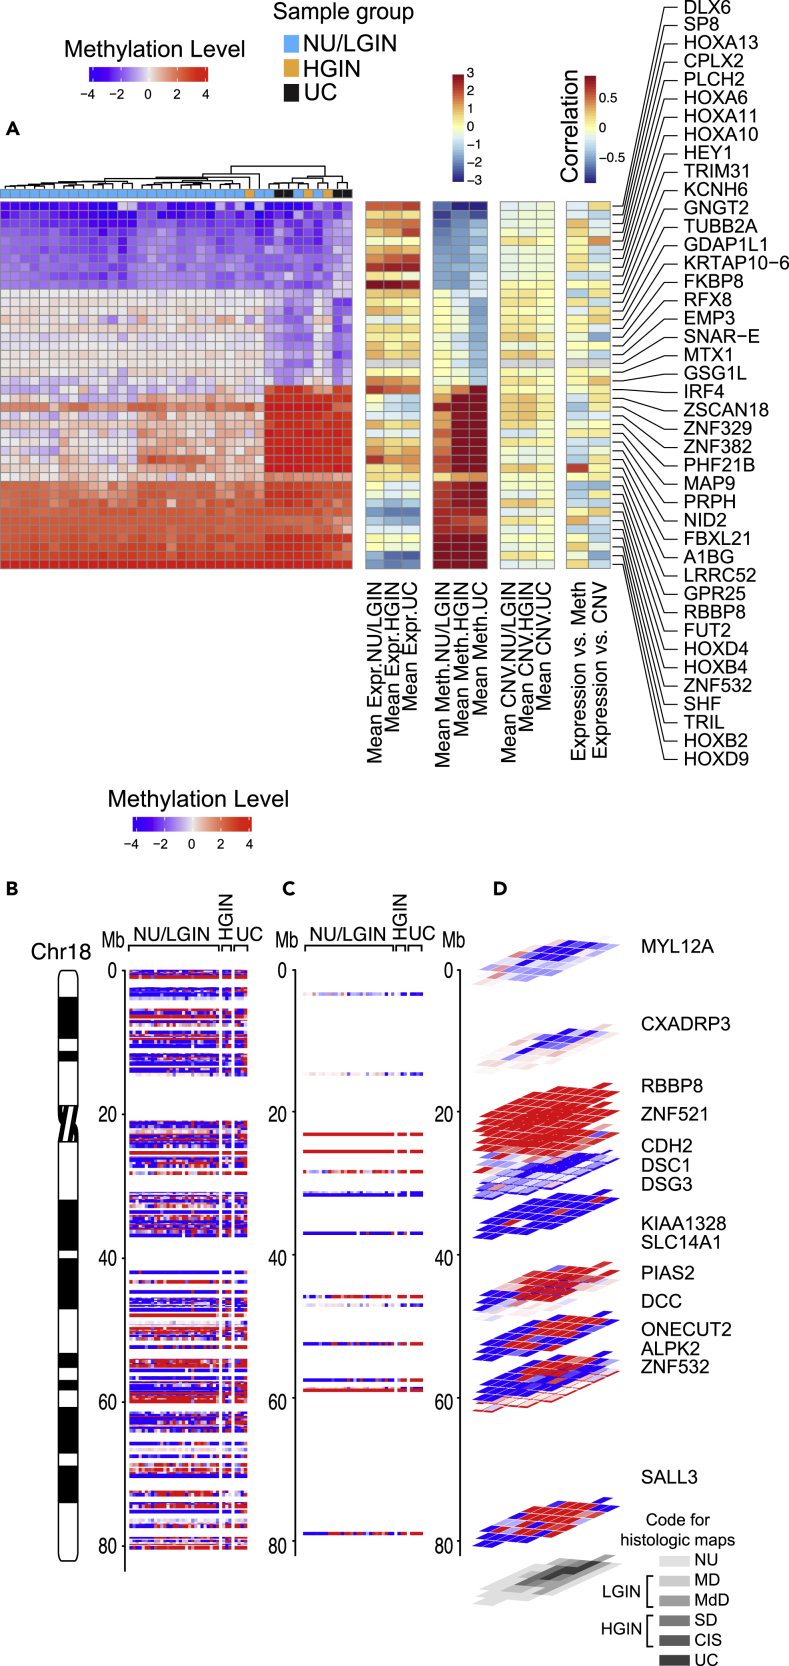
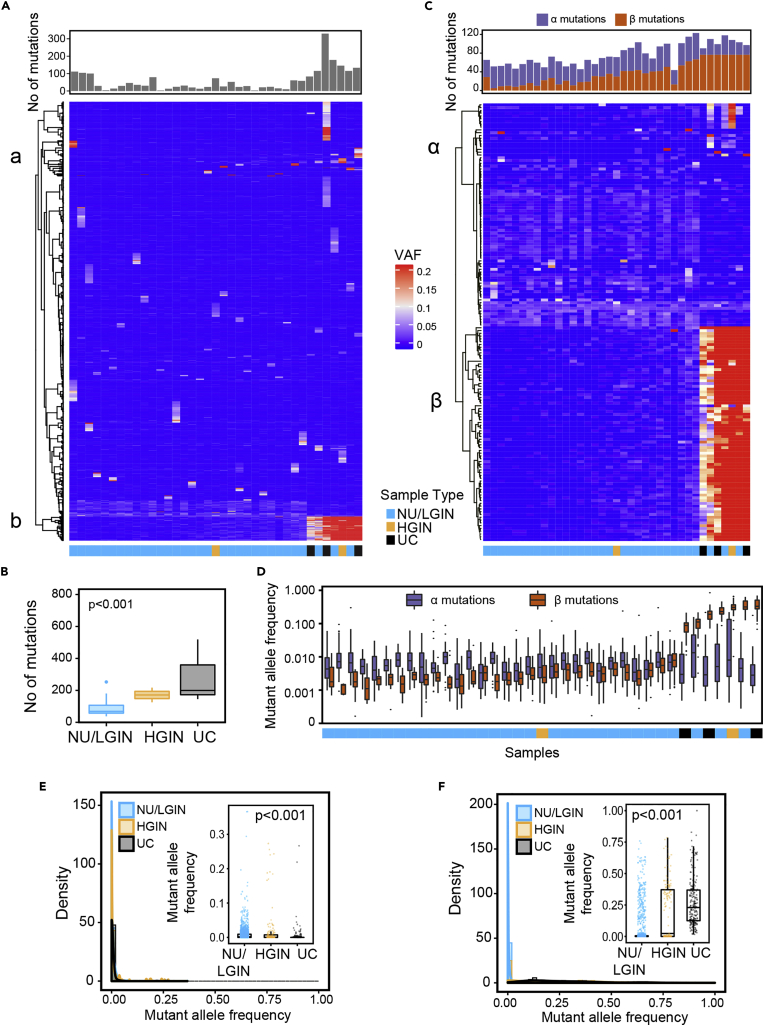
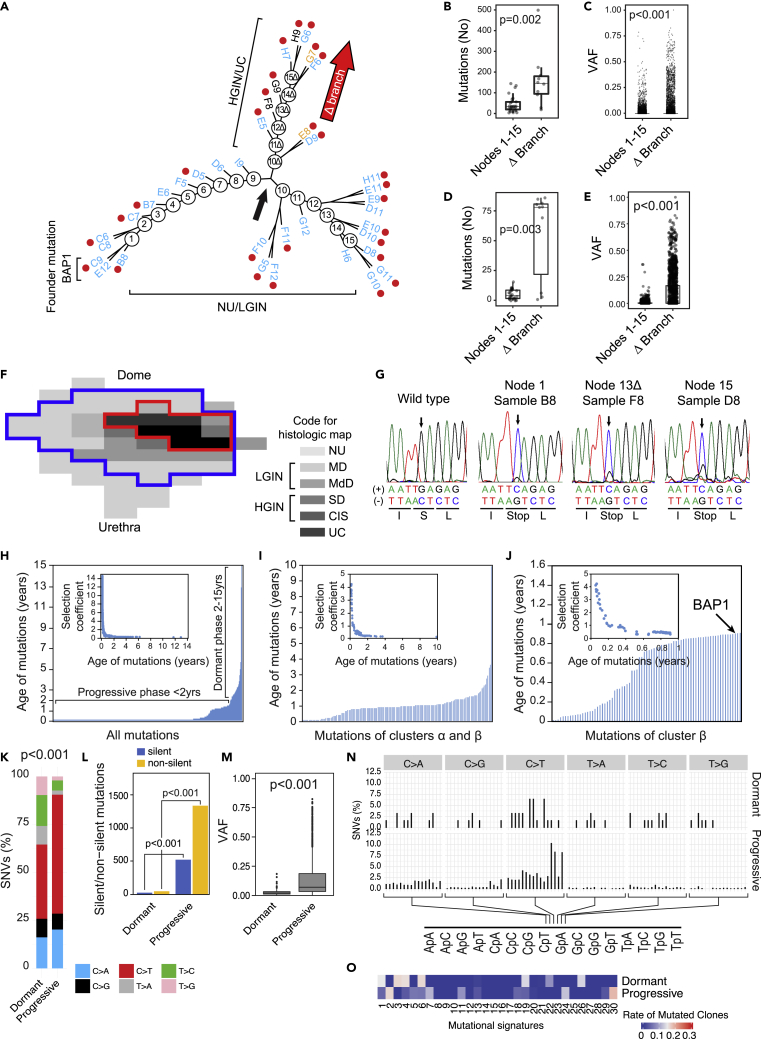
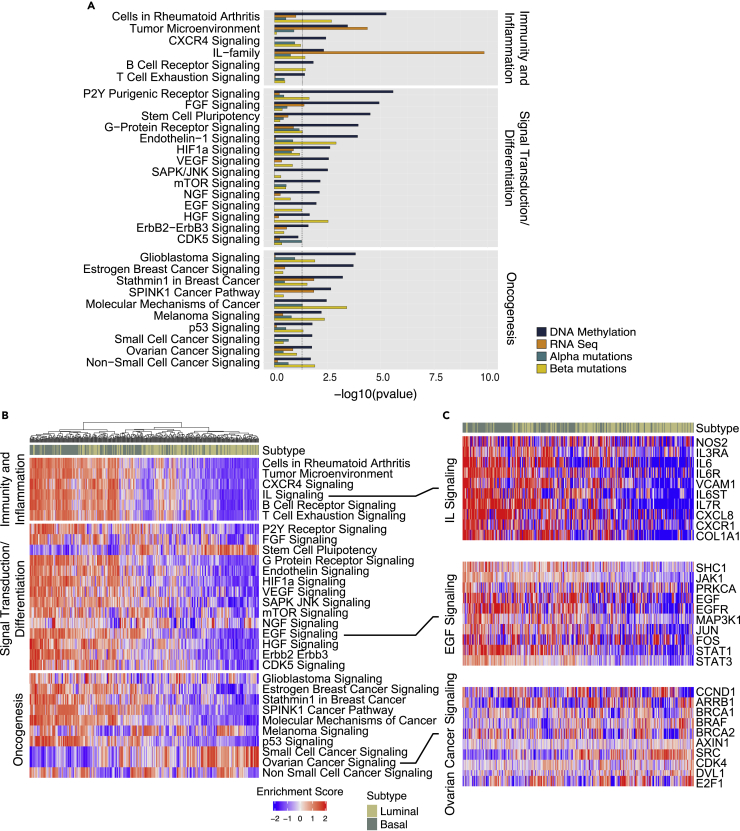
Whole-organ mapping was used to study molecular changes in the evolution of bladder cancer from field effects. We identified more than 100 dysregulated pathways, involving immunity, differentiation, and transformation, as initiators of carcinogenesis. Dysregulation of interleukins signified the involvement of inflammation in the incipient phases of the process. An aberrant methylation/expression of multiple HOX genes signified dysregulation of the differentiation program. We identified three types of mutations based on their geographic distribution. The most common were mutations restricted to individual mucosal samples that targeted uroprogenitor cells. Two types of mutations were associated with clonal expansion and involved large areas of mucosa. The α mutations occurred at low frequencies while the β mutations increased in frequency with disease progression. Modeling revealed that bladder carcinogenesis spans 10-15 years and can be divided into dormant and progressive phases. The progressive phase lasted 1-2 years and was driven by β mutations.

Keywords: Cancer; Cell biology; Molecular biology.


Conflict of interest statement

We confirm that there are no competing interests.

Figures

None
Graphical abstract
Figure 1
Figure 1
Preparation of whole-organ maps for multi-platform genomic profiling (A) Top view of the mapping grid for whole-organ sampling. (B) Diagram showing open cystectomy mounted on a paraffin block. (C) Diagram showing the details of the mapping grid preserving the surface urothelium for histologic mapping and facilitating simultaneous DNA/RNA extraction as well as its quality assessment of cytologic preparations. The four preparation steps are described in the material and methods section. (D) Top view of the mapping grid superimposed over bladder mucosa. (E) Impression of the mapping grid on the bladder surface. (F) A whole-organ histologic map prepared by sampling the entire bladder mucosa in a luminal map (map 24). (G) A whole-organ histologic map prepared by sampling the entire bladder mucosa in a basal map (map 19). The histologic map code is as follows: NU, normal urothelium; MD, mild dysplasia; MdD, moderate dysplasia; SD, severe dysplasia; CIS, carcinoma in situ; UC, urothelial carcinoma. For analytical purposes, samples of MD and MdD were combined and referred to as LGIN. Samples of SD and CIS were combined and referred to as HGIN. (H) Expression patterns for luminal and basal markers and BLT scores for mucosal and tumor samples obtained from a cystectomy specimen with luminal bladder cancer in map 24. (I) Expression patterns for luminal and basal markers and BLT scores for mucosal and tumor samples obtained from a cystectomy specimen with basal bladder cancer in map 19.
Figure 2
Figure 2
Evolution of gene expression changes from field effects through HGIN to UC in bladder cancer developing along the luminal track in map 24 (A) Hierarchical clustering of mucosal and tumor samples using the top 60 most downregulated and overexpressed genes showing monotonic expression changes in samples corresponding to NU/LGIN through HGIN to UC, HGIN and UC, and UC only. (B) Whole-organ expression map of chromosome 10 showing a chromosomal diagram and the expression pattern for genes in individual cystectomy samples classified as NU/LGIN, HGIN, and UC. (C) Expression pattern for downregulated and overexpressed genes with monotonic changes involving NU/LGIN, HGIN, and UC in chromosome 10. (D) Three-dimensional (3D) pattern of downregulated and overexpressed genes in mucosal and tumor samples as it relates to the whole-organ histologic map of a cystectomy sample filtered as in C.
Figure 3
Figure 3
EMT in the evolution of bladder cancer from field effects along the luminal and basal tracks (A) Expression pattern for selected EMT-related genes and EMT scores in mucosal samples of a cystectomy specimen with luminal cancer (map 24). (B) Expression pattern for selected EMT-related genes and EMT scores in mucosal samples of a cystectomy specimen with basal cancer (map 19).
Figure 4
Figure 4
Immune landscape of bladder cancer evolving from field effects along the luminal and basal tracks (A) Expression pattern for immune-related genes in mucosal samples from a cystectomy specimen with luminal cancer (map 24). (B) Expression pattern for immune-related genes in mucosal samples from a cystectomy specimen with basal cancer (map 19). (C) Boxplots of immune checkpoint scores calculated using the gene expression profiles in A and B of map 24 (top) and map 19 (bottom) for subsets of samples classified as NU/LGIN, HGIN, and UC. (D) Comparison of immune scores for luminal (map 24) and basal (map 19) cancers. (E) GSEA for immune related genes in map 24 (luminal) and map 19 (basal). For (C) and (D) p values were calculating using Kruskal-Wallis test.
Figure 5
Figure 5
Evolution of gene methylation changes from field effects through HGIN to UC in bladder cancer developing along the luminal track in map 24 (A) Hierarchical clustering mucosal and tumor samples using the top 42 most hypomethylated and hypermethylated genes showing monotonic expression changes in samples corresponding to NU/LGIN through HGIN to UC, HGIN and UC, and UC only. (B) Whole-organ expression map of chromosome 18 showing a chromosomal diagram and the methylation pattern for genes in individual samples from a cystectomy classified as NU/LGIN, HGIN, and UC. (C) Methylation pattern for hypomethylated and hypermethylated genes with monotonic changes involving NU/LGIN, HGIN, and UC in chromosome 18. (D) 3D pattern of hypomethylated and hypermethylated genes as it relates to a whole-organ histologic map of a cystectomy sample filtered as in A.
Figure 6
Figure 6
Enrichment of clonal genetic mutations in the evolution of bladder cancer from field effects along the luminal track in map 24 (A) Heatmap of nonsilent mutations showing VAFs in individual mucosal samples. Number of mutations in individual mucosal samples are shown in the top diagram. (B) Boxplot analysis of number of mutations in mucosal samples classified as NU/LGIN, HGIN, and UC. (C) Heatmap of VAFs ≥0.01 in 157 genes showing variant alleles in at least three mucosal samples. Number of α and β mutations in individual samples are shown on the top diagram. (D) Mutant allele frequencies of α and β mutations in individual mucosal samples. (E) Density plot showing the clonality of nonsilent VAFs in cluster α with similar low frequencies across mucosal samples that decreased with progression to HGIN and UC (Kruskal-Wallis test p value). Inset, boxplot of VAFs in three groups of samples corresponding to NU/LGIN, HGIN, and UC (Kruskal-Wallis test p value). (F) Density plot showing the clonality of nonsilent VAFs in cluster β with a significant increase in clonality with progression to HGIN and UC. Inset, boxplot of VAFs in three groups of samples corresponding to NU/LGIN, HGIN, and UC (Kruskal-Wallis test p value). For (B) p value was calculating using ANOVA test.
Figure 7
Figure 7
Evolution of mutations from field effects along the luminal track (A) Parsimony analysis showing an evolutionary tree with nine nodes of expansion of successive clones of cells in the field effects corresponding to NU/LGIN with major branching at node nine designated the Δ branch, which evolved to HGIN and UC. All foci of HGIN and UC evolved from successive waves of clonal expansion in the Δ branch. The main NU/LGIN clone continued to evolve in successive waves of mutational changes (nodes 10-15) with a complex branching pattern that did not progress to HGIN or UC. (B) Numbers of mutations in nodes 1-15 and the Δ branch in the evolutionary tree shown in A. (C) VAFs of all nonsynonymous mutations in nodes 1-15 and the Δ branch in the evolutionary tree shown in A (Wilcoxon rank-sum p value). (D) Numbers of mutations in cluster β in nodes 1-15 and the Δ branch in the evolutionary tree shown in A. (E) VAFs of mutations in cluster β in nodes 1-15 and the Δ branch in the evolutionary tree shown in A (Wilcoxon rank-sum p value). (F) Whole-organ histologic map showing a plaque-like mucosal area outlined by a blue line with a founder mutation of BAP1. The red line outlines an area corresponding to widespread CNV alterations. (G) Validation of BAP1 mutational inactivation by Sanger sequencing. Variant allele of BAP1 DNA traces are shown in selected mucosal samples and compared to the wild-type sequence. (H) Ages of all synonymous and nonsynonymous mutations predicted by mathematical modeling. Inset, the selection coefficient in relation to the predicted mutation age. (I) Ages of the mutations in clusters α and β predicted using mathematical modeling. Inset, the selection coefficient for mutations in clusters α and β in relation to their ages. (J) Ages of the mutations in cluster β predicted using mathematical modeling. Inset, the selection coefficient for mutations in cluster β in relation to their ages. Inset, the selection coefficient for mutations in cluster β in relation to their ages. (K) Composite bar graph showing the distribution of all nucleotide substitutions in dormant and progressive phases of bladder cancer development. (L) Bar plots showing the number of silent and nonsilent mutations in the dormant and progressive phases of bladder cancer development. (M) VAF in dormant and progressive phases of bladder cancer development. (N) Proportion of SNVs in specific nucleotide motifs for each category of substitutions in dormant and progressive phases of bladder cancer development. (O) Weight scores for mutagenesis patterns in dormant and progressive phases of bladder cancer development. For (B) and (D) p values were calculated using a Kruskal-Wallis test. For (K) and (L) p values were calculated using a test of proportions. For (M) p values were calculated using a two sample Wilcoxon test.
Figure 8
Figure 8
Interactive analyses of molecular pathways in bladder cancer development from field effects with their validation in the TCGA cohort (A) Combined selected monotonically dysregulated pathways in field effects of both luminal and basal maps (One-sided Fisher exact test p value). (B) Differential enrichment scores for the regulons controlling immunity, inflammation, signal transduction/differentiation, and oncogenesis in molecular subtypes of bladder cancer in the TCGA cohort (n = 408). (C) Expression pattern for selected genes in the regulons of ILs, epidermal growth factor, and ovarian cancer signaling in the molecular subtypes of bladder cancer in the TCGA cohort (n = 408).

References

    1. Alexandrov L.B., Nik-Zainal S., Wedge D.C., Aparicio S.A.J.R., Behjati S., Biankin A.V., Bignell G.R., Bolli N., Borg A., Børresen-Dale A.L., et al. Signatures of mutational processes in human cancer. Nature. 2013;500:415–421. doi: 10.1038/nature12477. - DOI - PMC - PubMed
    1. Alvisi G., Brummelman J., Puccio S., Mazza E.M., Tomada E.P., Losurdo A., Zanon V., Peano C., Colombo F.S., Scarpa A., et al. IRF4 instructs effector Treg differentiation and immune suppression in human cancer. J. Clin. Invest. 2020;130:3137–3150. doi: 10.1172/JCI130426. - DOI - PMC - PubMed
    1. Aryee M.J., Jaffe A.E., Corrada-Bravo H., Ladd-Acosta C., Feinberg A.P., Hansen K.D., Irizarry R.A. Minfi: a flexible and comprehensive Bioconductor package for the analysis of Infinium DNA methylation microarrays. Bioinformatics. 2014;30:1363–1369. doi: 10.1093/bioinformatics/btu049. - DOI - PMC - PubMed
    1. Benjamini Y., Hochberg Y. Controlling the false discovery rate - a practical and powerful approach to multiple testing. J. Roy. Stat. Soc. B Stat. Methodol. 1995;57:289–300. doi: 10.1111/j.2517-6161.1995.tb02031.x. - DOI
    1. Bhandari A., Xia E., Zhou Y., Guan Y., Xiang J., Kong L., Wang Y., Yang F., Wang O., Zhang X. ITGA7 functions as a tumor suppressor and regulates migration and invasion in breast cancer. Cancer Manag. Res. 2018;10:969–976. doi: 10.2147/CMAR.S160379. - DOI - PMC - PubMed