

Semi-Automatic Prostate Segmentation From Ultrasound Images Using Machine Learning and Principal Curve Based on Interpretable Mathematical Model Expression
- PMID: 35747834
- PMCID: PMC9209717
- DOI: 10.3389/fonc.2022.878104
Semi-Automatic Prostate Segmentation From Ultrasound Images Using Machine Learning and Principal Curve Based on Interpretable Mathematical Model Expression
Abstract
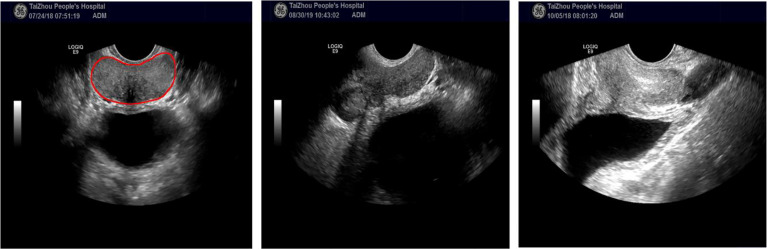
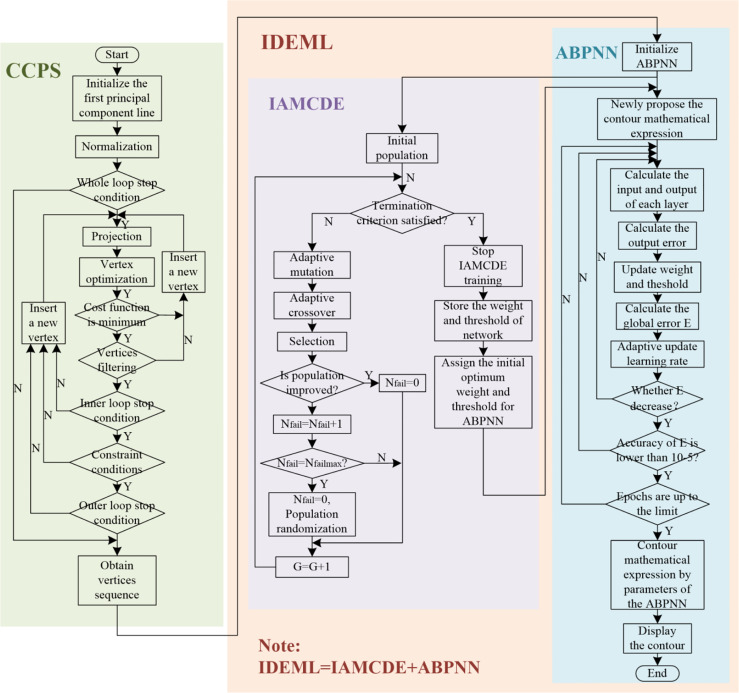
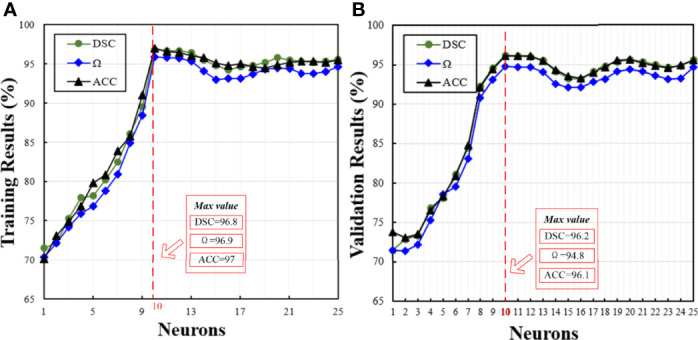
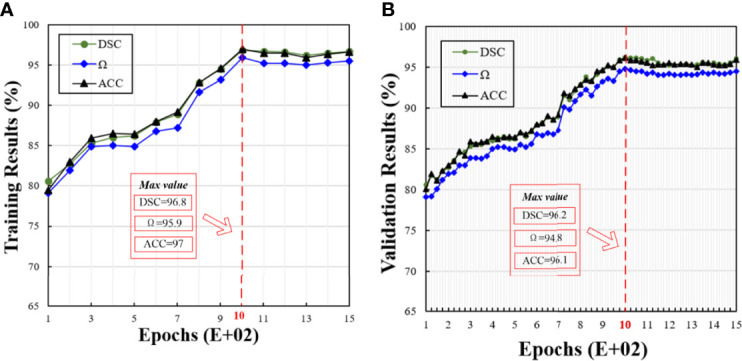
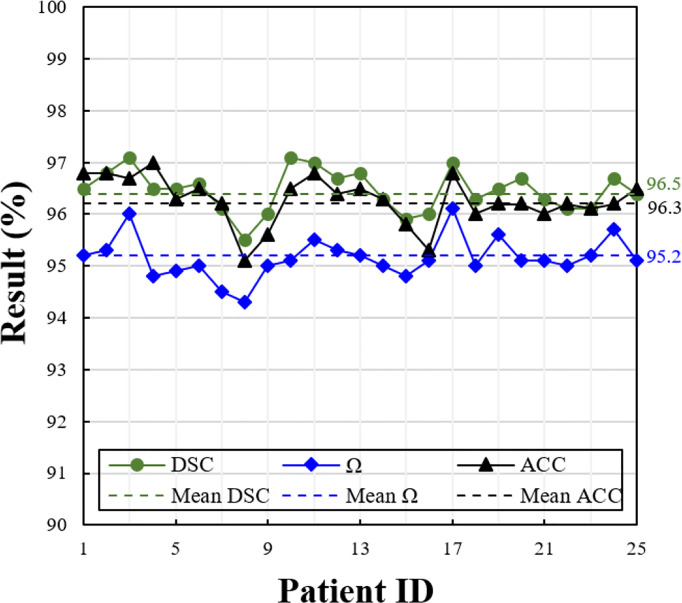
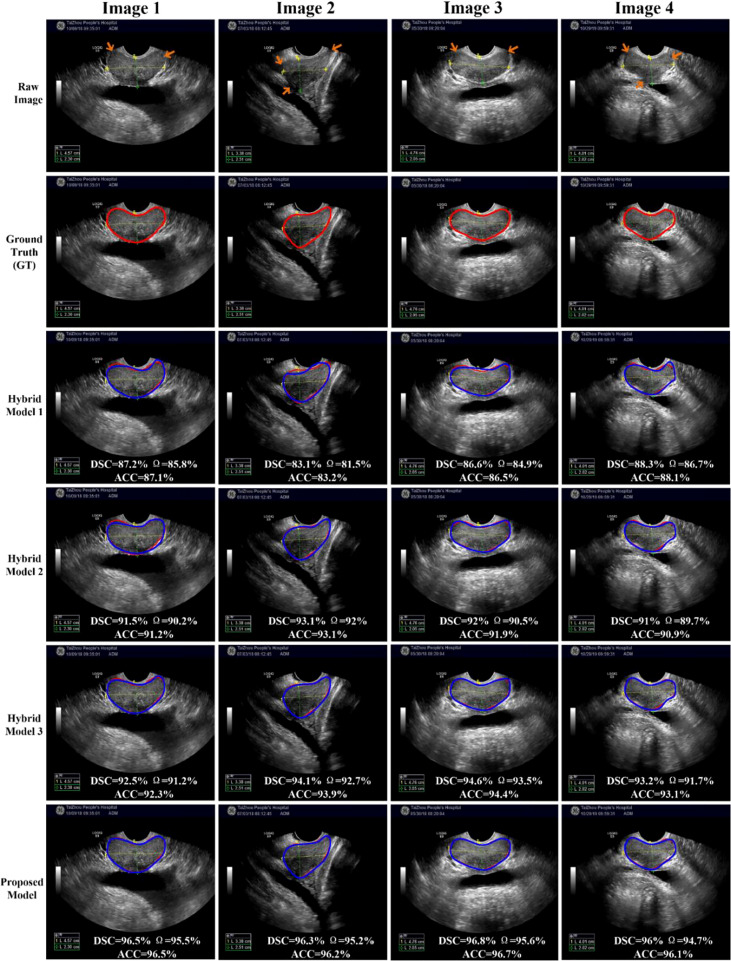
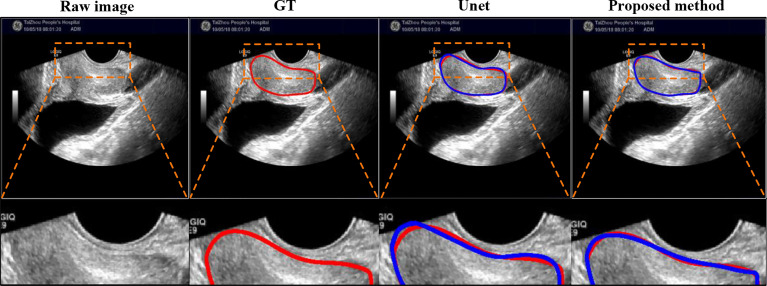
Accurate prostate segmentation in transrectal ultrasound (TRUS) is a challenging problem due to the low contrast of TRUS images and the presence of imaging artifacts such as speckle and shadow regions. To address this issue, we propose a semi-automatic model termed Hybrid Segmentation Model (H-SegMod) for prostate Region of Interest (ROI) segmentation in TRUS images. H-SegMod contains two cascaded stages. The first stage is to obtain the vertices sequences based on an improved principal curve-based model, where a few radiologist-selected seed points are used as prior. The second stage is to find a map function for describing the smooth prostate contour based on an improved machine learning model. Experimental results show that our proposed model achieved superior segmentation results compared with several other state-of-the-art models, achieving an average Dice Similarity Coefficient (DSC), Jaccard Similarity Coefficient (Ω), and Accuracy (ACC) of 96.5%, 95.2%, and 96.3%, respectively.
Keywords: accurate prostate segmentation; constraint closed polygonal segment model; improved differential evolution-based method; interpretable mathematical model expression; machine learning; principal curve; transrectal ultrasound.
Copyright © 2022 Peng, Tang, Wu and Cai.
Conflict of interest statement
The authors declare that the research was conducted in the absence of any commercial or financial relationships that could be construed as a potential conflict of interest.
Figures
Similar articles
-
H-ProSeg: Hybrid ultrasound prostate segmentation based on explainability-guided mathematical model.Comput Methods Programs Biomed. 2022 Jun;219:106752. doi: 10.1016/j.cmpb.2022.106752. Epub 2022 Mar 17. Comput Methods Programs Biomed. 2022. PMID: 35338887
-
Boundary delineation in transrectal ultrasound images for region of interest of prostate.Phys Med Biol. 2023 Sep 20;68(19). doi: 10.1088/1361-6560/acf5c5. Phys Med Biol. 2023. PMID: 37652058
-
Automatic prostate segmentation using deep learning on clinically diverse 3D transrectal ultrasound images.Med Phys. 2020 Jun;47(6):2413-2426. doi: 10.1002/mp.14134. Epub 2020 Apr 8. Med Phys. 2020. PMID: 32166768
-
Random Walk Based Segmentation for the Prostate on 3D Transrectal Ultrasound Images.Proc SPIE Int Soc Opt Eng. 2016 Feb 27;9786:978607. doi: 10.1117/12.2216526. Epub 2016 Mar 18. Proc SPIE Int Soc Opt Eng. 2016. PMID: 27660383 Free PMC article.
-
Detection of Lung Contour with Closed Principal Curve and Machine Learning.J Digit Imaging. 2018 Aug;31(4):520-533. doi: 10.1007/s10278-018-0058-y. J Digit Imaging. 2018. PMID: 29450843 Free PMC article. Review.
References
-
- Wang Y, Dou H, Hu X, Zhu L, Yang X, Xu M, et al. . Deep Attentive Features for Prostate Segmentation in 3D Transrectal Ultrasound. In: IEEE Transactions on Medical Imaging, vol. 38. (2019). p. 2768–78. - PubMed
-
- Peng T, Cai T, Wang J. Prostate Segmentation of Ultrasound Images Based on Interpretable-Guided Mathematical Model. In: International Conference on Multimedia Modeling (MMM). Springer, Cham; (2022). p. 166–77.
-
- Peng T, Zhao J, Wang J. Interpretable Mathematical Model-Guided Ultrasound Prostate Contour Extraction Using Data Mining Techniques. In: 2021 IEEE International Conference on Bioinformatics and Biomedicine (BIBM), Houston, TX, USA. (2021). p. 1037–44.
LinkOut - more resources
Full Text Sources