. 2022 Jun;50(6):3000605221105163.
doi: 10.1177/03000605221105163.

Local aldosterone synthesis in the large intestine of mouse: An ex vivo incubation study

Affiliations

Local aldosterone synthesis in the large intestine of mouse: An ex vivo incubation study

Zan Pang et al. J Int Med Res. 2022 Jun.

Abstract

Objective: To investigate the regulation of local aldosterone synthesis by physiological stimulants in the murine gut.

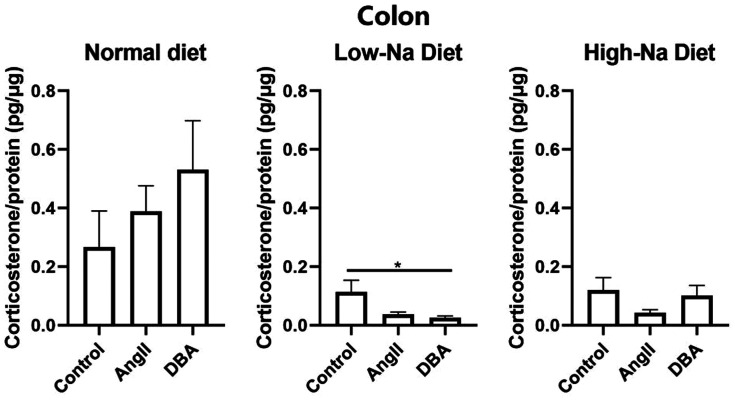
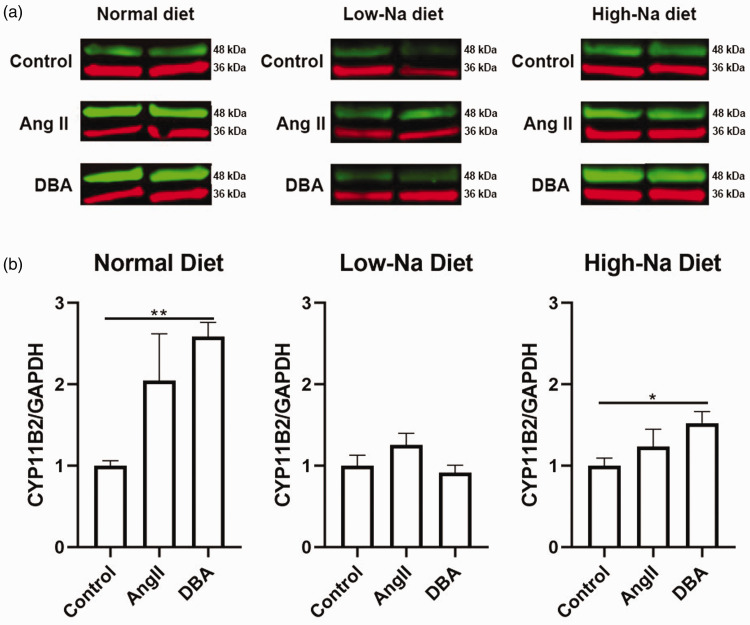
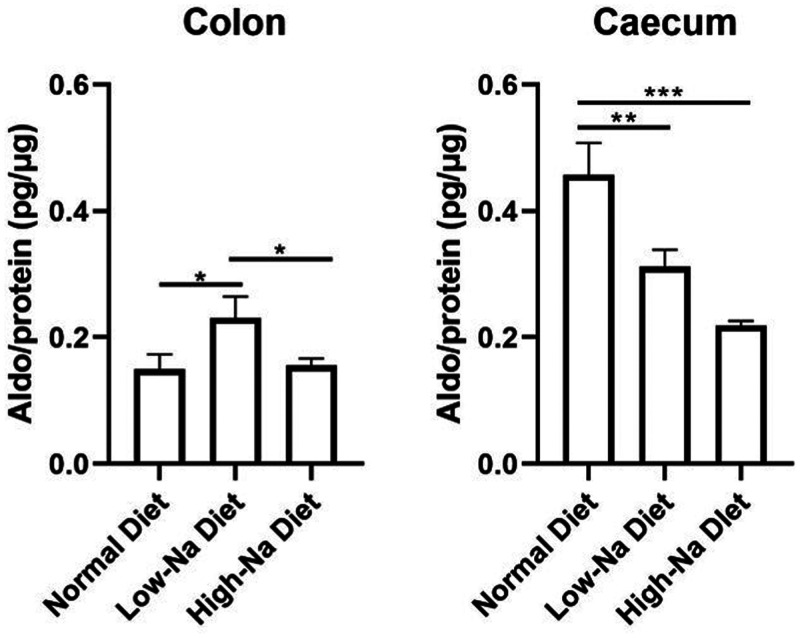
Methods: Male mice were fed for 14 days with normal, high (1.6%) or low (0.01%) sodium diets. Tissue liver receptor homolog-1 and aldosterone in the colon and caecum were detected using an enzyme-linked immunosorbent assay (ELISA). Released corticosterone and aldosterone in tissue incubation experiments after stimulation with angiotensin II (Ang II) and dibutyryl-cAMP (DBA; the second messenger of adrenocorticotropic hormone) were assayed using an ELISA. Tissue aldosterone synthase (CYP11B2) protein levels were measured using an ELISA and Western blots.

Results: In incubated colon tissues, aldosterone synthase levels were increased by a low-sodium diet; and by Ang II and DBA in the normal diet group. Release of aldosterone into the incubation buffer was increased from the colon by a low-sodium diet and decreased by a high-sodium diet in parallel with changes in aldosterone synthase levels. In mice fed a normal diet, colon incubation with both Ang II and DBA increased the release of aldosterone as well as its precursor corticosterone.

Conclusion: Local aldosterone synthesis in the large intestine is stimulated by a low-sodium diet, dibutyryl-cAMP and Ang II similar to the adrenal glands.

Keywords: Extra-adrenal aldosterone synthesis; aldosterone synthase CYP11B2; angiotensin II; cyclic AMP; ex vivo; intestinal aldosterone; liver receptor homolog-1.


Conflict of interest statement

Declaration of conflicting interest: The authors declare that there are no conflicts of interest.

Figures

Figure 1.
Figure 1.
Aldosterone (Aldo) concentration relative to the total protein amount in non-incubated intestinal samples of duodenum, jejunum and ileum of mice fed with a normal diet. Data presented as mean ± SEM; duodenum and jejunum, n = 6; ileum, n = 5, ***P < 0.005; between-group comparisons were undertaken using one-way analysis of variance followed by the Least Significant Difference test.
Figure 2.
Figure 2.
Liver receptor homolog-1 (LRH-1) concentration relative to the total protein amount in non-incubated intestinal tissue samples from three groups of mice fed diets with different concentrations of sodium (Na) during a 14-day study. Data presented as mean ± SEM; colon and caecum, n = 6; **P < 0.01, ***P < 0.005; between-group comparisons were undertaken using one-way analysis of variance followed by the Least Significant Difference test.
Figure 3.
Figure 3.
Corticosterone release into the incubation fluid from the colons of three groups of mice fed diets with different concentrations of sodium (Na) during a 14-day study: tissues incubated without (Control) or with either angiotensin II (Ang II; 1 μM) or dibutyryl-cAMP (DBA; 0.1 mM). The corticosterone concentrations in the incubation fluid were normalized relative to the total protein amount in incubated tissue samples. Data presented as mean ± SEM; n = 5–6/group; *P < 0.05; between-group comparisons were undertaken using one-way analysis of variance followed by the Least Significant Difference test.
Figure 4.
Figure 4.
Aldosterone synthase (CYP11B2) protein levels were measured using enzyme-linked immunosorbent assay and normalized relative to the total protein amount in the incubated colon and caecum tissue from three groups of mice fed diets with different concentrations of sodium (Na) during a 14-day study: tissues incubated without (Control) or with either angiotensin II (Ang II; 1 μM) or dibutyryl-cAMP (DBA; 0.1 mM). Data presented as mean ± SEM; n = 5–6/group; ***P < 0.005; between-group comparisons were undertaken using one-way analysis of variance followed by the Least Significant Difference test.
Figure 5.
Figure 5.
Aldosterone synthase (CYP11B2) protein levels were measured using Western blot analysis in the incubated colon tissue from three groups of mice fed diets with different concentrations of sodium (Na) during a 14-day study: tissues incubated without (Control) or with either angiotensin II (Ang II; 1 μM) or dibutyryl-cAMP (DBA; 0.1 mM). (a) Bands of CYP11B2 (green) and glyceraldehyde 3-phosphate dehydrogenase (GAPDH) (red) from the colon. GAPDH was utilized as a loading control. (b) Effects of Ang II and DBA in colon when the control group columns without stimulants were set as 1. Data presented as mean ± SEM; n = 5–6/group; *P < 0.05, **P < 0.01; between-group comparisons were undertaken using one-way analysis of variance followed by the Least Significant Difference test. The colour version of this figure is available at: http://imr.sagepub.com.
Figure 6.
Figure 6.
Aldosterone synthase (CYP11B2) protein levels were measured using Western blot analysis in the incubated caecum tissue from three groups of mice fed diets with different concentrations of sodium (Na) during a 14-day study: tissues incubated without (Control) or with either angiotensin II (Ang II; 1 μM) or dibutyryl-cAMP (DBA; 0.1 mM). (a) Bands of CYP11B2 (green) and glyceraldehyde 3-phosphate dehydrogenase (GAPDH) (red) from the caecum. GAPDH was utilized as a loading control. (b) Effects of Ang II and DBA in caecum when the control group columns without stimulants were set as 1. Data presented as mean ± SEM; n = 5–6/group; no significant between-group differences. The colour version of this figure is available at: http://imr.sagepub.com.
Figure 7.
Figure 7.
Aldosterone synthase (CYP11B2) protein levels were measured using Western blot analysis in the non-incubated adrenal glands from three groups of mice fed diets with different concentrations of sodium (Na) during a 14-day study. Bands of CYP11B2 (green) and glyceraldehyde 3-phosphate dehydrogenase (GAPDH) (red) from the adrenal glands. GAPDH was utilized as a loading control. The normal diet control group column was set as 1. The adrenal glands from six mice from each group were pooled as one single sample (n = 1). The colour version of this figure is available at: http://imr.sagepub.com.
Figure 8.
Figure 8.
Aldosterone synthase (CYP11B2) protein levels were measured using enzyme-linked immunosorbent assay and normalized relative to the total protein amount in the incubated non-stimulated colon and caecum tissue from three groups of mice fed diets with different concentrations of sodium (Na) during a 14-day study. Data presented as mean ± SEM; n = 5–6/group; ***P < 0.005; between-group comparisons were undertaken using one-way analysis of variance followed by the Least Significant Difference test.
Figure 9.
Figure 9.
Aldosterone levels released into the incubation fluid were measured using enzyme-linked immunosorbent assay and normalized relative to the total protein amount in the incubated colon and caecum tissue from three groups of mice fed diets with different concentrations of sodium (Na) during a 14-day study: tissues incubated without (Control) or with either angiotensin II (Ang II; 1 μM) or dibutyryl-cAMP (DBA; 0.1 mM). Data presented as mean ± SEM; n = 8–10/control group, n = 4–6/Ang II and DBA groups; *P < 0.05; *** P < 0.005; between-group comparisons were undertaken using one-way analysis of variance followed by the Least Significant Difference test.
Figure 10.
Figure 10.
Aldosterone levels released into the incubation fluid were measured using enzyme-linked immunosorbent assay and normalized relative to the total protein amount in the incubated non-stimulated colon and caecum tissues from three groups of mice fed diets with different concentrations of sodium (Na) during a 14-day study. Data presented as mean ± SEM; n = 8–10/group; *P < 0.05; **P < 0.01; ***P < 0.005; between-group comparisons were undertaken using one-way analysis of variance followed by the Least Significant Difference test.

Similar articles

Cited by

References

    1. Williams GH. Aldosterone biosynthesis, regulation, and classical mechanism of action. Heart Fail Rev 2005; 10: 7–13. - PubMed
    1. Henrion D, Benessiano J, Lévy BI. In vitro modulation of a resistance artery diameter by the tissue renin-angiotensin system of a large donor artery. Circ Res 1997; 80: 189–195. - PubMed
    1. Matsuzawa Y, Suematsu S, Saito J, et al.. Vascular aldosterone production at the pre-diabetic stage of young Otsuka Long-Evans Tokushima Fatty (OLETF) rats, compared with Long-Evans Tokushima Otsuka (LETO) rats. Molecules 2013; 18: 15636–15647. - PMC - PubMed
    1. Fujisaki M, Nagoshi T, Nishikawa T, et al.. Rapid induction of aldosterone synthesis in cultured neonatal rat cardiomyocytes under high glucose conditions. Biomed Res Int 2013; 2013: 161396. - PMC - PubMed
    1. Geerling JC, Loewy AD. Aldosterone in the brain. Am J Physiol Renal Physiol 2009; 297: F559–F576. - PMC - PubMed

LinkOut - more resources