. 2022 Aug;9(24):e2105320.
doi: 10.1002/advs.202105320. Epub 2022 Jun 24.

TMED3 Complex Mediates ER Stress-Associated Secretion of CFTR, Pendrin, and SARS-CoV-2 Spike

Affiliations

TMED3 Complex Mediates ER Stress-Associated Secretion of CFTR, Pendrin, and SARS-CoV-2 Spike

Hak Park et al. Adv Sci (Weinh). 2022 Aug.

Abstract

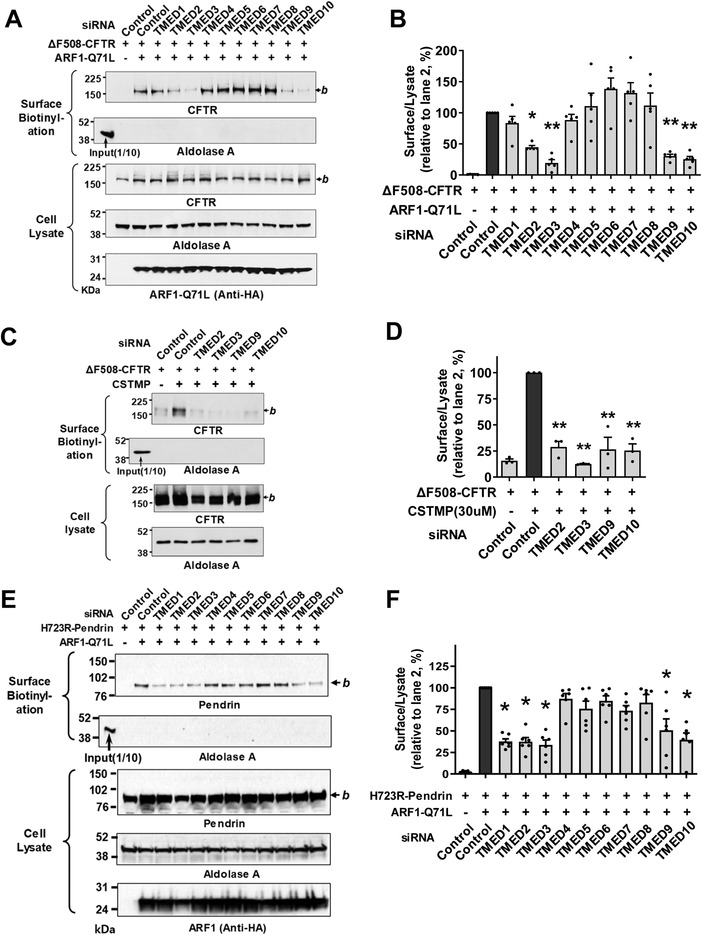
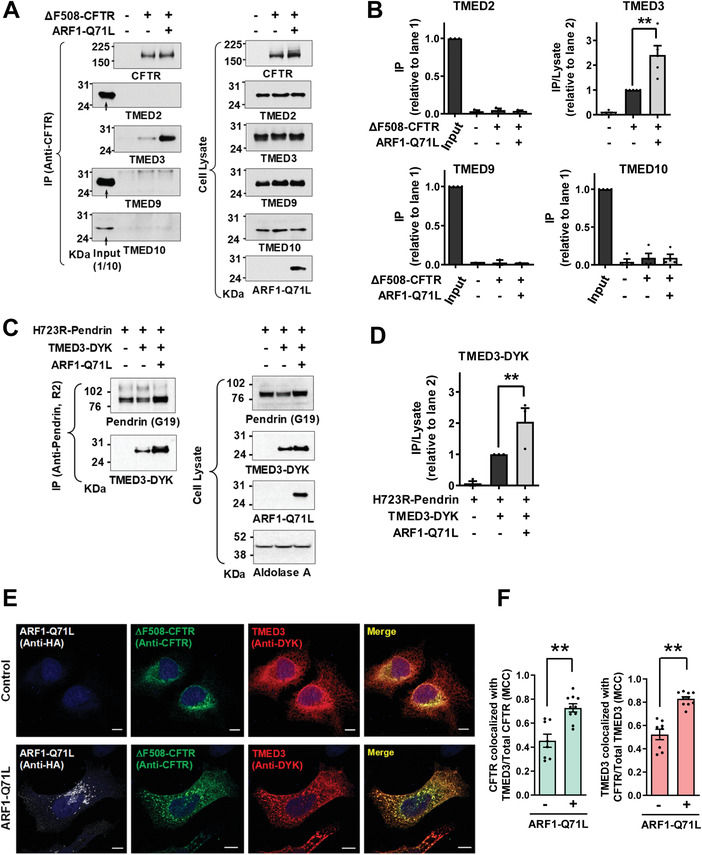
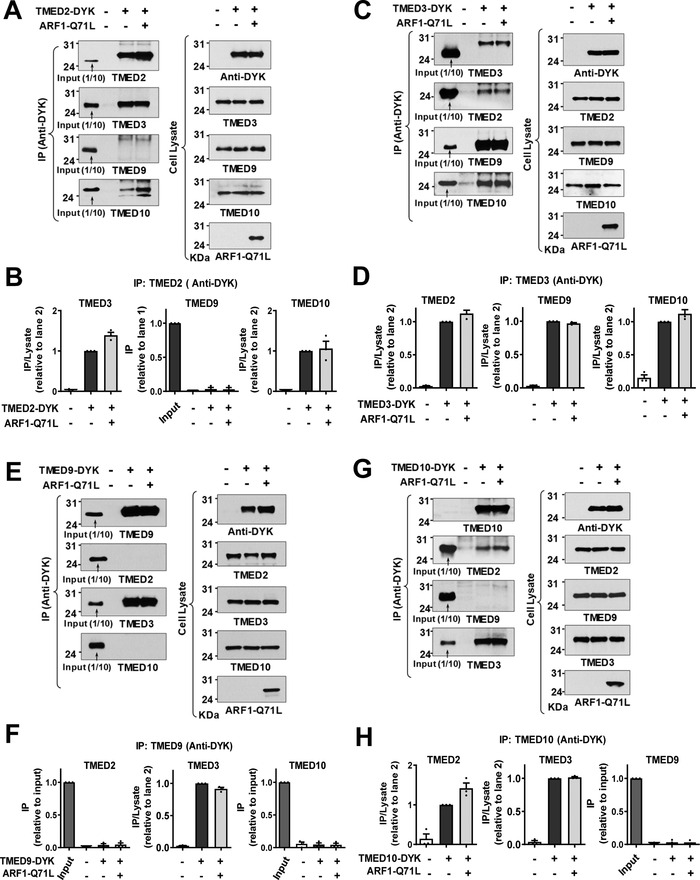
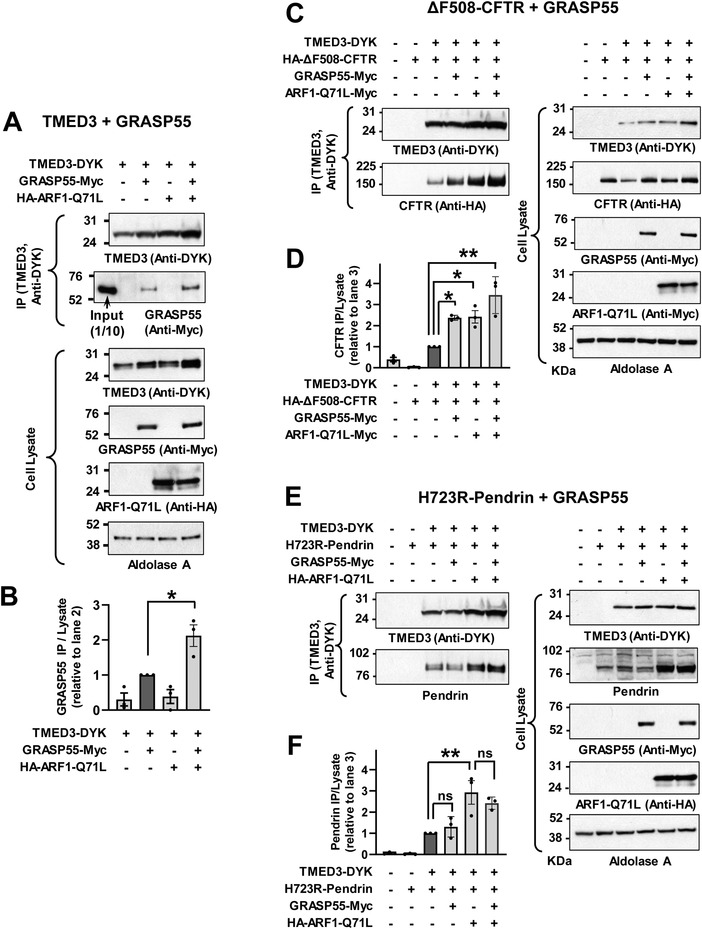
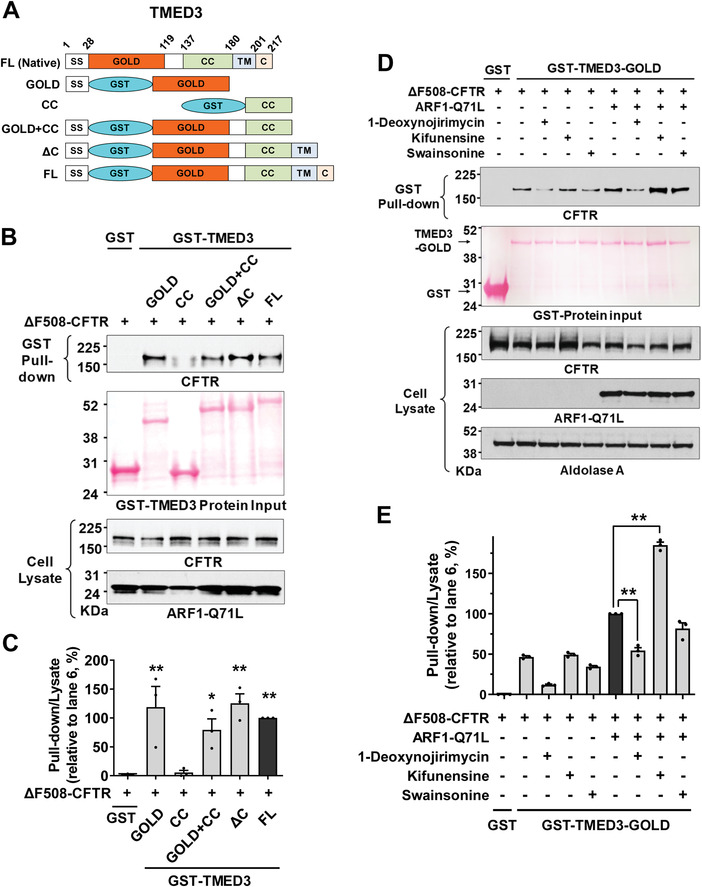
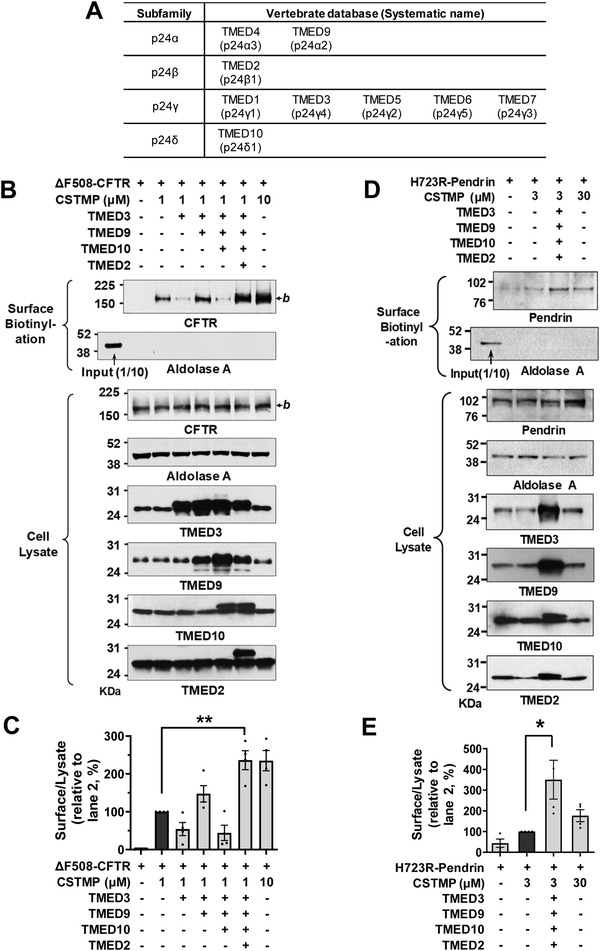
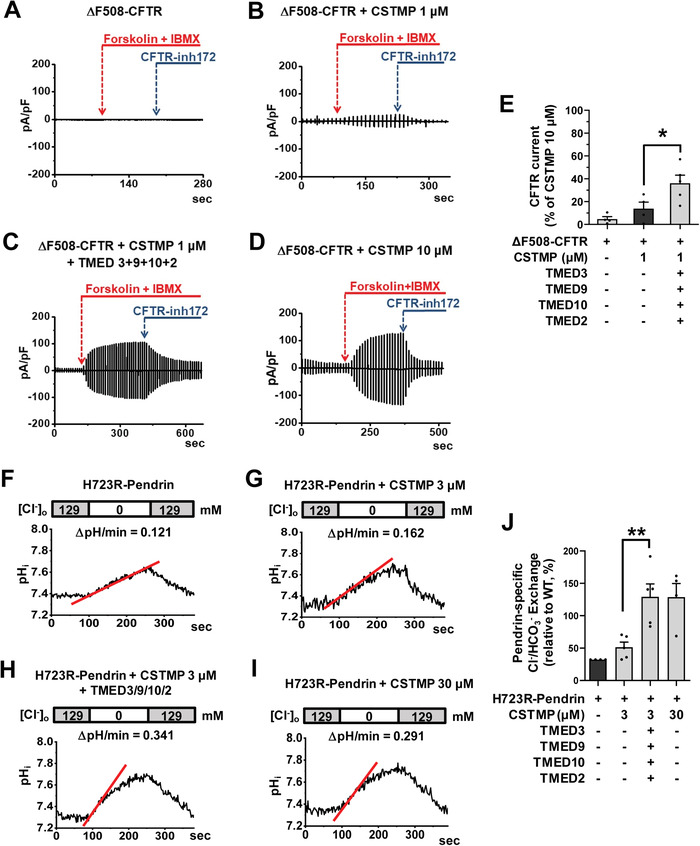
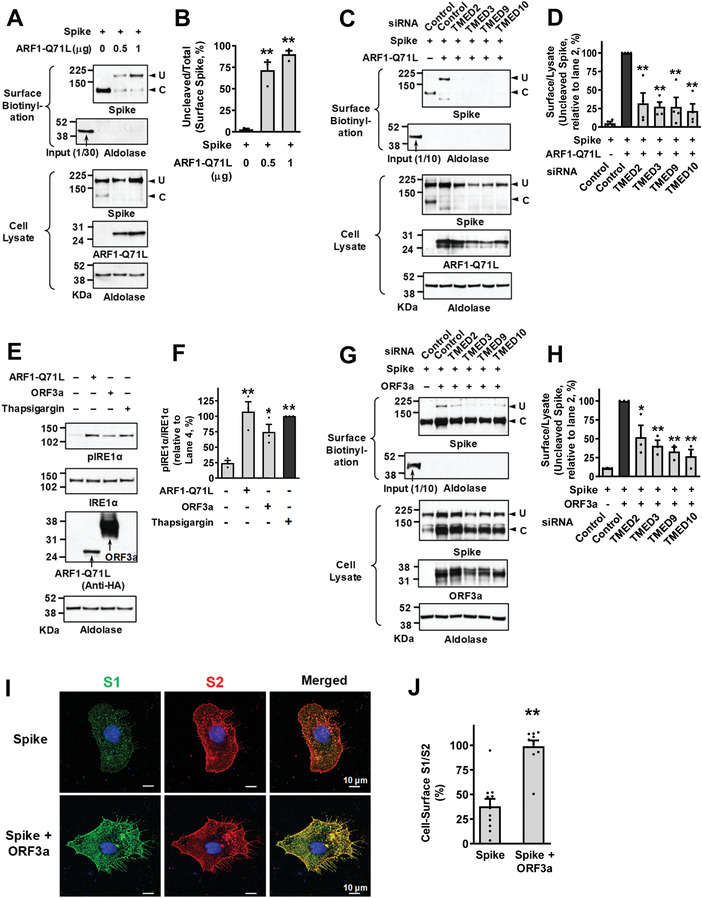
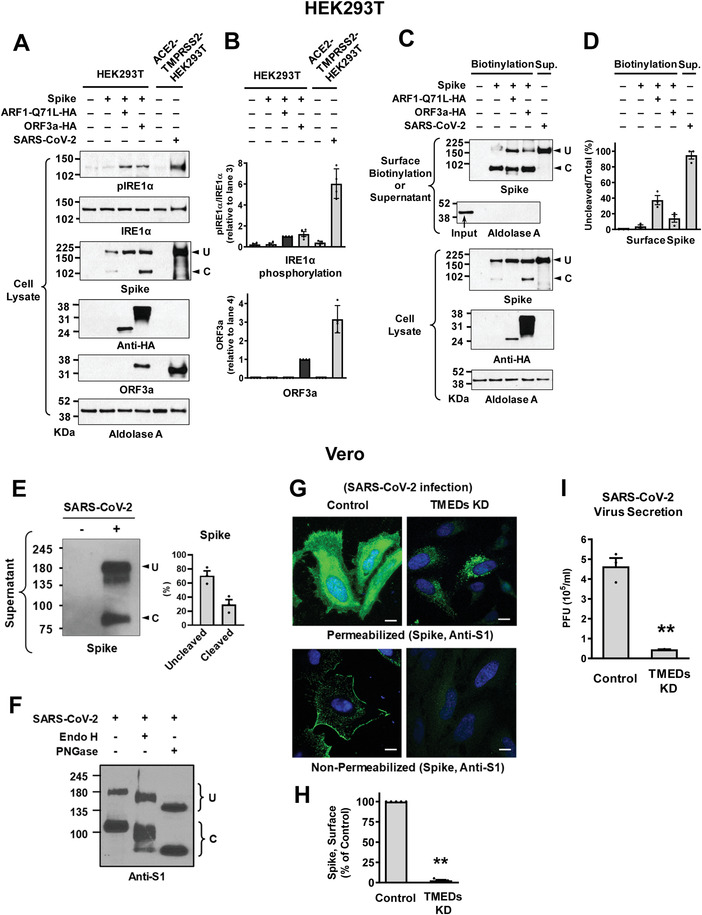
Under ER stress conditions, the ER form of transmembrane proteins can reach the plasma membrane via a Golgi-independent unconventional protein secretion (UPS) pathway. However, the targeting mechanisms of membrane proteins for UPS are unknown. Here, this study reports that TMED proteins play a critical role in the ER stress-associated UPS of transmembrane proteins. The gene silencing results reveal that TMED2, TMED3, TMED9 and TMED10 are involved in the UPS of transmembrane proteins, such as CFTR, pendrin and SARS-CoV-2 Spike. Subsequent mechanistic analyses indicate that TMED3 recognizes the ER core-glycosylated protein cargos and that the heteromeric TMED2/3/9/10 complex mediates their UPS. Co-expression of all four TMEDs improves, while each single expression reduces, the UPS and ion transport function of trafficking-deficient ΔF508-CFTR and p.H723R-pendrin, which cause cystic fibrosis and Pendred syndrome, respectively. In contrast, TMED2/3/9/10 silencing reduces SARS-CoV-2 viral release. These results provide evidence for a common role of TMED3 and related TMEDs in the ER stress-associated, Golgi-independent secretion of transmembrane proteins.

Keywords: CFTR; SARS-CoV-2 spike; TMED; UPS; pendrin.


Conflict of interest statement

The authors declare no conflict of interest.

Figures

Figure 1
Figure 1
TMED2, 3, 9, 10 are involved in the unconventional secretion of CFTR and pendrin. A,B) Effects of individual TMED gene silencing on the unconventional protein secretion (UPS) of ΔF508‐CFTR. The cell surface biotinylation assay was performed in HEK293 cells transfected with control (scrambled) or TMED‐specific siRNAs (100 nm each, 48 h) together with plasmids encoding ΔF508‐CFTR. ARF1‐Q71L was co‐expressed in some cells to induce UPS. Representative blots of surface biotinylation assays are shown in (A). The HA‐tagged ARF1‐Q71L was blotted with anti‐HA antibodies. Quantifications of multiple experiments are summarized in (B) (n = 5). C,D) Effects of TMED gene silencing were analyzed in HEK293 cells treated with the IRE1α kinase activator, (E)‐2‐(2‐chlorostyryl)‐3,5,6‐trimethyl‐pyrazine (CSTMP), to induce UPS. Representative blots are shown in (C) and the results of multiple experiments are summarized in (D) (n = 3). E,F) Effects of TMED gene silencing on the UPS of p.H723R‐pendrin. The cell surface biotinylation assay was performed in PANC‐1 cells transfected with plasmids encoding p.H723R‐pendrin. ARF1‐Q71L was co‐expressed in some cells to induce UPS. Representative blots of surface biotinylation assays are shown in (E). Quantifications of multiple experiments are summarized in (F) (n = 6). Bar graph data are shown as mean ± SEM. *p < 0.05, **p < 0.01: difference from lane 2. Data were analyzed using one‐way analysis of variance, followed by Tukey's multiple comparison test. b, core‐glycosylated CFTR, and pendrin.
Figure 2
Figure 2
TMED3 associates with CFTR and pendrin. A,B) Co‐immunoprecipitation (co‐IP) experiments between CFTR and TMED proteins (TMED2, TMED3, TMED9, and TMED10) were performed in HEK293 cells expressing ΔF508‐CFTR. Protein samples were precipitated with anti‐CFTR antibodies (M3A7) and blotted with antibodies against each TMED protein. Representative IP blots are shown in (A). Quantifications of multiple experiments are summarized in (B) (n = 3–5). CFTR associates with TMED3 but not with other TMEDs. C,D) Co‐IP experiments between pendrin and TMED3 were performed in PANC‐1 cells expressing p.H723R‐pendrin. Protein samples were precipitated with anti‐pendrin antibodies (R2) and blotted with antibodies against TMED3. Representative IP blots are shown in (C). Quantifications of multiple experiments are summarized in (D) (n = 3). Co‐IP results with TMED2, TMED9, and TMED10 are presented in Figure S3, Supporting Information. Pendrin associates with TMED3 but not with other TMEDs. E,F) Cellular localizations of TMED3 and ΔF508‐CFTR were analyzed using immunocytochemistry in HeLa cells with DYK‐ TMED3 expressions. CFTR was stained with anti‐CFTR and green fluorophore‐tagged antibodies and DYK‐TMED3 with anti‐DYK and red fluorophore‐tagged antibodies after permeabilization. Representative immunofluorescence images are shown in (E). Quantification of colocalization between TMED3 and CFTR using the Manders’ colocalization coefficient (MCC) is summarized in (F) (n = 8–10). Scale bar: 10 µm. Bar graph data are shown as mean ± SEM. **P < 0.01. Data were analyzed using one‐way analysis of variance, followed by Tukey's multiple comparison test (B,D) or a two‐tailed Student's t‐test (F).
Figure 3
Figure 3
TMED3 is the key protein in the assembly of TMED2/3/9/10 complex. A,B) Co‐immunoprecipitation (co‐IP) experiments were performed with anti‐DYK antibodies in HEK293 cells transfected with plasmids encoding DYK‐tagged TMED2 (TMED2‐DYK). ARF1‐Q71L was co‐expressed in some cells to induce UPS. Protein samples were blotted with antibodies against each labeled protein. Summarized results of multiple experiments are presented in (B) (n = 3). TMED2 associates with TMED3 and TMED10. C,D) Co‐IP experiments were performed with plasmids encoding DYK‐tagged TMED3 (TMED3‐DYK). Summarized results of multiple experiments are presented in (D) (n = 3). TMED3 associates with TMED2, TMED9, and TMED10. E,F) Co‐IP experiments were performed with plasmids encoding DYK‐tagged TMED9 (TMED9‐DYK). Summarized results of multiple experiments are presented in (F) (n = 3). TMED9 associates with TMED3 but not with other TMEDs. G,H) Co‐IP experiments were performed with plasmids encoding DYK‐tagged TMED10 (TMED10‐DYK). Summarized results of multiple experiments are presented in (H) (n = 3). TMED10 associates with TMED2 and TMED3. Data are shown as mean ± SEM.
Figure 4
Figure 4
GRASP55 interacts with TMED3 and augments TMED3‐CFTR interaction but not TMED3‐pendrin interaction. A,B) Co‐immunoprecipitation (co‐IP) experiments with TMED3 and GRASP55 were performed with anti‐DYK antibodies in HEK293 cells transfected with plasmids encoding DYK‐tagged TMED3 (TMED3‐DYK) alone or those with GRASP55 (GRASP55‐Myc). ARF1‐Q71L was co‐expressed in some cells to induce UPS. Representative blot images are shown in (A) and summarized results of multiple experiments are presented in (B) (n = 3). ARF1‐Q71L enhanced interaction between TMED3 and GRASP55. C,D) Co‐IP experiments with TMED3 and ΔF508‐CFTR were performed with HA‐tagged ΔF508‐CFTR expression. GRASP55 and/or ARF1‐Q71L were co‐expressed in some cells. Representative blot images are shown in (C) and summarized results of multiple experiments are presented in (D) (n = 3). GRASP55 augmented the association between TMED3 and ΔF508‐CFTR. E,F) Co‐IP experiments with TMED3 and p.H723R‐pendrin were performed in PANC‐1 cells. GRASP55 and/or ARF1‐Q71L were co‐expressed in some cells. Representative blot images are shown in (E) and summarized results of multiple experiments are presented in (F) (n = 3). ARF1‐Q71L, but not GRASP55, increased the interaction between TMED3 and p.H723R‐pendrin. Bar graph data are shown as mean ± SEM. Data were analyzed using one‐way analysis of variance, followed by Tukey's multiple comparison test. **p < 0.01, ns: not significant.
Figure 5
Figure 5
The GOLD domain of TMED3 binds to N‐glycosylated CFTR. A–C) Pull‐down assays were performed with domain‐specific GST‐fused TMED3 proteins (100 µg) and cell lysates extracted from HEK293 cells expressing HA‐tagged CFTR (400 µg). Schematic diagrams of GST‐tagged TMED3 proteins are depicted in (A). The input GST‐fused recombinant proteins were visualized using Ponceau S staining and CFTR was immunoblotted with anti‐HA antibodies. Representative pull‐down assays are shown in (B) and the results of multiple experiments are summarized in (C) (n = 3). The GOLD domain of TMED3 interacts with CFTR. **p < 0.01: difference from lane 1. D,E) Effects of glucosidase and mannosidase inhibitors on the interaction between TMED3 and ΔF508‐CFTR. Pull‐down assays were performed using recombinant GST‐fused TMED3‐GOLD (GST‐TMED3‐GOLD) and cell lysates prepared from HEK293 cells expressing ΔF508‐CFTR treated with the ER α‐glucosidase I and II inhibitor 1‐deoxynojirimycin (100 µm), ER mannosidase I inhibitor kifunensine (10 µm), or Golgi mannosidase II inhibitor swainsonine (100 µm). ARF1‐Q71L was co‐expressed in some cells to induce UPS. Representative pull‐down assays are shown in (D) and results of multiple experiments are summarized in (E) (n = 3). The inhibition of ER α‐glucosidase reduces the TMED3‐CFTR interaction; but the inhibition of ER mannosidase increases the TMED3‐CFTR interaction. Bar graph data are shown as mean ± SEM. **p < 0.01. Data were analyzed using one‐way analysis of variance, followed by Tukey's multiple comparison test.
Figure 6
Figure 6
Potentiation of CFTR and pendrin UPS by TMED upregulation. A) Classification of vertebrate TMED subfamilies, also known as p24 proteins. B,C) The effects of exogenous expression of TMED proteins (TMED2, 3, 9, and 10) on the CSTMP‐induced UPS of ΔF508‐CFTR were examined using the surface biotinylation assay. Representative blots are shown in (B) and results of multiple experiments are summarized in (C) (n = 4). Co‐expression of all four TMEDs significantly increased a low‐dose (1 μ m) CSTMP‐induced ΔF508‐CFTR UPS. D,E) The effects of exogenous expression of TMED proteins (TMED2, 3, 9, and 10) on the CSTMP‐induced UPS of p.H723R‐pendrin were examined using the surface biotinylation assay. Representative blots are shown in (D) and results of multiple experiments are summarized in (E) (n = 4). Co‐expression of all four TMEDs significantly increased a low‐dose (3 μ m) CSTMP‐induced p.H723R‐pendrin UPS. Bar graph data are shown as mean ± SEM. *p < 0.05, **p < 0.01. Data were analyzed using one‐way analysis of variance, followed by Tukey's multiple comparison test.
Figure 7
Figure 7
Functional rescue of ΔF508‐CFTR and p.H723R‐pendrin by TMED upregulation. A–E) Cl currents were measured with co‐expression of TMEDs in cells expressing ΔF508‐CFTR. The CFTR‐mediated currents were activated by cAMP treatment (forskolin and 3‐isobutyl‐1‐methylxanthine [IBMX]) and inhibited by CFTRinh‐172 (10 µm). Representative current recordings and IV curves are shown in (A–D) and Figure S8A–D, Supporting Information, respectively. The results of multiple experiments are summarized in (E) (n = 4–5). Co‐expression of TMED2, 3, 9, and 10 significantly increased CFTR Cl currents in cells treated with a low dose (1 µm) CSTMP. F–J) The pendrin‐specific Cl o/HCO3 i exchange activity was measured by recording pHi, as detailed in Figure S8E–G, Supporting Information. Representative anion exchange measurements are shown in (F–I) and the quantifications of multiple experiments are depicted in (J) (n = 4–5). Co‐expression of TMED2, 3, 9, and 10 significantly increased the pendrin‐specific anion exchange activity in cells treated with a low dose (3 µm) CSTMP. Bar graph data are shown as mean ± SEM. *p < 0.05, **p < 0.01. Data were analyzed using one‐way analysis of variance, followed by Tukey's multiple comparison test.
Figure 8
Figure 8
TMEDs mediate ER stress‐associated secretion of SARS‐CoV‐2 Spike. A,B) The ER‐to‐Golgi blockade induces UPS of SARS‐CoV‐2 Spike (S). The cell surface expression of uncleaved (U) and cleaved (C) S proteins was analyzed using the surface biotinylation assays in HEK293 cells. Plasmids encoding ARF1‐Q71L (0.5 or 1 μg) were transfected to induce ER‐to‐Golgi blockade. Representative surface biotinylation assays are shown in (A) and the results of multiple experiments are summarized in (B) (n = 3). C,D) Silencing of TMED2, TMED3, TMED9, and TMED10 inhibits ARF1‐Q71L‐induced UPS of S. The effects of TMED gene silencing (100 nm each, 48 h) on the cell surface expression of S were analyzed. Representative blots of surface biotinylation assays are shown in (C) and the results of multiple experiments are summarized in (D) (n = 4). E,F) The SARS‐CoV‐2 ORF3a induces ER stress. Phosphorylation of IRE1α, a marker of ER stress, was analyzed in HEK293 cells transfected with ARF1‐Q71L and ORF3a (24 h). Thapsigargin (2 µm, 6 h) was used as a positive control to induce ER stress. Representative immunoblots are shown in (E) and the results of multiple experiments are summarized in (F) (n = 3). G,H) Silencing of TMED2, TMED3, TMED9, and TMED10 inhibits ORF3a‐induced UPS of S. The effects of TMED gene silencing (100 nm each, 48 h) on the cell surface expression of S were analyzed with co‐expression of SARS‐CoV‐2 ORF3a. Representative blots of surface biotinylation assays are shown in (G) and the results of multiple experiments are summarized in (H) (n = 3). I,J) The cell surface expression of the S1 (green) and S2 (red) fragments of S proteins was analyzed using immunocytochemistry in HeLa cells with co‐expression of ORF3a. Representative immunocytochemistry images are shown in (I) and the results of multiple experiments are summarized in (J) (n = 10–11). Bar graph data are shown as mean ± SEM. *p < 0.05, **p < 0.01. Data were analyzed using one‐way analysis of variance, followed by Tukey's multiple comparison test (B,D,F,H) or a two‐tailed Student's t‐test (J).
Figure 9
Figure 9
Trafficking of S in the authentic SARS‐CoV‐2 viruses. A,B) IRE1α phosphorylation and ORF3a expression were analyzed in HEK293T cells transfected with the indicated plasmids (lanes 1–4) or those with authentic SARS‐CoV‐2 infection (lane 6). HEK293T cells stably expressing ACE2 and TMPRSS2 (ACE2‐TMPRSS2‐HEK293T) were used for the SARS‐CoV‐2 infection. Representative immunoblots detected with anti‐phospho IRE1α or anti‐ORF3a are shown in (A) and the results of multiple experiments are summarized in (B) (n = 3–4). The authentic SARS‐CoV‐2 virus infection evoked higher levels of ORF3a expression and IRE1α phosphorylation than the ORF3a plasmid transfection. C,D) The expression of SARS‐CoV‐2 S in the cell surface or viral particle was analyzed. The cell surface biotinylation was performed in HEK293T cells transfected with the indicated plasmids (Biotinylation). The SARS‐CoV‐2 virions were harvested from the supernatant of infected ACE2‐TMPRSS2‐HEK293T cells (Sup). Representative immunoblots are shown in (C) and the results of multiple experiments are summarized in (D) (n = 4). The SARS‐CoV‐2 virions contain a higher level of uncleaved S. E) The amounts of uncleaved (U) and cleaved (C) S in the SARS‐CoV‐2 virus particles were analyzed. Proteins samples harvested from the supernatant of infected Vero cell cultures (SARS‐CoV‐2 KUMC‐2, GISAID accession#: EPI_ISL_413 018; 0.01 MOI, 48 h) were blotted with antibodies against the S2 subunit. Representative immunoblots and the results of multiple experiments are summarized in (E) (n = 3). The authentic SARS‐CoV‐2 virions contained >50% uncleaved S. F) The glycosylation status of S was analyzed via digestion with endoglycosidase H (Endo H) and N‐glycosidase F (PNGase F). SARS‐CoV‐2 contains partially Endo H‐sensitive, hybrid types of N‐glycans. Results shown are representative of three independent experiments. G,H) Cell localization of S was analyzed using immunocytochemistry in permeabilized and non‐permeabilized Vero cells infected with SARS‐CoV‐2 (10 h post‐infection). Quantification of cell surface intensity of S is summarized in (H) (n = 5). Scale bar: 10 µm. I) Viral RNA in cell culture supernatant was analyzed using quantitative PCR. Vero cells were infected with 0.01 MOI SARS‐CoV‐2, then culture supernatant was harvested at 24 h post‐infection. Bar graph data are shown as mean ± SEM. **p < 0.01. Data were analyzed using a two‐tailed Student's t‐test (H,I).

References

    1. Gee H. Y., Kim J., Lee M. G., Semin. Cell Dev. Biol. 2018, 83, 59. - PubMed
    1. Malhotra V., EMBO J. 2013, 32, 1660. - PMC - PubMed
    1. Rabouille C., Trends Cell Biol. 2017, 27, 230. - PubMed
    1. Gee H. Y., Noh S. H., Tang B. L., Kim K. H., Lee M. G., Cell 2011, 146, 746. - PubMed
    1. Jung J., Kim J., Roh S. H., Jun I., Sampson R. D., Gee H. Y., Choi J. Y., Lee M. G., Nat. Commun. 2016, 7, 11386. - PMC - PubMed

MeSH terms

Substances