. 2022 Dec;260(12):3799-3807.
doi: 10.1007/s00417-022-05697-4. Epub 2022 Jun 24.

Correlation between change in central subfield thickness and change in visual acuity in macular edema due to retinal vein occlusion: post hoc analysis of COPERNICUS, GALILEO, and VIBRANT

Affiliations

Correlation between change in central subfield thickness and change in visual acuity in macular edema due to retinal vein occlusion: post hoc analysis of COPERNICUS, GALILEO, and VIBRANT

Sophie Z Gu et al. Graefes Arch Clin Exp Ophthalmol. 2022 Dec.

Abstract

Purpose: Assess correlation between change in central subfield thickness (CST) and change in best-corrected visual acuity (BCVA) in eyes with macular edema due to retinal vein occlusion (RVO) that received intravitreal aflibercept injections (IAI).

Methods: Post hoc analysis of COPERNICUS and GALILEO trials for CRVO and VIBRANT trial for BRVO with relationships determined using Pearson correlation coefficient.

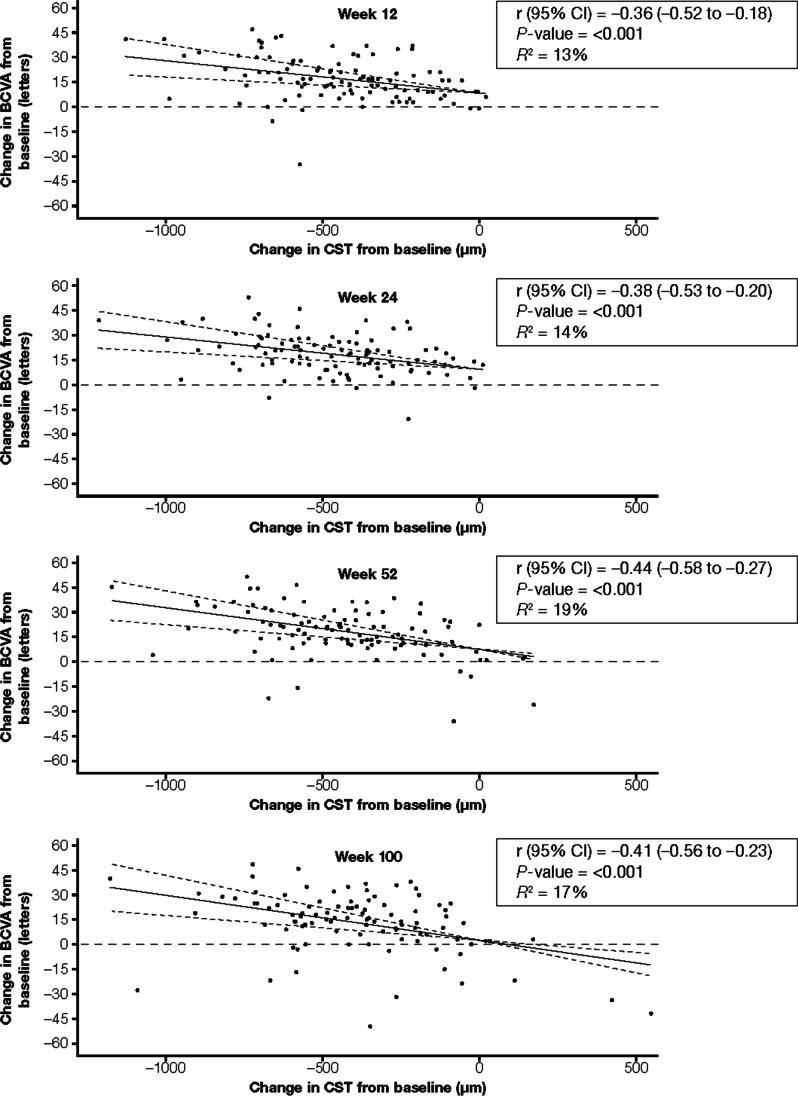
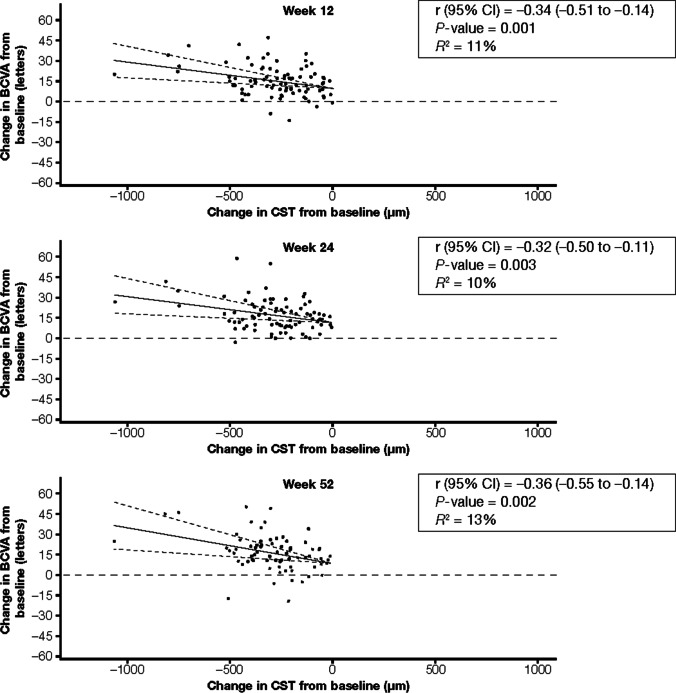
Results: In COPERNICUS, correlations (r) between change in CST and change in BCVA from baseline at weeks 12, 24, 52, and 100 were -0.36 (95% CI: -0.52, -0.18; P < 0.001), -0.38 (95% CI: -0.53, -0.20; P < 0.001), -0.44 (95% CI: -0.58, -0.27; P < 0.001), and -0.41 (95% CI: -0.56, -0.23; P < 0.001), respectively. CST changes accounted for only 21% of the variance in BCVA changes; every 100-µm decrease in CST was associated with a 2.1-letter increase in BCVA (P = 0.003). Similar findings were noted for GALILEO (r, -0.45 to -0.23) and VIBRANT (r, -0.36 to -0.32) trials.

Conclusion: In eyes treated with IAI for macular edema due to RVO, correlation between change in CST and change in BCVA was weak to moderate. While change in CST may be helpful in determining the need for anti-VEGF therapy, these findings do not support using changes in CST as a surrogate for changes in visual acuity outcomes.

Keywords: Central subfield thickness; Macular edema; Retinal vein occlusion; Visual acuity.


Conflict of interest statement

SZG, none; ON, none; SBB, grants to Johns Hopkins University School of Medicine from Amgen, Bayer, Biocon, Biogen, Boehringer-Ingleheim Pharma GmbH & Co., Genentech (Roche), Eyepoint, Mylan Inc, Notal Vision, Novartis, and Regeneron; WD, employment with and stock ownership in Regeneron Pharmaceuticals, Inc.; FA, employment with and stock ownership in Regeneron Pharmaceuticals, Inc.; HM, employment with and stock ownership in Regeneron Pharmaceuticals, Inc.; NMB, grants to Johns Hopkins University from Bayer, Biogen, Genentech (Roche), Novartis, Regeneron, and Samsung Bioepis and contract with AMA as Editor in Chief of JAMA Ophthalmology.

Figures

Fig. 1
Fig. 1
Correlations between changes in CST and changes in BCVA from baseline in the IAI group in the COPERNICUS trial. Solid lines indicate the correlation line, and dashed lines indicate the 95% CIs. In COPERNICUS, patients with macular edema secondary to CRVO received IAI 2q4 or sham injections every 4 weeks through week 24, for a total of six doses. From weeks 24 to 100, all study patients received IAI pro re nata (PRN) based on prespecified re-treatment criteria. 2q4, 2 mg every 4 weeks; 2q8, 2 mg every 8 weeks; BCVA, best-corrected visual acuity; CI, confidence interval; CST, central subfield thickness; IAI, intravitreal aflibercept injection; PRN, pro re nata; r, correlation; R.2, coefficient of determination
Fig. 2
Fig. 2
Correlations between changes in CST and changes in BCVA from baseline in the IAI group in the VIBRANT trial. Solid lines indicate the correlation line, and dashed lines indicate the 95% CIs. In VIBRANT, patients with macular edema secondary to BRVO received either laser at baseline or IAI 2q4 from baseline through week 24. Both treatment groups received IAI 2q8 from week 24 through week 52. 2q4, 2 mg every 4 weeks; 2q8, 2 mg every 8 weeks; BCVA, best-corrected visual acuity; CI, confidence interval; CST, central subfield thickness; IAI, intravitreal aflibercept injection; r, correlation; R.2, coefficient of determination

References

    1. Kriechbaum K, Michels S, Prager F, Georgopoulos M, Funk M, Geitzenauer W, Schmidt-Erfurth U. Intravitreal Avastin for macular oedema secondary to retinal vein occlusion: a prospective study. Br J Ophthalmol. 2008;92:518–522. doi: 10.1136/bjo.2007.127282. - DOI - PubMed
    1. Hoeh AE, Ach T, Schaal KB, Scheuerle AF, Dithmar S. Long-term follow-up of OCT-guided bevacizumab treatment of macular edema due to retinal vein occlusion. Graefes Arch Clin Exp Ophthal. 2009;247:1635. doi: 10.1007/s00417-009-1151-1. - DOI - PubMed
    1. Hoeh AE, Ruppenstein M, Ach T, Dithmar S. OCT patterns of macular edema and response to bevacizumab therapy in retinal vein occlusion. Graefes Arch Clin Exp Ophthalmol. 2010;248:1567–1572. doi: 10.1007/s00417-010-1419-5. - DOI - PubMed
    1. Moon CH, Ahn SI, Ohn YH, Kwak HW. Park TK (2013) Visual prognostic value of photopic negative response and optical coherence tomography in central retinal vein occlusion after anti-VEGF treatment. Doc Ophthalmol. 2013;126:211–219. doi: 10.1007/s10633-013-9379-9. - DOI - PubMed
    1. Fujihara-Mino A, Mitamura Y, Inomoto N, Sano H, Akaiwa K. Semba K (2016) Optical coherence tomography parameters predictive of visual outcome after anti-VEGF therapy for retinal vein occlusion. Clin Ophthalmol. 2016;10:1305. doi: 10.2147/OPTH.S110793. - DOI - PMC - PubMed

Substances

LinkOut - more resources