. 2022 Jun 24:11:e77490.
doi: 10.7554/eLife.77490.

Tongue immune compartment analysis reveals spatial macrophage heterogeneity

Affiliations

Tongue immune compartment analysis reveals spatial macrophage heterogeneity

Ekaterini Maria Lyras et al. Elife. .

Abstract

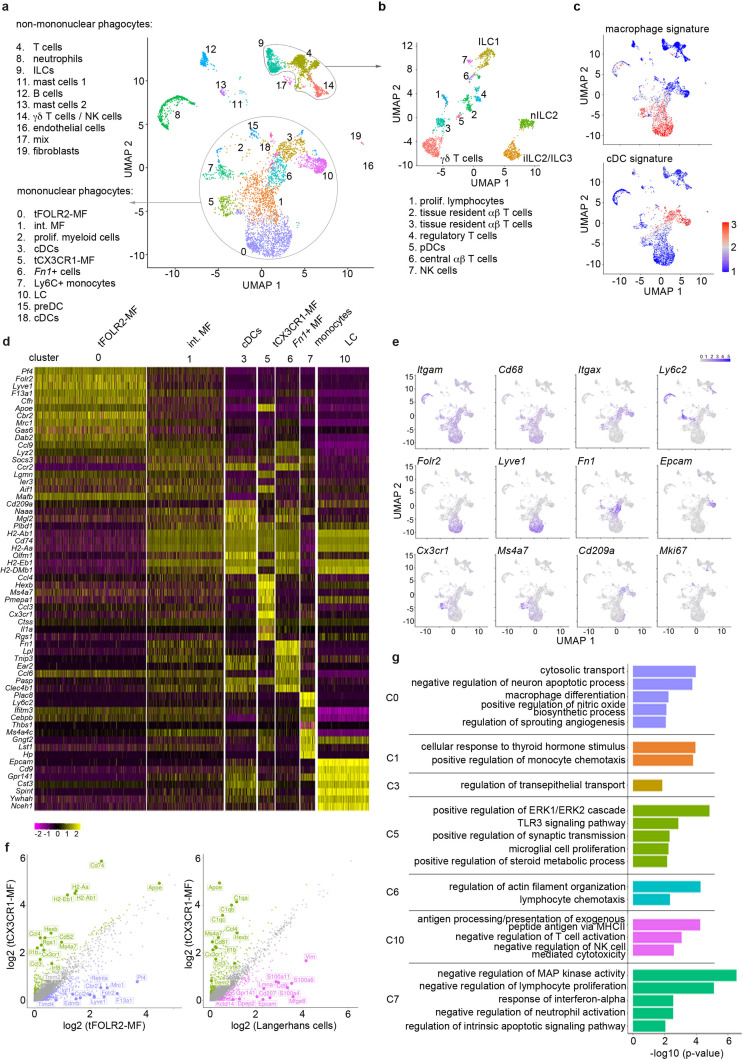
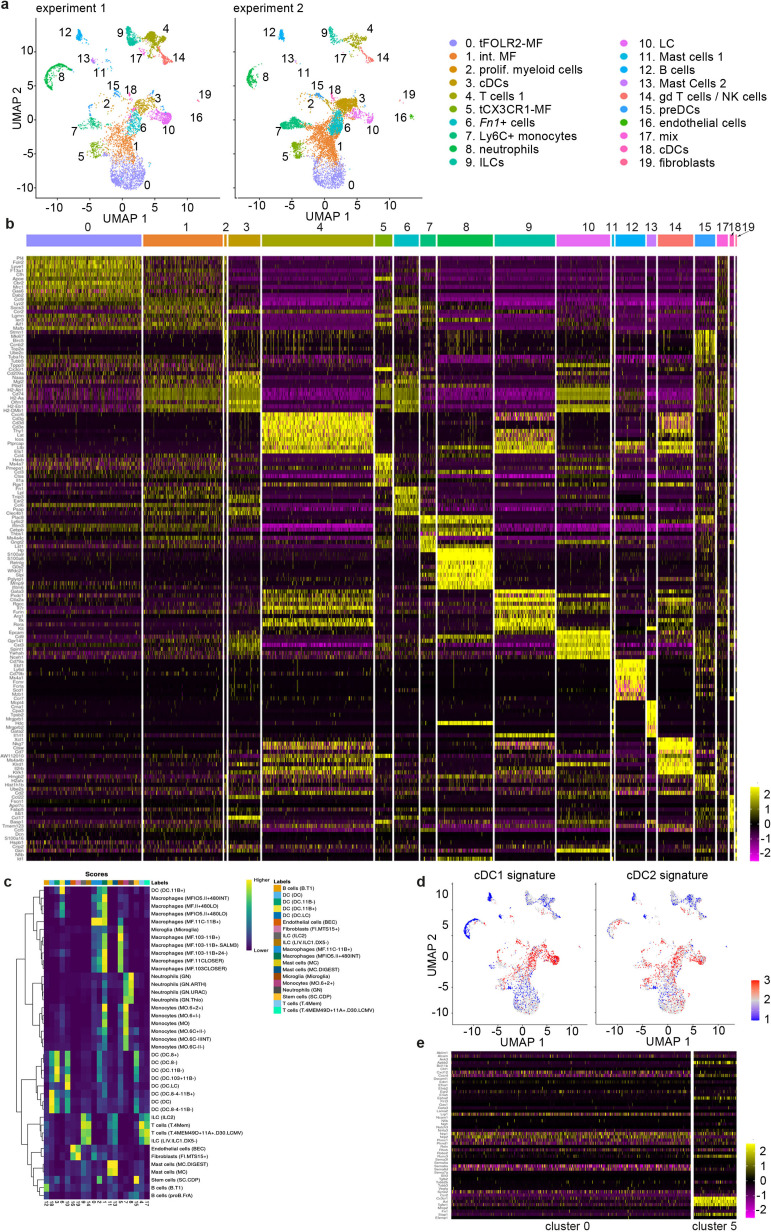
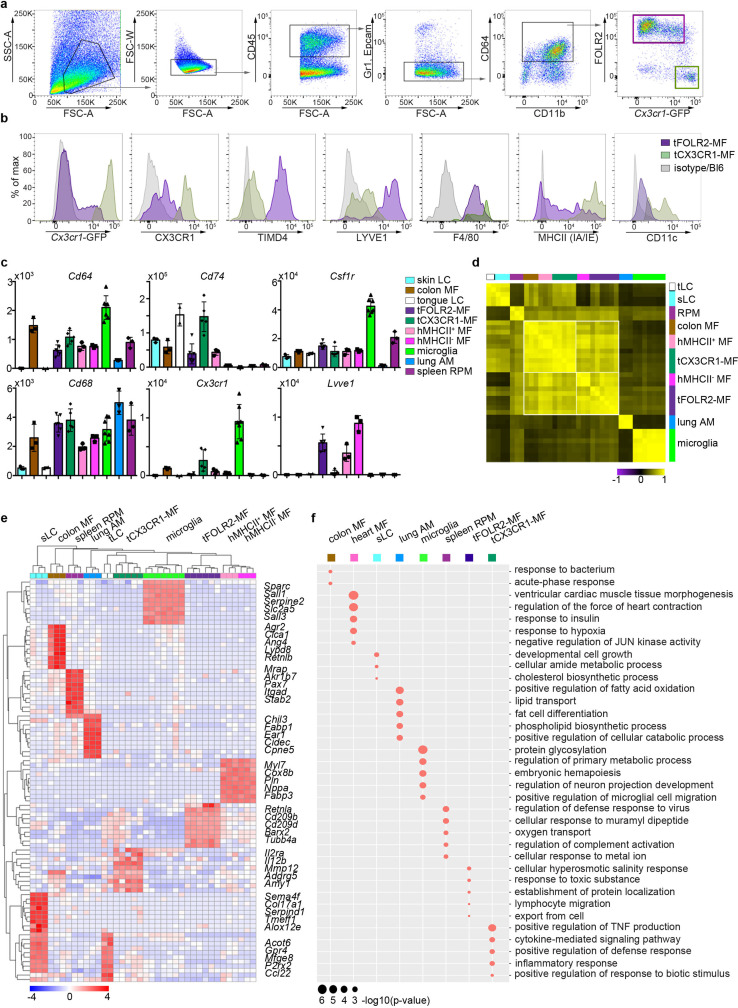
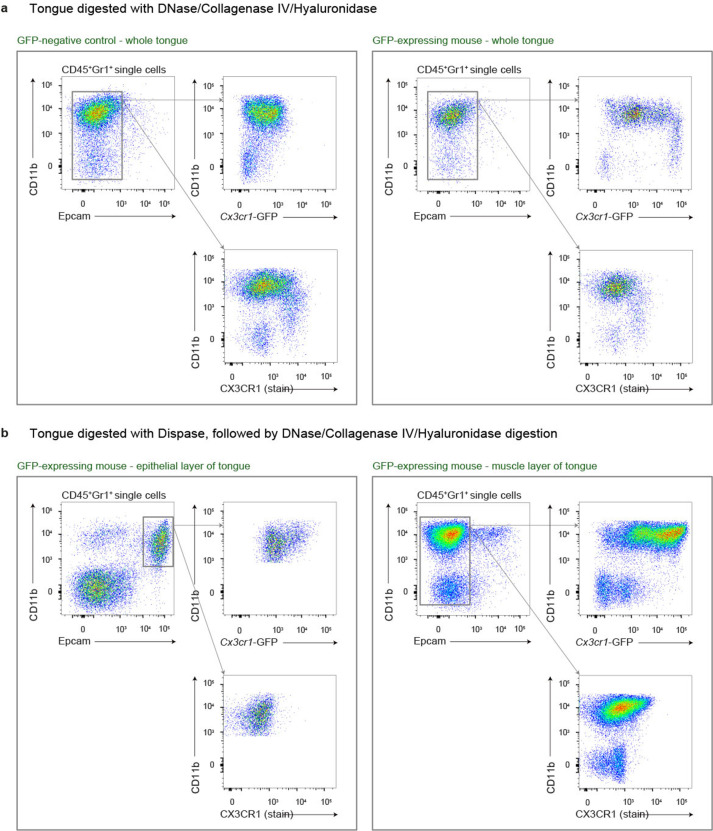
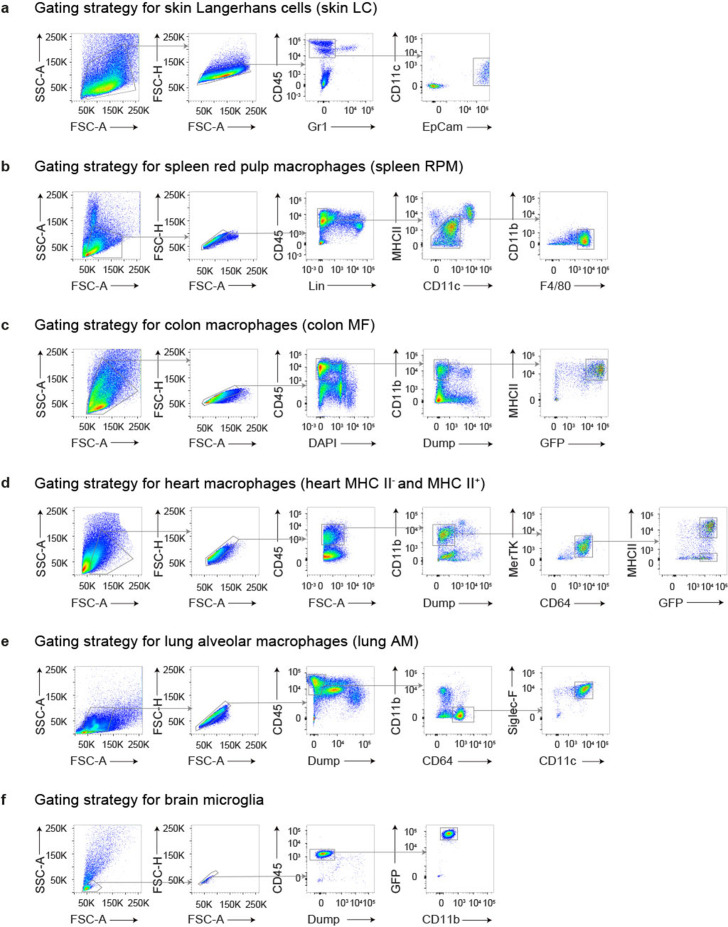
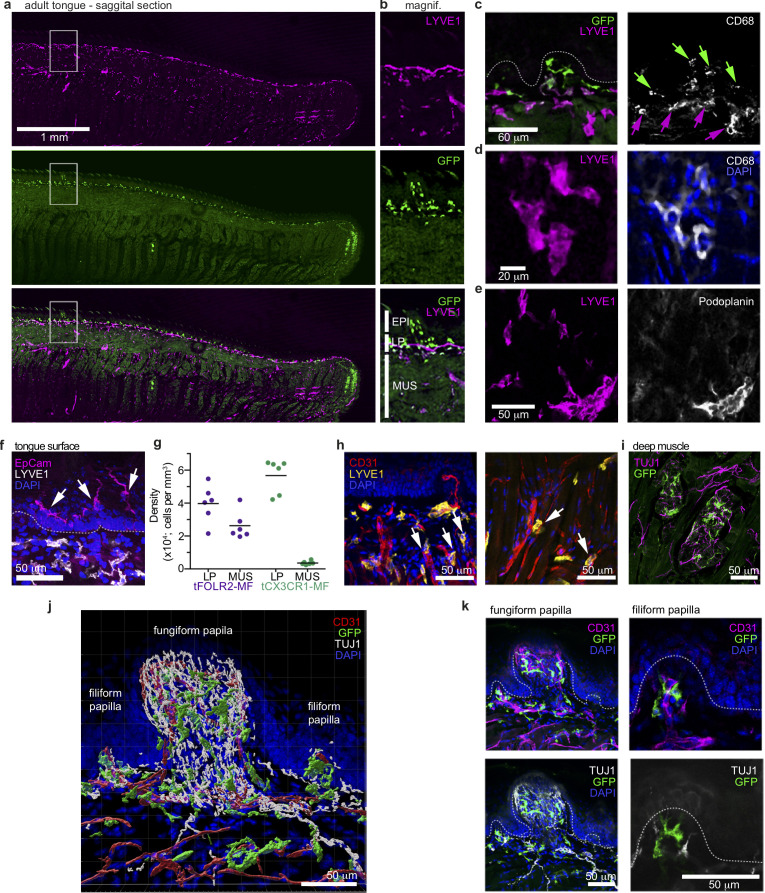
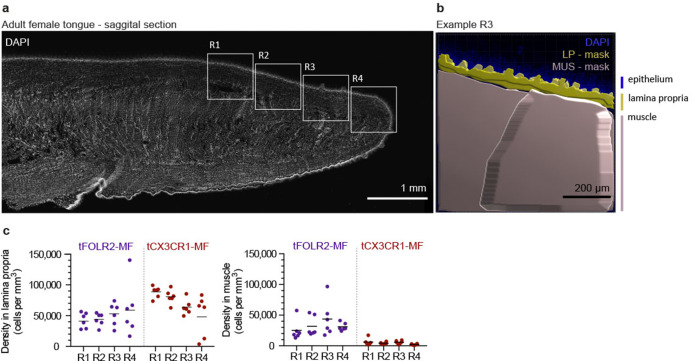
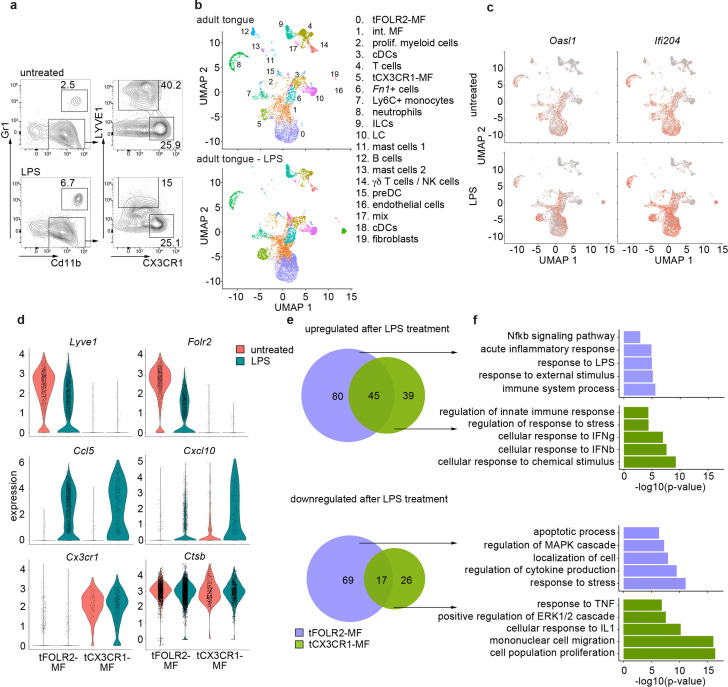
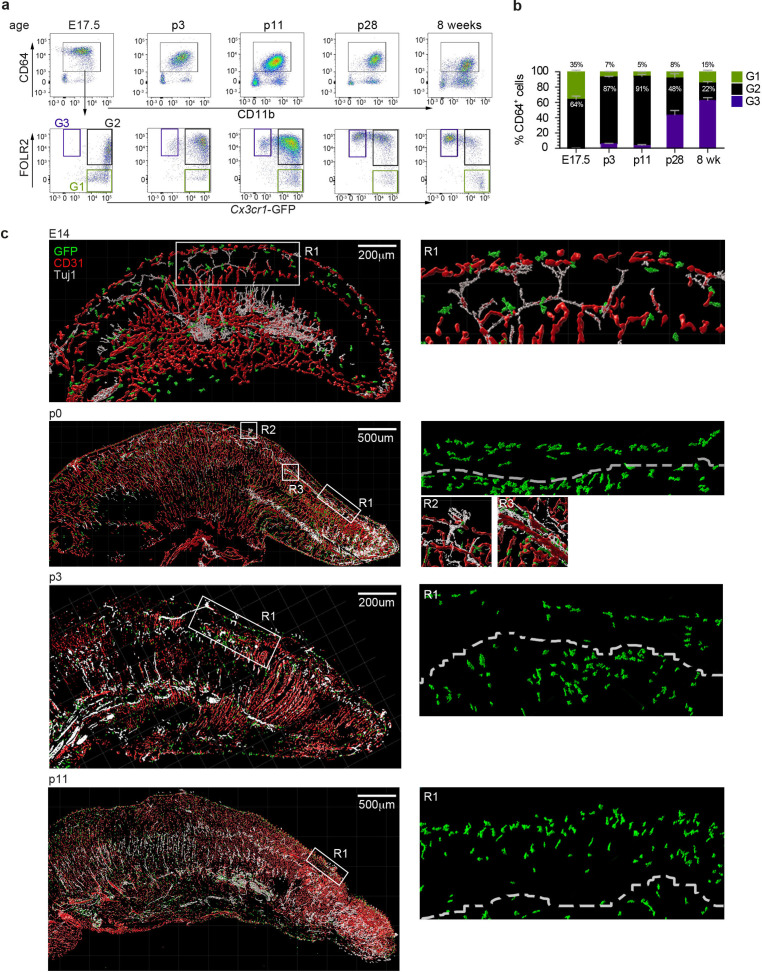
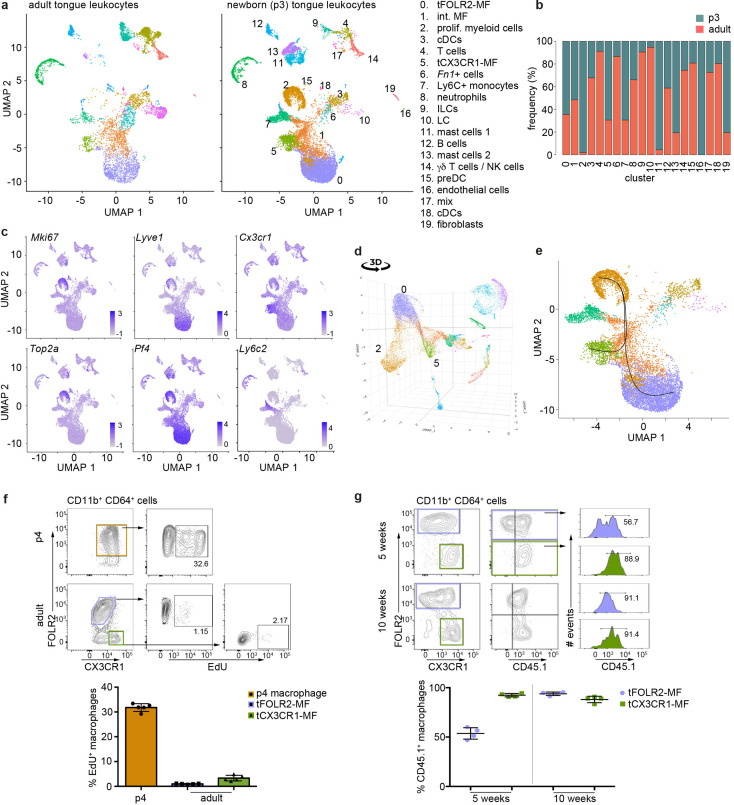
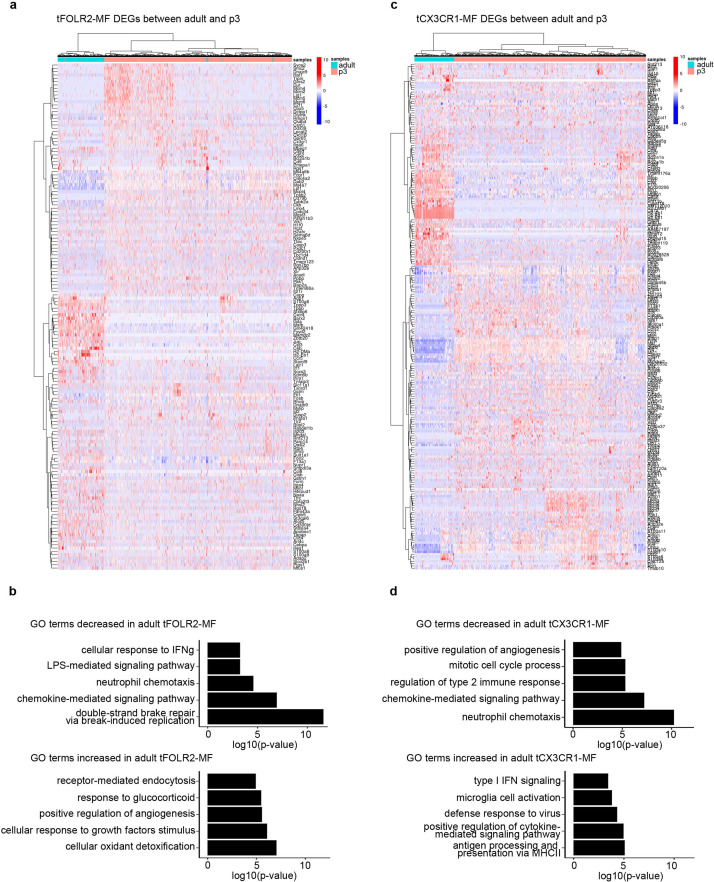
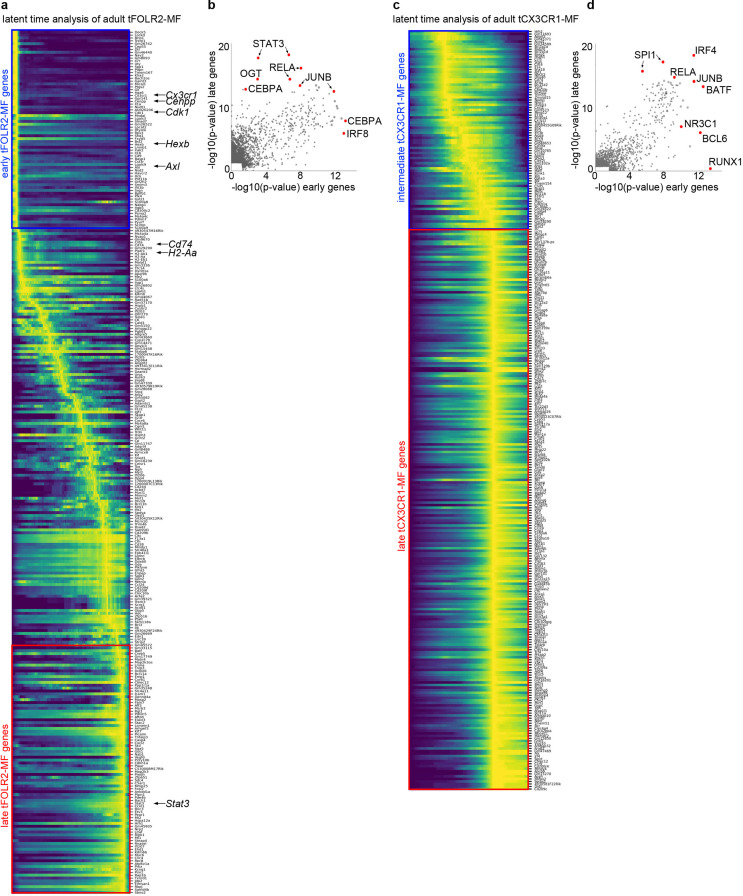
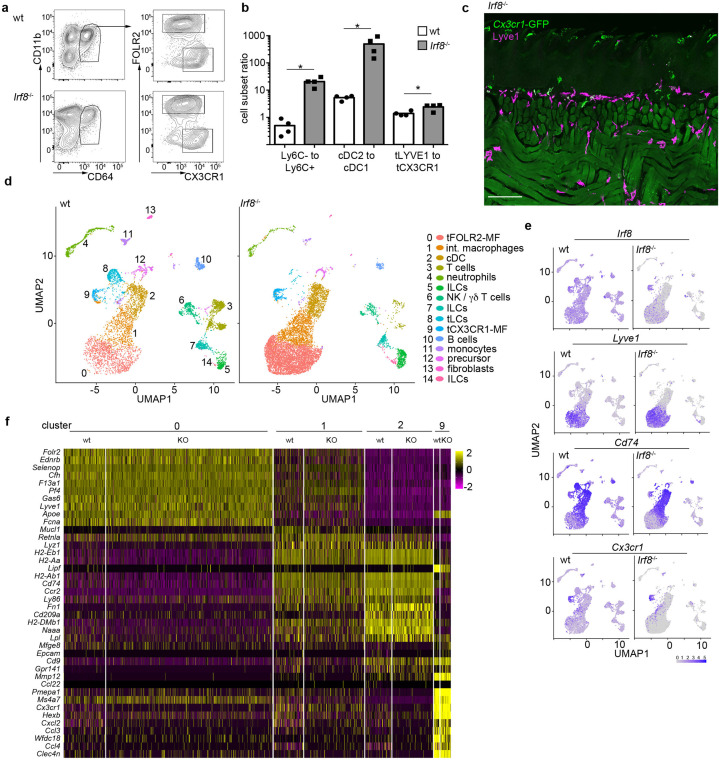
The tongue is a unique muscular organ situated in the oral cavity where it is involved in taste sensation, mastication, and articulation. As a barrier organ, which is constantly exposed to environmental pathogens, the tongue is expected to host an immune cell network ensuring local immune defence. However, the composition and the transcriptional landscape of the tongue immune system are currently not completely defined. Here, we characterised the tissue-resident immune compartment of the murine tongue during development, health and disease, combining single-cell RNA-sequencing with in situ immunophenotyping. We identified distinct local immune cell populations and described two specific subsets of tongue-resident macrophages occupying discrete anatomical niches. Cx3cr1+ macrophages were located specifically in the highly innervated lamina propria beneath the tongue epidermis and at times in close proximity to fungiform papillae. Folr2+ macrophages were detected in deeper muscular tissue. In silico analysis indicated that the two macrophage subsets originate from a common proliferative precursor during early postnatal development and responded differently to systemic LPS in vivo. Our description of the under-investigated tongue immune system sets a starting point to facilitate research on tongue immune-physiology and pathology including cancer and taste disorders.

Keywords: Tongue; cell biology; cell development; immunology; inflammation; macrophages; mouse; single cell sequencing.


Conflict of interest statement

EL, KZ, LW, DD, CK, CF, SJ, AH, WS, SD, TC, AL, AM No competing interests declared, SY Reviewing editor, eLife

Figures

Figure 1.
Figure 1.. Single-cell sequencing characterization of leukocytes in the mouse tongue.
(a) UMAP representation of 6773 sequenced tongue leukocytes from adult, female Bl6 mice (pool of n=8 mice). Data from a biologically and technically independent experiment is shown in Figure 1—figure supplement 1a+b. Cluster annotation was performed with SingleR (Figure 1—figure supplement 1c). See Figure 1—source data 1+2 for complete gene lists and marker genes for all clusters. Abbreviations: ILCs (innate lymphoid cells); NK cells (natural killer cells); int. MF (intermediate macrophages); tFOLR2-MFs (tongue Folr2 +macrophages); cDCs (classical dendritic cells); tCX3CR1-MF (tongue Cx3cr1+macrophages); Fn1+ cells (Fn1-expressing mononuclear phagocytes); LC (Langerhans cells); preDC (pre-dendritic cells). (b) Separate UMAP representation of cells within cluster 4, 9, and 14. Additional abbreviations: pDC (plasmacytoid dendritic cells); nILC (natural ILC); iILC (induced ILC). (c) Gene Set Variation Analysis (GSVA) analysis was used for the discrimination of macrophages and dendritic cells. One signature gene list for macrophages (derived from Gautier et al., 2012) and one for cDC (derived from Schlitzer et al., 2015) were used to evaluate the enrichment score of each list in the 20 identified clusters. See also Figure 1—figure supplement 1d for cDC1 and cDC2 gene signatures and Figure 1—source data 3 for full gene lists. Cells with the highest similarity to each respective signature are labeled red. (d) Heatmap of top marker genes for the main mononuclear phagocyte clusters. See Figure 1—figure supplement 1b for a heatmap of marker genes for all clusters. (e) Expression pattern of example genes laid over the UMAP from a for dimension reduction. (f) Differentially expressed genes in tCX3CR1-MF vs. tFOLR2-MF (left) and tCX3CR1-MF vs. tongue Langerhans cells (right). Indicated genes show an increased expression of >1.5 with an adjusted p-value <0.05. (g) Gene ontology analysis of the differentially expressed genes of the main mononuclear phagocyte clusters. Only GO annotations involved in biological processes are shown and redundant pathways were excluded from this representation. See Figure 1—source data 4 for full list of GO terms per cluster.
Figure 1—figure supplement 1.
Figure 1—figure supplement 1.. Characterization of adult tongue leukocytes.
(a) Biological and technical replication (experiment 2, right graph) of the scRNA-seq experiment depicted in Figure 1 (experiment 1, left graph). For experiment 2, CD45+ tongue leukocytes were isolated from female mouse tongues (pool of n=10) and 8151 cells were sequenced using the Chromium Single Cell 3’ Reagent Kits v2. Experiment 2 data was integrated with the existing adult data of experiment 1 to allow population comparison. (b) Heatmap representing the top 10 marker genes for all detected clusters. Data is derived from experiment 1 shown in Figure 1. (c) SingleR results for the annotation of cell clusters. Note that cluster 6 cells showed similarities to CD11b+ DCs from Immgen (http://immgen.org/). (d) GSVA analysis of the cDC1 and cDC2 signature genes as defined in Schlitzer et al., 2015. Red indicates cells with higher enrichment scores for the signature genes compared to blue. (e) Heatmap of genes involved in axon guidance. Shown are the normalized read counts in tFOLR2-MF (cluster 0) and tCX3CR1-MF (cluster 5).
Figure 2.
Figure 2.. Tissue-specific transcriptomic identity of tongue macrophages.
(a) Exemplary flow cytometry analysis and gating for tCX3CR1-MF and tFOLR2-MF in Cx3cr1Gfp/+ mice. See Figure 2—figure supplement 1 for isolation tissue procedure. (b) Shown are histogram expression patterns for Cx3cr1-GFP, CX3CR1, TIMD4, LYVE1, F4/80, MHCII and CD11c on tFOLR2-MF (violet) and tCX3CR1-MF (green). Either isotype controls or wild-type Bl6 mice were used to control for antibody stain or GFP signal, respectively. (c) Tissue resident macrophage populations were isolated from different tissues by FACS (see Figure 2—figure supplement 2 for gating strategy; n=2-7) and analyzed by bulk RNA sequencing. Normalized read counts of important macrophage genes are shown across subsets. See also Figure 2—source data 1 for normalized read counts. (d) Sample-wise expression correlation analysis of the different macrophage subsets is shown. Color code as indicated in c. (e) Heatmap of upregulated genes across macrophage populations. The top 10 upregulated genes per population compared to all other populations are depicted. See also Figure 2—source data 2 for full list of upregulated genes. (f) Shown are GO annotations of biological processes that are enriched in specific macrophage subsets. Note that tLC showed no specific enrichment and are therefore not represented in the graph. Furthermore, MHCII- and MHCII+ heart macrophages were not separated for this analysis. Abbreviations: LC (Langerhans cells), MF (macrophages), RPM (red pulp macrophages), AM (alveolar macrophages).
Figure 2—figure supplement 1.
Figure 2—figure supplement 1.. Different isolation methods for the identification of tongue leukocytes.
(a) Digestion of tongues from PBS perfused mice with Collagenase IV, Hyaluronidase and DNase. Shown are examples for Bl6 mice (left) and Cx3cr1Gfp/+ mice (right). Note the almost complete absence of CD11b+ Epcam+ Langerhans cells under this digestion regime. (b) Cx3cr1Gfp/+ tongues were first digested with Dispase, the epithelial layer was peeled off and subsequently digested with Collagenase IV, Hyaluronidase and DNase. With this preparation protocol, CD11b+ Epcam+ Langerhans cells could be detected in the epithelial layer (left), but not in the muscle layer (right).
Figure 2—figure supplement 2.
Figure 2—figure supplement 2.. Gating strategy for the isolation of tissue resident macrophages.
Shown are the gating strategies that allow the identification of (a) Langerhans cells from the skin, (b) splenic macrophages, (c) Cx3cr1+ colonic macrophages, (d) MHCII+ and MHCII- Cx3cr1+ heart macrophages, (e) alveolar macrophages, and (f) microglia from the brain.
Figure 3.
Figure 3.. Distinct localization of mouse tongue macrophages.
(a) Panoramic image of a tongue sagittal section from a perfused Cx3cr1Gfp/+ mouse. The tongue was stained for anti-GFP (CX3CR1; green) and anti-LYVE1 (violet). (b) Magnification of the area depicted in (a) that includes a fungiform papilla with annotation of different tissue layers. EPI = epidermis, LP = lamina propria, MUS = muscle. (c) Co-staining of anti-GFP (green) and anti-LYVE1 (violet) with anti-CD68 (white). The dashed white line indicates the border between the epidermis and the lamina propria. Green arrows indicate Cx3cr1-GFP+CD68+ macrophages, while violet arrows highlight LYVE1+CD68+ macrophages. (d) High magnification of LYVE1+ cells (violet) stained with anti-CD68 (white) and DAPI (blue). (e) Discrimination of podoplanin+ (white) lymphatics from LYVE1+ (violet) podoplanin- macrophages. (f) Anti-Epcam (violet) staining identifies Langerhans cells in the epidermis of the tongue. Sections were stained with anti-Lyve1 (white) and DAPI (blue). (g) Quantification of tFOLR2-MF and tCX3CR1-MF in lamina propria (LP) and muscle layer (MUS) in adult female mouse tongues. Each dot represents one animal. See also Figure 3—figure supplement 1 for definition of layers. (h) Proximity of LYVE1+ (yellow) cells to CD31+ (red) blood vessels. (i) Cx3cr1-GFP+ (green) cell clusters could also be detected in innervated Tuj1+ (violet) areas in posterior regions of the tongue. (j) 3D reconstruction of Cx3cr1Gfp/+ tongue tissue sections stained for anti-CD31 (red), anti-Tuj1 (white), anti-GFP (Cx3cr1; green) and DAPI (blue) using Imaris. (k) Localization of tCX3CR1-MF in fungiform (left) and at the base of filiform (right) papillae. Sections were stained for anti-CD31 (violet), anti-Tuj1 (white), anti-GFP (Cx3cr1; green) and DAPI (blue). Shown in this figure are representative images from n=6 experiments.
Figure 3—figure supplement 1.
Figure 3—figure supplement 1.. Quantification of tongue macrophages.
(a) Panoramic image of an adult tongue counterstained with DAPI (white). The insets represent different areas of the tongue that were quantified. (b) Imaris-based mask for the identification of epithelium, lamina propria and muscle. Analysis of cell density was performed within these areas. (c) Macrophage subset cell counts in the respective regions of the tongue as represented in (a). Shown is the density of cells / mm3 in the lamina propria (left) and in the muscle (right). Each dot represents one independent animal from an experiment with n=6.
Figure 4.
Figure 4.. Inflammatory response of tongue macrophages to systemic LPS challenge.
(a) Female Bl6 mice were intraperitonally injected with 1 mg/kg LPS and analyzed 6 hr after injection by flow cytometry. Note the absence of LYVE1 surface expression in CD11b+ CD64+ tongue macrophages after LPS treatment. The experiment was performed twice with n=3–6 animals. (b) Tongue CD45+ leukocytes were FACS purified 6 hours after injection of LPS and subjected to scRNA-seq (pool of 6 mice). In total, 8165 LPS-exposed tongue leukocytes were sequenced and the data was integrated into the untreated adult analysis shown in Figure 1 for population comparison. Shown are UMAPs for untreated adult cells (top) and LPS-treated cells (bottom). (c) Gene expression pattern of Oasl1 and Ifi204 in untreated and LPS-treated tongue leukocytes. (d) Violin blots showing marker gene expression patterns in untreated (red) and LPS treated (green) tFOLR2-MF and tCX3CR1-MF. (e) Number of up- and down-regulated genes in tFOLR2-MF (violet) and tCX3CR1-MF (green) after LPS injection. The full list of DEGs can be found in Figure 4—source data 1. (f) GO enrichment analysis of the DEGs. Only GO annotations involved in biological processes are shown.
Figure 5.
Figure 5.. Tongue macrophage distribution during development.
(a) Representative flow cytometry analysis of tongue leukocytes isolated from Cx3cr1Gfp/+ mice at different embryonic (E) and postnatal (p) days of development and 8 week-old adults. Cells were pre-gated for CD45+ Epcam- Gr1-. (b) Proportions of Cx3cr1-GFP+ FOLR2- (G1) Cx3cr1-GFP+ FOLR2+ (G2) and Cx3cr1-GFP- FOLR2+ (G3) cells out of CD64+ cells. Five to 7 animals per time point were used. (c) 3D reconstructions of whole tongue sagittal sections (left) and magnifications (right) stained with anti-GFP (green), anti-CD31 (blood vessels; red) and anti-TUJ1 (neurons; white) from E14, p0, p3, and p11 Cx3cr1Gfp/+ reporter mouse tongues. White dashed line in magnifications (right) represents the barrier between the epithelium layer and the muscle. The experiment was repeated at least 3 times.
Figure 6.
Figure 6.. Transcriptomic analysis of hematopoietic tongue cells from newborn mice.
(a) CD45+ tongue leukocytes were isolated by FACS from newborn p3 mice. The purified cells were subjected to scRNA-seq and a total of 13,898 cells were sequenced. The early postnatal data was integrated with the adult scRNA-seq dataset shown in Figure 1 for population comparison. Shown are UMAPs for adult (left) and newborn cells (right). (b) Cell frequencies for each cell cluster in adult and newborn mice. Note that the adult analysis included enrichment for LC using a different cell isolation protocol that was not done for the p3 pup analysis (see Materials and method section) and cluster 10 LC are therefore probably underrepresented in p3 tongues. (c) Expression levels of example genes in newborn cells shown in the UMAP. (d) 3D UMAP visualization reveals the merging of proliferating cluster 2 cells with cluster 0 cells. The 3D html file is provided in Figure 6—source data 1. (e) Slingshot analysis was used to model the developmental trajectories of tongue macrophages. See also Figure 6—figure supplement 1+2 for gene differences between newborn and adult tongue macrophages. (f) In vivo EdU proliferation assay of adult and newborn tongue leukocytes. EdU was injected and tongue cells were isolated 24 hr after injection. Representative FACS gating strategy for macrophages at each age shown above and quantification of EdU+ cell fraction shown below. Each dot in the quantification represents one independent animal (n=5). This experiment was performed once. (g) CD45.2/2 animals were lethally irradiated (9.5 Gy) and reconstituted with CD45.1 expressing bone marrow cells. Five weeks and 10 weeks after transfer, tongue cells were isolated and analysed by flow cytometry for the distribution of CD45.1+ cells within the macrophage subsets. Each dot represents one independent animal. This experiment was performed once.
Figure 6—figure supplement 1.
Figure 6—figure supplement 1.. Gene expression differences in tongue macrophages at p3 and adult stages.
(a) Differentially expressed genes between p3 and adult tFOLR2-MF. Shown are all significantly changed genes that passed variance analysis. No fold-change filter was applied to the analysis. (b) GO enrichment analysis of biological processes that differ between p3 and adult tFOLR2-MF. Redundant terms are excluded. (c) Differentially expressed genes between p3 and adult tCX3CR1-MF. Shown are all significantly changed genes that passed variance analysis. No fold-change filter was applied to the analysis. (d) GO enrichment analysis of biological processes that differ between p3 and adult tCX3CR1-MF. Redundant terms are excluded.
Figure 6—figure supplement 2.
Figure 6—figure supplement 2.. The maturation pattern of tFOLR2-MF and tCX3CR1-MF in adult tongues.
(a) Latent time analysis reveals distinct gene expression patterns in adult tFOLR2-MF. Note the gradual down-regulation of MHC-related genes (for example, H2–Ab1, H2–Aa, Cd74), proliferation-associated genes (for example, Cdk1, Cenpp) and genes that are highly expressed in tCX3CR1-MF (e.g. Cx3cr1, Hexb, Axl). Early (blue) and late (red) expressed genes that were used in (b) are marked with a rectangle. (b) We used Lisa Cistrome (Qin et al., 2020) (http://lisa.cistrome.org/) to investigate public chromatin profile data from a comprehensive database of mouse H3K27ac ChIP-seq profiles to determine transcription factors that are possibly responsible for the regulation of early and late expressed tFOLR2-MF genes. Note that early expressed tFOLR2-MF genes (blue genes in (a)) show preferential binding motifs of IRF and CEBP proteins similar to tCX3CR1-MF, while genes that are expressed in more mature tFOLR2-MF are enriched for STAT3 and OGT motifs. (c) Latent time analysis of adult tCX3CR1-MF. No clear maturation pattern could be extracted. Intermediate (blue) and late (red) expressed genes that were used in (d) are marked with a rectangle. (d) Lisa analysis of intermediate and late expressed tCX3CR1-MF gene sets as shown in (c). Both intermediate and late gene data sets showed a significant enrichment for IRF, RELA, JUNB, and BATF motifs. While intermediate genes showed binding motifs for RUNX1, BCL6, and NR3C1, the late gene set was only weakly enriched for SPI1 motifs.
Figure 6—figure supplement 3.
Figure 6—figure supplement 3.. Irf8-deficiency does not affect the tongue leukocyte composition.
(a) Exemplary flow cytometry analysis of Irf8-deficient tongue leukocytes and their respective controls. The cells were pre-gated as CD11b+ CD64+. (b) Ratio analysis of Ly6C- monocytes / Ly6C+ monocytes, splenic cDC2 /cDC1 cells and tFOLR2-MF / tCX3CR1-MF isolated from WT and Irf8-deficient mice (n=4). Each dot represents one animal. The experiment was repeated three times with similar results. Unpaired Student’s T-Test was used to determine significance. * indicates p<0.05. (c) Histological analysis of an adult Cx3cr1Gfp/+ Irf8-/- tongue reveals the presence of Cx3cr1-GFP+ tCX3CR1-MF in the lamina propria. Sections were stained with anti-GFP (green) and anti-LYVE1 (violet) antibodies. The experiment was repeated three times. (d) 9047 CD45+ cells were profiled from adult Irf8-deficient mice (pool of n=5 mice) by scRNA-seq. Shown are UMAP dimension reductions of WT (left) and Irf8-deficient CD45+ tongue cells (right). Note that the Irf8-deficient data was separately integrated with WT cells and therefore reveals different clustering results than those shown in main Figures 1, 4 and 5 and Figure 1—figure supplement 1. (e) Gene expression examples in wt and Irf8-deficient cells. Note that Irf8 transcripts can be detected on mRNA level in Irf8-deficient mice since only exon 2 of the Irf8 gene is deleted in the Jackson strain 018298. (f) Heatmap of marker gene expression for clusters 0, 1, 2, and 9 in wildtype and Irf8-deficient cells.

References

    1. Agarbati S, Mascitti M, Paolucci E, Togni L, Santarelli A, Rubini C, Fazioli F. Prognostic Relevance of Macrophage Phenotypes in High-grade Oral Tongue Squamous Cell Carcinomas. Applied Immunohistochemistry & Molecular Morphology. 2021;29:359–365. doi: 10.1097/PAI.0000000000000867. - DOI - PubMed
    1. Agyeman AA, Chin KL, Landersdorfer CB, Liew D, Ofori-Asenso R. Smell and Taste Dysfunction in Patients With COVID-19: A Systematic Review and Meta-analysis. Mayo Clinic Proceedings. 2020;95:1621–1631. doi: 10.1016/j.mayocp.2020.05.030. - DOI - PMC - PubMed
    1. Aran D, Looney AP, Liu L, Wu E, Fong V, Hsu A, Chak S, Naikawadi RP, Wolters PJ, Abate AR, Butte AJ, Bhattacharya M. Reference-based analysis of lung single-cell sequencing reveals a transitional profibrotic macrophage. Nature Immunology. 2019;20:163–172. doi: 10.1038/s41590-018-0276-y. - DOI - PMC - PubMed
    1. Aychek T, Mildner A, Yona S, Kim KW, Lampl N, Reich-Zeliger S, Boon L, Yogev N, Waisman A, Cua DJ, Jung S. IL-23-mediated mononuclear phagocyte crosstalk protects mice from Citrobacter rodentium-induced colon immunopathology. Nature Communications. 2015;6:e6525. doi: 10.1038/ncomms7525. - DOI - PMC - PubMed
    1. Bain CC, Bravo-Blas A, Scott CL, Gomez Perdiguero E, Geissmann F, Henri S, Malissen B, Osborne LC, Artis D, Mowat AM. Constant replenishment from circulating monocytes maintains the macrophage pool in the intestine of adult mice. Nature Immunology. 2014;15:929–937. doi: 10.1038/ni.2967. - DOI - PMC - PubMed

Publication types

Associated data