Editorial
. 2022 Aug 3;10(8):932-946.
doi: 10.1158/2326-6066.CIR-22-0040.

Adoptive Cellular Therapy with Autologous Tumor-Infiltrating Lymphocytes and T-cell Receptor-Engineered T Cells Targeting Common p53 Neoantigens in Human Solid Tumors

Affiliations
Editorial

Adoptive Cellular Therapy with Autologous Tumor-Infiltrating Lymphocytes and T-cell Receptor-Engineered T Cells Targeting Common p53 Neoantigens in Human Solid Tumors

Sanghyun P Kim et al. Cancer Immunol Res. .

Abstract

Adoptive cellular therapy (ACT) targeting neoantigens can achieve durable clinical responses in patients with cancer. Most neoantigens arise from patient-specific mutations, requiring highly individualized treatments. To broaden the applicability of ACT targeting neoantigens, we focused on TP53 mutations commonly shared across different cancer types. We performed whole-exome sequencing on 163 patients with metastatic solid cancers, identified 78 who had TP53 missense mutations, and through immunologic screening, identified 21 unique T-cell reactivities. Here, we report a library of 39 T-cell receptors (TCR) targeting TP53 mutations shared among 7.3% of patients with solid tumors. These TCRs recognized tumor cells in a TP53 mutation- and human leucocyte antigen (HLA)-specific manner in vitro and in vivo. Twelve patients with chemorefractory epithelial cancers were treated with ex vivo-expanded autologous tumor-infiltrating lymphocytes (TIL) that were naturally reactive against TP53 mutations. However, limited clinical responses (2 partial responses among 12 patients) were seen. These infusions contained low frequencies of mutant p53-reactive TILs that had exhausted phenotypes and showed poor persistence. We also treated one patient who had chemorefractory breast cancer with ACT comprising autologous peripheral blood lymphocytes transduced with an allogeneic HLA-A*02-restricted TCR specific for p53R175H. The infused cells exhibited an improved immunophenotype and prolonged persistence compared with TIL ACT and the patient experienced an objective tumor regression (-55%) that lasted 6 months. Collectively, these proof-of-concept data suggest that the library of TCRs targeting shared p53 neoantigens should be further evaluated for the treatment of patients with advanced human cancers. See related Spotlight by Klebanoff, p. 919.


Figures

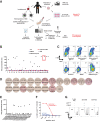
Figure 1. Unbiased neoantigen screening of TILs from patient 4316 identifies TILs/TCR reactive with mutant p53C135Y. A, Diagram depicting the unbiased neoantigen screening for immunogenicity of shared TP53 mutations. B, ELISpot assay measuring IFNγ secretion in TILs. The 24 TIL fragment subcultures from colorectal cancer patient 4316 were screened against the somatic mutations identified in the patient's tumor, including p53C135Y. TIL fragment 22 showing increased IFNγ secretion against TMGs and PPs that included p53C135Y is highlighted in red (n = 1). C, Flow cytometric analysis of cell surface 4–1BB/OX40 expression upon parsing individual reactivities of TIL fragment 22. An irrelevant peptide (KIAA1328K386R) and DMSO (vehicle) as negative controls and PMA/ionomycin as a positive control are included (n = 1). D, Functional determination of MEs for TCR-B by ELISpot measurement of IFN𝛾 secretion. Eighteen candidate MEs predicted to bind patient's class I HLAs were tested. The amino acid sequences of the tested peptides are listed (n = 1). E, Quantification of IFNγ spots from panel (D). F, Functional testing of avidity of TCR-B. Avidity was determined by coculturing TCR-expressing healthy donor PBLs with autologous imDCs pulsed with serially diluted ME6. 4–1BB expression was measured by flow cytometry (n = 1). G, Autologous tumor cell recognition by 4316 TCR-B. The 4316 autologous PDX was established into a cell line and was cocultured with TCR-B–expressing PBLs. 4–1BB upregulation in p53C135Y-TCR+CD8+ cells is shown. The 4247 PDX line with matching HLA but lacking a p53C135Y mutation was included as a negative control. (n = 1) Experiments in (B) to (G) were independently repeated once. seq, sequencing.
Figure 1.
Unbiased neoantigen screening of TILs from patient 4316 identifies TILs/TCR reactive with mutant p53C135Y. A, Diagram depicting the unbiased neoantigen screening for immunogenicity of shared TP53 mutations. B, ELISpot assay measuring IFNγ secretion in TILs. The 24 TIL fragment subcultures from colorectal cancer patient 4316 were screened against the somatic mutations identified in the patient's tumor, including p53C135Y. TIL fragment 22 showing increased IFNγ secretion against TMGs and PPs that included p53C135Y is highlighted in red (n = 1). C, Flow cytometric analysis of cell surface 4–1BB/OX40 expression upon parsing individual reactivities of TIL fragment 22. An irrelevant peptide (KIAA1328K386R) and DMSO (vehicle) as negative controls and PMA/ionomycin as a positive control are included (n = 1). D, Functional determination of MEs for TCR-B by ELISpot measurement of IFNγ secretion. Eighteen candidate MEs predicted to bind patient's class I HLAs were tested. The amino acid sequences of the tested peptides are listed (n = 1). E, Quantification of IFNγ spots from panel (D). F, Functional testing of avidity of TCR-B. Avidity was determined by coculturing TCR-expressing healthy donor PBLs with autologous imDCs pulsed with serially diluted ME6. 4–1BB expression was measured by flow cytometry (n = 1). G, Autologous tumor cell recognition by 4316 TCR-B. The 4316 autologous PDX was established into a cell line and was cocultured with TCR-B–expressing PBLs. 4–1BB upregulation in p53C135Y-TCR+CD8+ cells is shown. The 4247 PDX line with matching HLA but lacking a p53C135Y mutation was included as a negative control. (n = 1) Experiments in (B) to (G) were independently repeated once. seq, sequencing. PP, peptide pool.
Figure 2. Characterization of mutant p53–reactive TCRs. A, Tumor-cell recognition by p53Y220C-TCR (Y220C-TCR). Y220C-TCR was expressed in healthy donor PBLs and was tested against a panel of tumor cell lines with different TP53 mutations and HLAs. Following coculture with tumor cell lines, cell surface upregulation of 4–1BB on the T cells was measured by flow cytometry. Mock transduced T cells were included as a negative control (mean ± SEM, n = 3). B, Titration curve showing the avidity of Y220C-TCR against the WT and mutant Y220C ME. 4–1BB upregulation in healthy donor PBL transduced with Y220C-TCR following coculture with A*02:01+ T2 cells pulsed with the serially diluted ME was measured by flow cytometry (n = 1). C, Comparison of 4 HLA-A*02:01-restricted TCRs targeting p53R175H based on tumor cell reactivity. 4–1BB upregulation in p53R175H-TCR+CD8+ cells was measured by flow cytometry (mean ± SEM, n = 2). D, Titration curves for 4 TCRs targeting p53R175H. HLA-A*02:01+ T2 cells were pulsed with the serially diluted p53R175H ME and cocultured with TCR-transduced T cells. IFNγ secretion was measured by ELISA (mean ± SEM, n = 3). Statistical analysis by two-way ANOVA. Preclinical ACT of NSG mice bearing TYK-nu cancer cells using the R175H-TCR (4196-AV6/BV11)-engineered human PBL. Tumor size was calculated as the product of two perpendicular measurements. Tumor measurement was discontinued when the first mouse was euthanized [mean ± SEM, n = 4 (E and F), 5 (G, H, and J), and 10 (I)]. Donor information, transduction efficiency (TX; %), and CD8+ cell frequency (%) are given. E and G, Tumor growth following ACT of two different healthy donor PBLs transduced with the R175H-TCR or the irrelevant Y220C-TCR. I and J, Tumor growth following ACT of patient 4349’s PBL (1 or 2 × 10⁷ cells) transduced with the R175H-TCR or untransduced (2 × 10⁷ cells). J, Mice injected with either TYK-nu cells or the control 4259 PDX cells were treated with untransduced T cells, R175H-TCR–engineered T cells, or vehicle (PBS). Statistical analyses by two-way ANOVA (D, E, G, I, J) and by log-rank tests (F and H). *, P < 0.05; **, P < 0.01; ***, P < 0.001. A–D were independently repeated at least once.
Figure 2.
Characterization of mutant p53–reactive TCRs. A, Tumor-cell recognition by p53Y220C-TCR (Y220C-TCR). Y220C-TCR was expressed in healthy donor PBLs and was tested against a panel of tumor cell lines with different TP53 mutations and HLAs. Following coculture with tumor cell lines, cell surface upregulation of 4–1BB on the T cells was measured by flow cytometry. Mock transduced T cells were included as a negative control (mean ± SEM, n = 3). B, Titration curve showing the avidity of Y220C-TCR against the WT and mutant Y220C ME. 4–1BB upregulation in healthy donor PBL transduced with Y220C-TCR following coculture with A*02:01+ T2 cells pulsed with the serially diluted ME was measured by flow cytometry (n = 1). C, Comparison of 4 HLA-A*02:01-restricted TCRs targeting p53R175H based on tumor cell reactivity. 4–1BB upregulation in p53R175H-TCR+CD8+ cells was measured by flow cytometry (mean ± SEM, n = 2). D, Titration curves for 4 TCRs targeting p53R175H. HLA-A*02:01+ T2 cells were pulsed with the serially diluted p53R175H ME and cocultured with TCR-transduced T cells. IFNγ secretion was measured by ELISA (mean ± SEM, n = 3). Preclinical ACT of NSG mice bearing TYK-nu cancer cells using the R175H-TCR (4196-AV6/BV11)-engineered human PBL. Tumor size was calculated as the product of two perpendicular measurements. Tumor measurement was discontinued when the first mouse was euthanized [mean ± SEM, n = 4 (E and F), 5 (G, H, and J), and 10 (I)]. Donor information, transduction efficiency (TX; %), and CD8+ cell frequency (%) are given. E and G, Tumor growth following ACT of two different healthy donor PBLs transduced with the R175H-TCR or the irrelevant Y220C-TCR. I and J, Tumor growth following ACT of patient 4349’s PBL (1 or 2 × 10⁷ cells) transduced with the R175H-TCR or untransduced (2 × 10⁷ cells). J, Mice injected with either TYK-nu cells or the control 4259 PDX cells were treated with untransduced T cells, R175H-TCR–engineered T cells, or vehicle (PBS). Statistical analyses by two-way ANOVA (D, E, G, I, J) and by log-rank tests (F and H). *, P < 0.05; **, P < 0.01; ***, P < 0.001. AD were independently repeated at least once.
Figure 3. Autologous TIL ACT for the treatment of 12 patients with chemorefractory epithelial cancers. A, Characterization of the infusion products for the 12 autologous TIL ACTs. The ACT sample with genetically engineered PBL for patient 4349 is included for comparison and is marked in red. Bar denotes median. Detailed information is available in Table 2. RX, infusion product. B, Representative tetramer staining analysis by flow cytometry. Following positive gating of live CD3+ cells of patient 4350’s infusion product TILs, CD4, and CD8 gating (top) and tetramer staining of CD8+ cells (bottom) are presented. C, Phenotypic analysis of antigen-specific or bulk CD8+ T cells from the infusion products for patients 4266, 4324, and 4350 by flow cytometry. Expression of CD39 and CD69 in Bulk CD8+ T cells (CD3+CD8+; top) or tetramer-stained cells (CD3+CD8+Tetramer+; bottom) are shown. Due to sample limitations, A–D were not independently repeated.
Figure 3.
Autologous TIL ACT for the treatment of 12 patients with chemorefractory epithelial cancers. A, Characterization of the infusion products for the 12 autologous TIL ACTs. The ACT sample with genetically engineered PBL for patient 4349 is included for comparison and is marked in red. Bar denotes median. Detailed information is available in Table 2. RX, infusion product. B, Representative tetramer staining analysis by flow cytometry. Following positive gating of live CD3+ cells of patient 4350’s infusion product TILs, CD4, and CD8 gating (top) and tetramer staining of CD8+ cells (bottom) are presented. C, Phenotypic analysis of antigen-specific or bulk CD8+ T cells from the infusion products for patients 4266, 4324, and 4350 by flow cytometry. Expression of CD39 and CD69 in Bulk CD8+ T cells (CD3+CD8+; top) or tetramer-stained cells (CD3+CD8+Tetramer+; bottom) are shown. Due to sample limitations, AC, were not independently repeated.
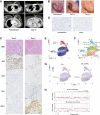
Figure 4. ACT with R175H-TCR–engineered autologous PBLs for the treatment of patient 4349 with chemorefractory breast cancer. A, Contrast-enhanced CT scans of the chest of patient 4349 before (left) and day 41 after the infusion of 5.3 × 10¹⁰ R175H-TCR–expressing PBLs (right). B, Pictures showing changes in metastatic skin deposits before the cell therapy (left), at day 41 (middle), and day 60 (right). C,) IHC analysis of the skin biopsies at day 0 before the cell therapy (left) and at day 6 (right). Scale bar, 100 μm. Following ACT, a decrease in tumor cell numbers and p53+ tumor cells and an increase in CD8+ T cells, PD-1+ T cells, and PD-L1+ tumor cells were detected. D, Detection of R175H-TCR+ T cells by RNAscope. Tumor-infiltrating T cells that expressed the R175H-TCR are visualized using an RNAscope probe against the MSGV1 3′ UTR. Each purple dot represents one RNA molecule. UMAP projection of 12,993 R175H-TCR+CD8+ T cells: 10,893 infusion product T cells (RX) and 2,100 6-week posttreatment PBLs (PBL_6w). E, UMAP clustering of single cells indicated by the sample source. F, Clustering based on whole transcriptome analysis. Phenotypic clusters are represented using different colors. G, Expression of indicated genes overlaid on the UMAP projection of RX cells and PBL_6w cells. H, Copy-number analysis of patient 4349′s pre-ACT metastasis tumor fragment 6 (top) and the skin biopsy at recurrence (bottom) by WES. LOH of chromosome 6 containing HLA-A*02:01 is highlighted in a red box. H&E, hematoxylin and eosin; Eff, effector T cells; EM, effector memory T cells; CM, central memory T cells; Term Exh, terminally exhausted T cells; MAIT, mucosa-associated invariant T cells.
Figure 4.
ACT with R175H-TCR–engineered autologous PBLs for the treatment of patient 4349 with chemorefractory breast cancer. A, Contrast-enhanced CT scans of the chest of patient 4349 before (left) and day 41 after the infusion of 5.3 × 10¹⁰ R175H-TCR–expressing PBLs (right). B, Pictures showing changes in metastatic skin deposits before the cell therapy (left), at day 41 (middle), and day 60 (right). C,) IHC analysis of the skin biopsies at day 0 before the cell therapy (left) and at day 6 (right). Scale bar, 100 μm. Following ACT, a decrease in tumor cell numbers and p53+ tumor cells and an increase in CD8+ T cells, PD-1+ T cells, and PD-L1+ tumor cells were detected. D, Detection of R175H-TCR+ T cells by RNAscope. Tumor-infiltrating T cells that expressed the R175H-TCR are visualized using an RNAscope probe against the MSGV1 3′ UTR. Each purple dot represents one RNA molecule. E–F, UMAP projection of 12,993 R175H-TCR+CD8+ T cells: 10,893 infusion product T cells (RX) and 2,100 6-week posttreatment PBLs (PBL_6w). E, UMAP clustering of single cells indicated by the sample source. F, Clustering based on whole transcriptome analysis. Phenotypic clusters are represented using different colors. G, Expression of indicated genes overlaid on the UMAP projection of RX cells and PBL_6w cells. H, Copy-number analysis of patient 4349′s pre-ACT metastasis tumor fragment 6 (top) and the skin biopsy at recurrence (bottom) by WES. LOH of chromosome 6 containing HLA-A*02:01 is highlighted in a red box. H&E, hematoxylin and eosin; Eff, effector T cells; EM, effector memory T cells; CM, central memory T cells; Term Exh, terminally exhausted T cells; MAIT, mucosa-associated invariant T cells.

Comment in

Comment on

References

    1. Tran E, Turcotte S, Gros A, Robbins PF, Lu YC, Dudley ME, et al. . Cancer immunotherapy based on mutation-specific CD4+ T cells in a patient with epithelial cancer. Science 2014;344:641–5. - PMC - PubMed
    1. Tran E, Robbins PF, Lu YC, Prickett TD, Gartner JJ, Jia L, et al. . T-Cell transfer therapy targeting mutant KRAS in cancer. N Engl J Med 2016;375:2255–62. - PMC - PubMed
    1. Stevanovic S, Pasetto A, Helman SR, Gartner JJ, Prickett TD, Howie B, et al. . Landscape of immunogenic tumor antigens in successful immunotherapy of virally induced epithelial cancer. Science 2017;356:200–5. - PMC - PubMed
    1. Zacharakis N, Chinnasamy H, Black M, Xu H, Lu YC, Zheng Z, et al. . Immune recognition of somatic mutations leading to complete durable regression in metastatic breast cancer. Nat Med 2018;24:724–30. - PMC - PubMed
    1. Parkhurst MR, Robbins PF, Tran E, Prickett TD, Gartner JJ, Jia L, et al. . Unique neoantigens arise from somatic mutations in patients with gastrointestinal cancers. Cancer Discov 2019;9:1022–35. - PMC - PubMed

MeSH terms