. 2022 Jun 24;8(25):eabi8716.
doi: 10.1126/sciadv.abi8716. Epub 2022 Jun 24.

Greenhouse gas emissions from African lakes are no longer a blind spot

Affiliations

Greenhouse gas emissions from African lakes are no longer a blind spot

Alberto V Borges et al. Sci Adv. .

Abstract

Natural lakes are thought to be globally important sources of greenhouse gases (CO2, CH4, and N2O) to the atmosphere although nearly no data have been previously reported from Africa. We collected CO2, CH4, and N2O data in 24 African lakes that accounted for 49% of total lacustrine surface area of the African continent and covered a wide range of morphology and productivity. The surface water concentrations of dissolved CO2 were much lower than values attributed in current literature to tropical lakes and lower than in boreal systems because of a higher productivity. In contrast, surface water-dissolved CH4 concentrations were generally higher than in boreal systems. The lowest CO2 and the highest CH4 concentrations were observed in the more shallow and productive lakes. Emissions of CO2 may likely have been substantially overestimated by a factor between 9 and 18 in African lakes and between 6 and 26 in pan-tropical lakes.


Figures

Fig. 1.
Fig. 1.. Location of the 24 sampled African lakes, plus Lake Malawi (48).
This dataset of CO2, CH4, and N2O in surface waters covers a wide range of morphological conditions (surface area and depth), water column physical structure, catchment land cover, and lake productivity. Map indicates cover by savannah, forest, and flooded forest (from lightest to darkest shade of green).
Fig. 2.
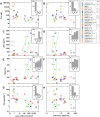
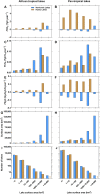
Fig. 2.. Lake morphology controls CH4, N2O, and CO2 in lacustrine surface waters.
Surface water–dissolved CH4 concentration (A and B), pCO2 (C and D), N2O saturation level (%N2O) (E and F), and Chl-a concentration (G and H) in 24 African tropical lakes versus lake surface area and average depth. For lakes where multiple measurements were made, the symbol shows the median (n indicates the number of samplings, detailed in table S7). Insets show data binned (median) by classes of surface area or depth. Horizontal dotted lines indicate the atmospheric equilibrium of the three gases, additionally for CO2 two average estimates for tropical (4, 7) and global lakes (1). Solid lines are fits to the data (table S3) from which humic lakes were excluded for pCO2 and %N2O. Data of pCO2 in Lake Malawi were obtained by another group but with a comparable high-quality method (equilibrator coupled to an infrared CO2 analyzer) (48). CO2 and %N2O data in humic lakes were clustered but did not show a pattern with lake surface and mean depth, so the median was used to upscale the values at continental scale. CO2 and %N2O in nonhumic lakes were positively related to mean depth and these relations were used to scale the values at continental scale. CH4 was negatively related to mean depth, irrespective of the lake type, and this relation was used to scale values at continental scale.
Fig. 3.
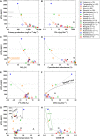
Fig. 3.. CO2 levels are highly variable among African lakes and patterns depend on primary production.
Surface water pCO2 in several African tropical lakes versus pelagic aquatic primary production (A), Chl-a concentration (B), oxygen saturation level (%O2) (C), cyanobacteria abundance (D), carbon stable isotope composition of dissolved inorganic carbon (δ13C-DIC) (E), DOC (F), water temperature (G), and CDOM SR (H). Dotted lines and solid lines as in Fig. 2. The black dotted line gives the relation of pCO2 versus DOC from a global dataset (2), while the black dotted line in the inset gives the relation of pCO2 versus temperature from a dataset of tropical lakes (9). For lakes where multiple measurements were made, the symbol shows the median (n indicates the number of pCO2 measurements).
Fig. 4.
Fig. 4.. CH4 strongly varies as a function of bottom depth within lakes.
Continuous measurements of dissolved CH4 concentrations were made in Lakes Victoria, Tanganyika, Albert, Kivu, and Edward, with an equilibrator connected to a laser spectrometer except for Lake Kivu (compilation of 65 discrete samples measured by headspace with a gas chromatograph obtained during five cruises; n indicates the number of measurements). The inset shows the raw data, and the main panel shows the data binned by depth intervals of 10. Dotted lines are the curves fitted to data (table S3). Data bins per depth interval were combined with bathymetry maps to derive CH4 (and pCO2; not shown here) values spatially representative of the largest lakes, accounting for the strong horizontal gradients as a function of depth.
Fig. 5.
Fig. 5.. Net ecosystem autotrophy drives a CO2 sink in most of the studied African lakes.
Variations in several African tropical lakes of the air-water gradient of the pCO2 (ΔpCO2) as a function of the ratio of aquatic pelagic primary production (P) and community respiration (R) (A) and the air-water CO2 flux (FCO2) as a function of NEP (B). P/R > 1 and NEP > 0 correspond to net autotrophy at the community level and is, in most cases, associated with being a sink of atmospheric CO2 (ΔpCO2 < 0, FCO2 < 0). For lakes where multiple measurements were made, the symbol shows the median (n indicates the number of measurements).
Fig. 6.
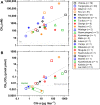
Fig. 6.. CH4 levels in surface waters of African lakes are driven by lacustrine productivity.
Dissolved CH4 concentrations (A) and ratio of dissolved CH4 and CO2 concentrations (B) versus Chl-a concentration in surface waters of several African tropical lakes. Horizontal dotted line represents the equilibrium with the atmosphere (top) and the average value for boreal lakes (26). Solid line is a fit to the data (table S3). For lakes where multiple measurements were made, the symbol shows the median (n indicates the number of measurements). For CH4, no relation was observed with other measured variables. The positive relation of CH4 and Chl-a should be interpreted as resulting from the dependence of CH4 in surface waters from sedimentary CH4 fluxes to the water column (22) that were higher in shallow and productive systems (fig. S9), while in stratified deep systems, the CH4 removal by MOX led to low-surface CH4 (49).
Fig. 7.
Fig. 7.. CH4 is higher and CO2 is lower in African lakes than in boreal lakes.
The ratio of dissolved CH4 and CO2 concentrations (A to C), dissolved CH4 (D to F), CO2 (G to I) concentrations, and N2O saturation levels (%N2O) (J to L) in surface waters of several African tropical lakes compared to paired CO2 and CH4 measurements (n = 224) in lakes located in the boreal climatic zone compiled from literature in (26) located in Finland, Canada, Siberia (latitude, >60°N) and %N2O in Finland (50) sorted into three size classes (0.1 to 1 km2, 1 to 10 km2, and >10 km2). Surface water temperature in boreal lakes was 9.8°C (median) versus 25.8°C in African lakes. Box indicates the median; bars indicate the first and third quartile. n indicates the number of data points.
Fig. 8.
Fig. 8.. Allochthonous versus autochthonous origin of DOC in African lakes depends on type (humic versus nonhumic).
DOC versus Chl-a (A) concentration and versus cyanobacteria abundance (B) in surface waters of several African tropical lakes. Solid line is a fit to the data (table S3). For lakes where multiple measurements were made, the symbol shows the median (n indicates the number of measurements).
Fig. 9.
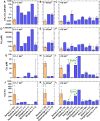
Fig. 9.. Large contribution to CO2, CH4, and N2O emissions from very large lakes.
Air-water flux of CO2 (FCO2), CH4 (FCH4 diffusive), and N2O (FN2O) integrated for African tropical (A, C, and E) and pan-tropical lakes (B, D, and F) that were classified into humic and nonhumic, as well as surface area (G and H) and number of lakes per size classes (I and J) from HydroLAKES (29), except for Lake Chad for which the more recent and realistic surface area was applied (30).

References

    1. Cole J. J., Caraco N. F., Kling G. W., Kratz T. K., Carbon dioxide supersaturation in the surface waters of lakes. Science 265, 1568–1570 (1994). - PubMed
    1. Sobek S., Tranvik L. J., Cole J. J., Temperature independence of carbon dioxide supersaturation in global lakes. Global Biogeochem. Cycles 19, GB2003 (2005).
    1. Bastviken D., Tranvik L. J., Downing J. A., Crill P. M., Enrich-Prast A., Freshwater methane emissions offset the continental carbon sink. Science 331, 50–50 (2011). - PubMed
    1. Raymond P. A., Hartmann J., Lauerwald R., Sobek S., McDonald C., Hoover M., Butman D., Striegl R., Mayorga E., Humborg C., Kortelainen P., Dürr H., Meybeck M., Ciais P., Guth P., Global carbon dioxide emissions from inland waters. Nature 503, 355–359 (2013). - PubMed
    1. DelSontro T., Beaulieu J. J., Downing J. A., Greenhouse gas emissions from lakes and impoundments: Upscaling in the face of global change. Limnol. Oceanogr. Lett. 3, 64–75 (2018). - PMC - PubMed