. 2022 Jun 24;7(72):eabo5407.
doi: 10.1126/sciimmunol.abo5407. Epub 2022 Jun 24.

FOXP3 exon 2 controls Treg stability and autoimmunity

Affiliations

FOXP3 exon 2 controls Treg stability and autoimmunity

Jianguang Du et al. Sci Immunol. .

Abstract

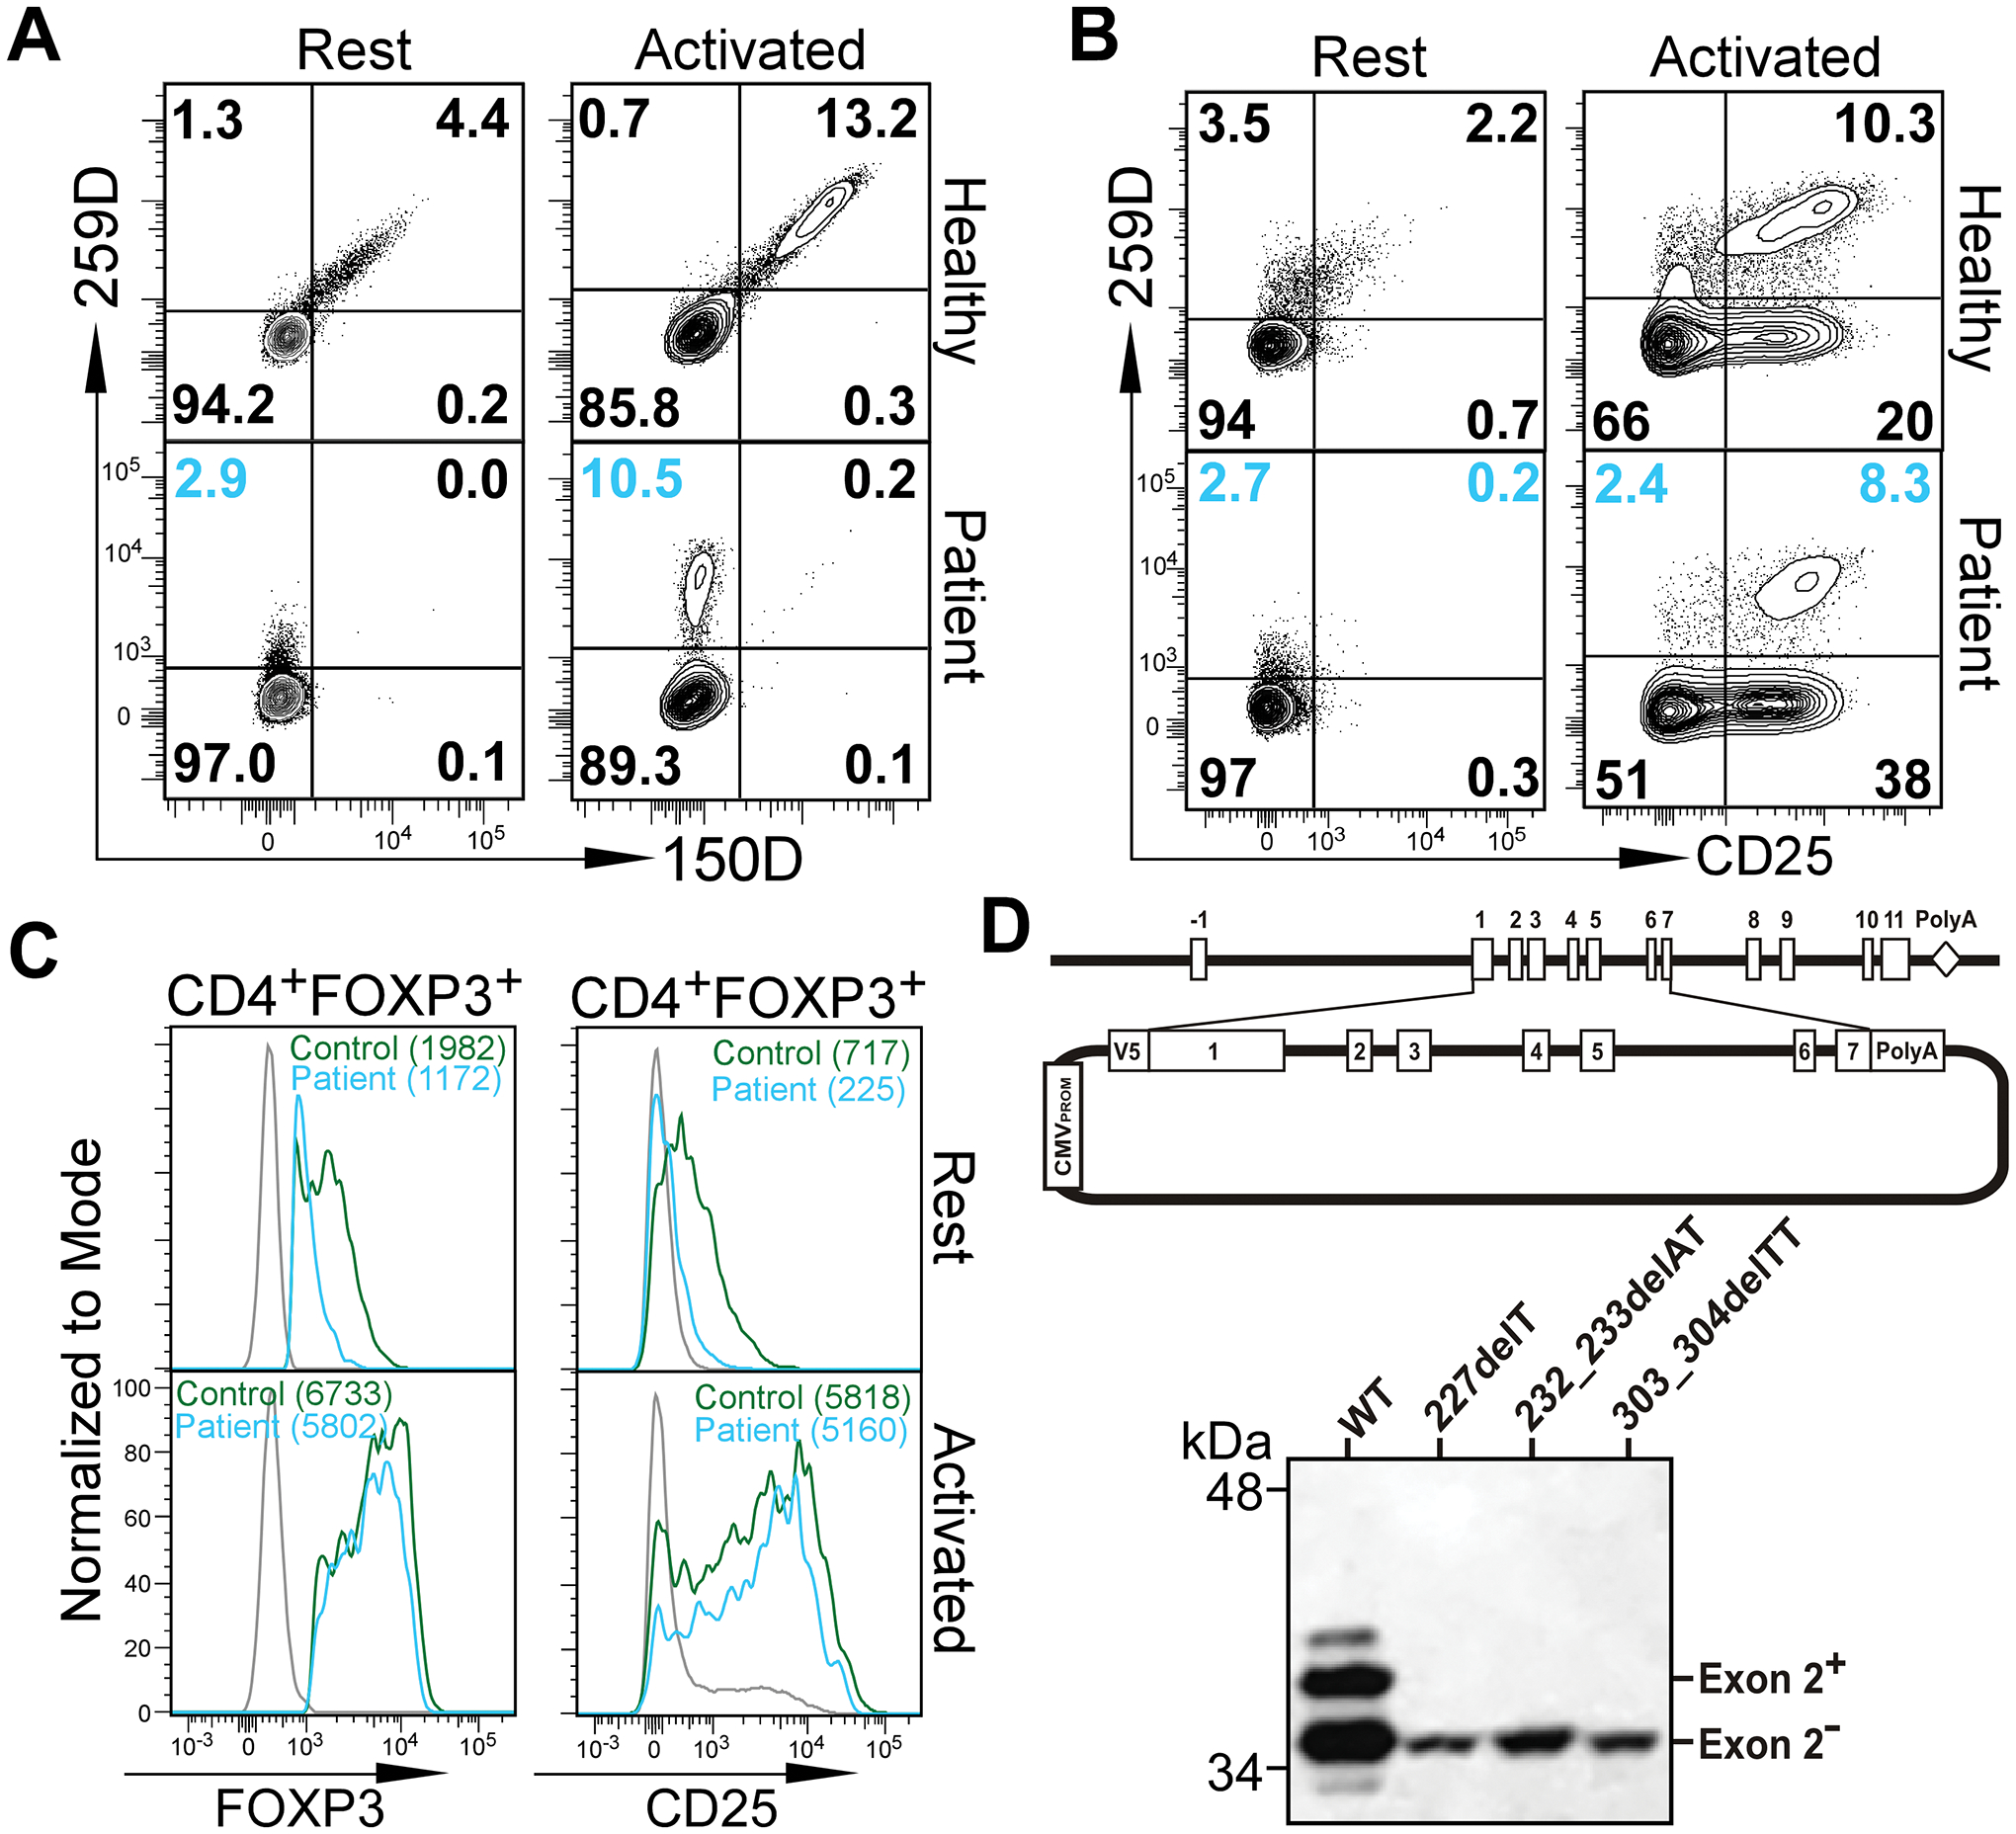
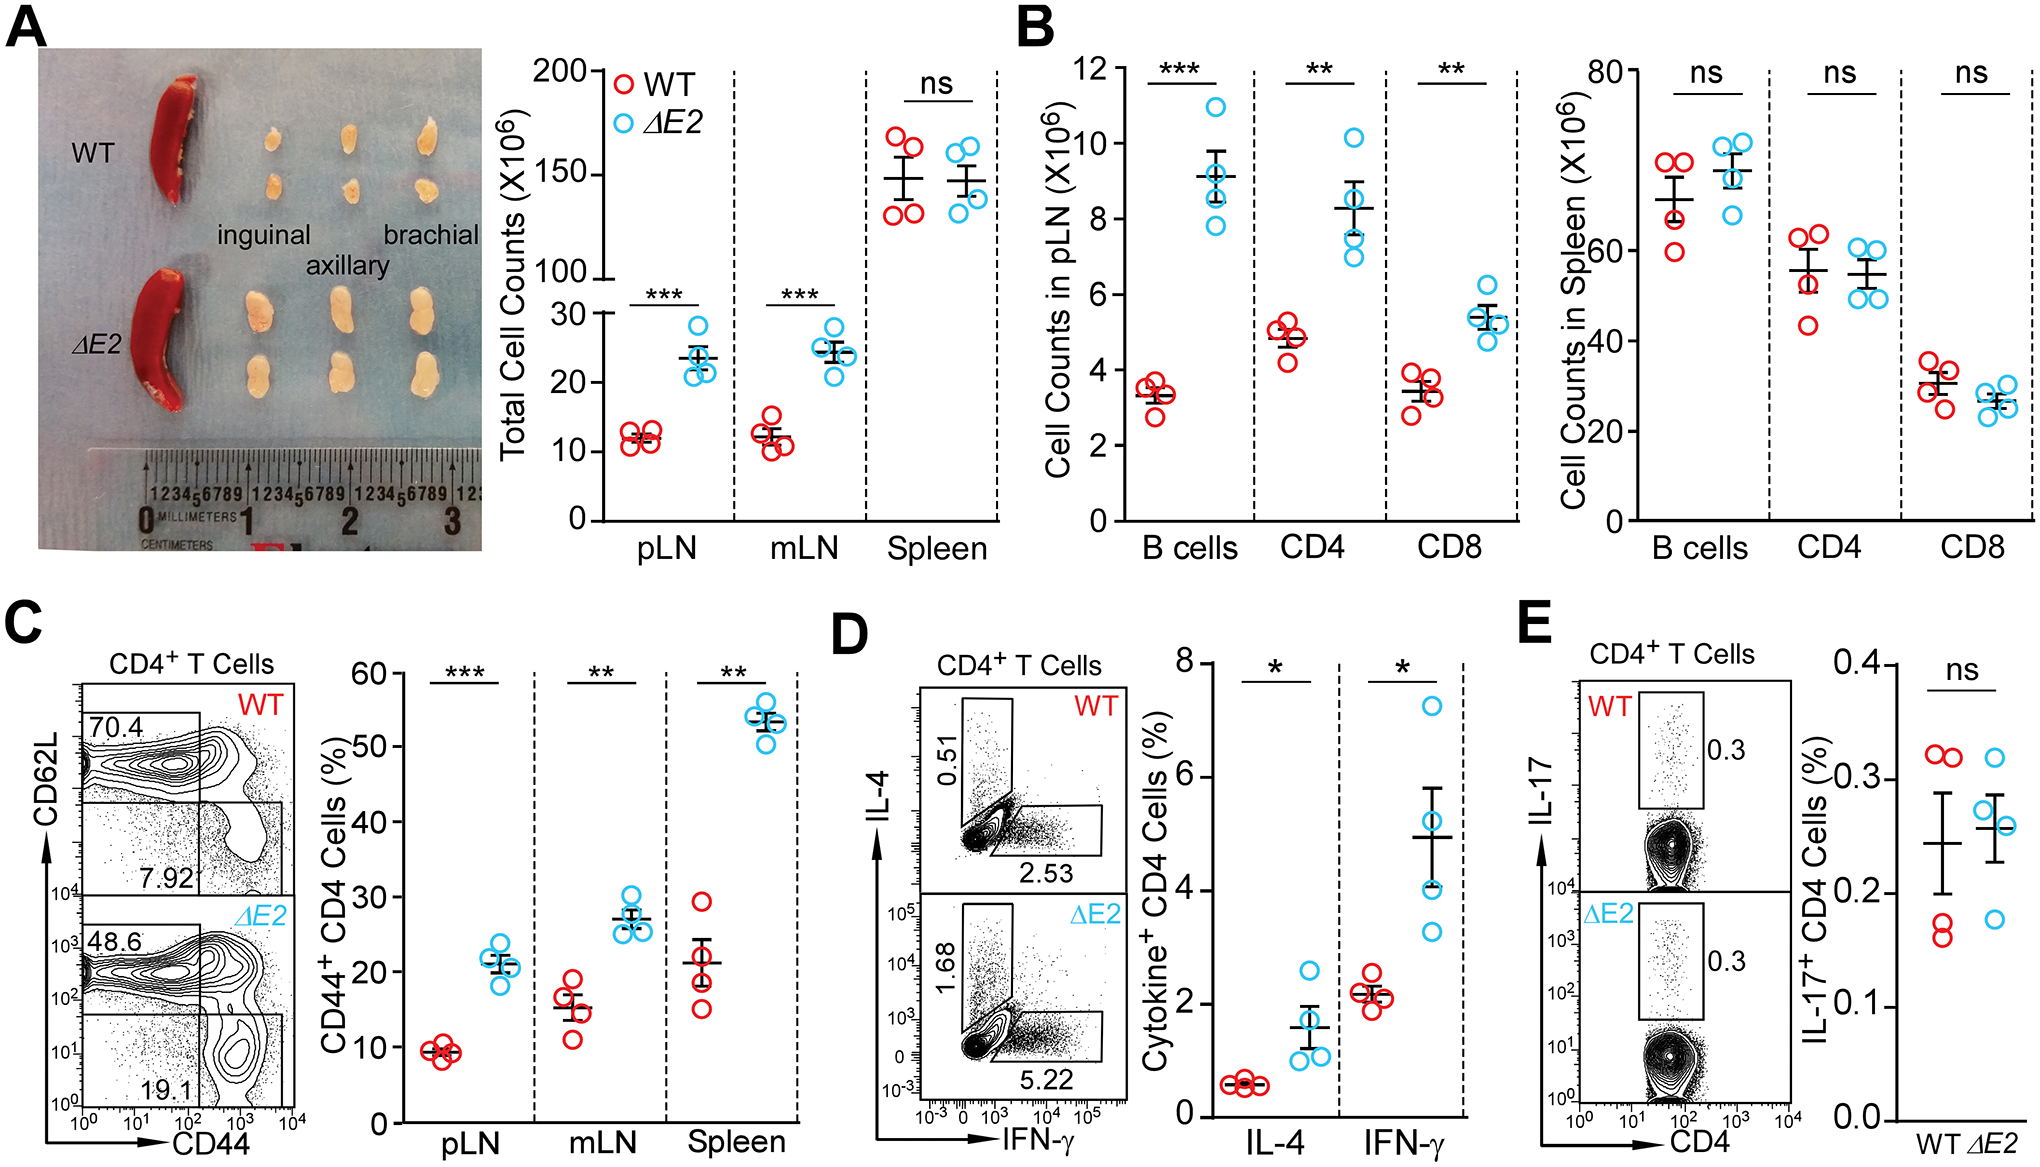
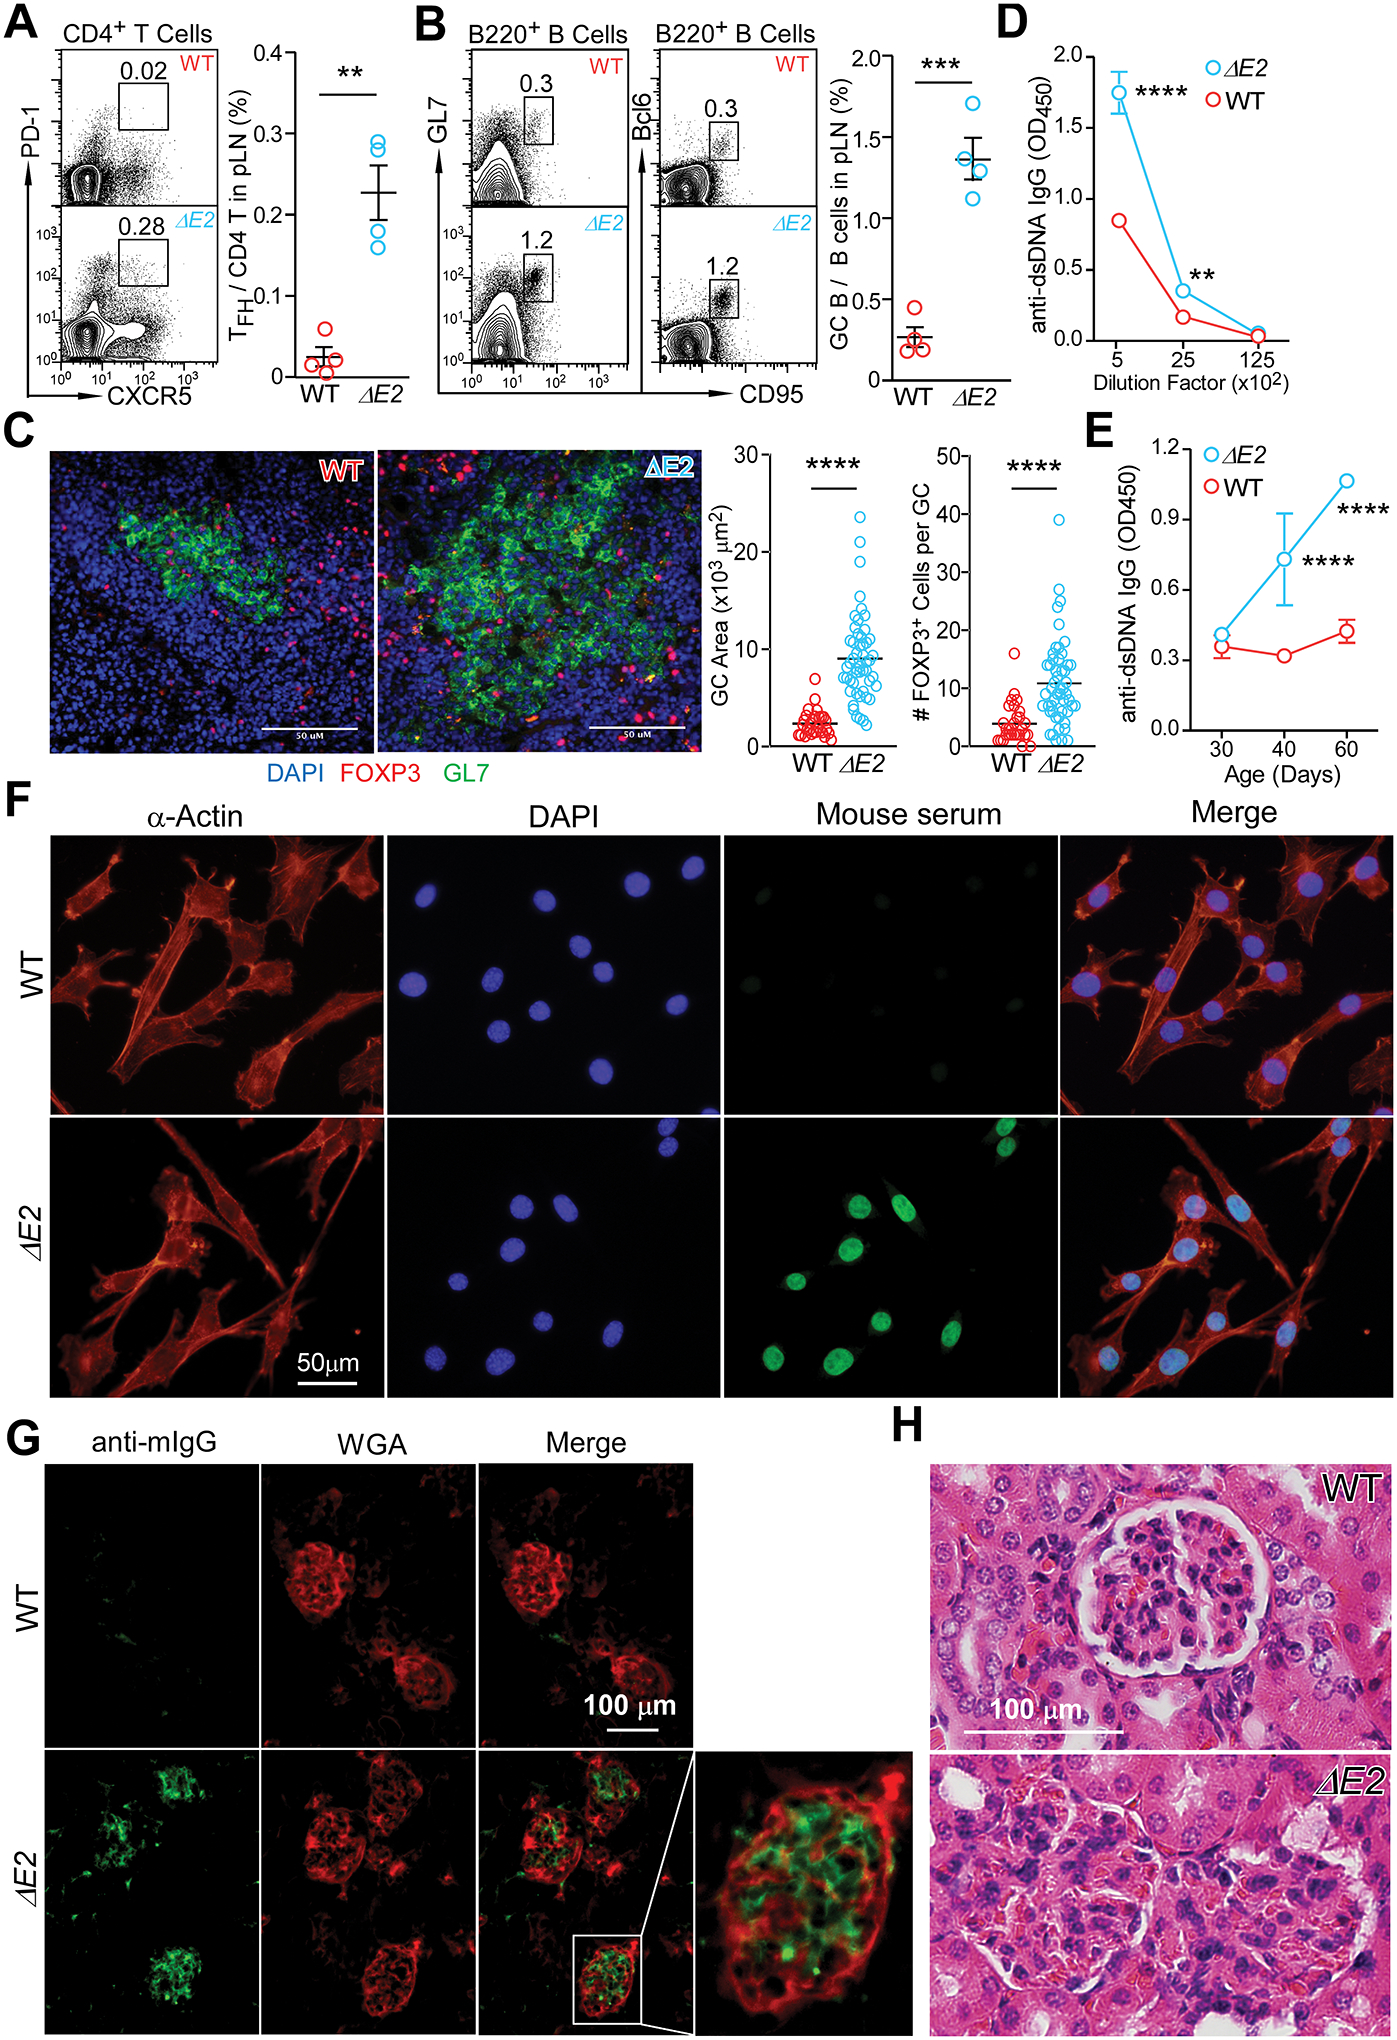
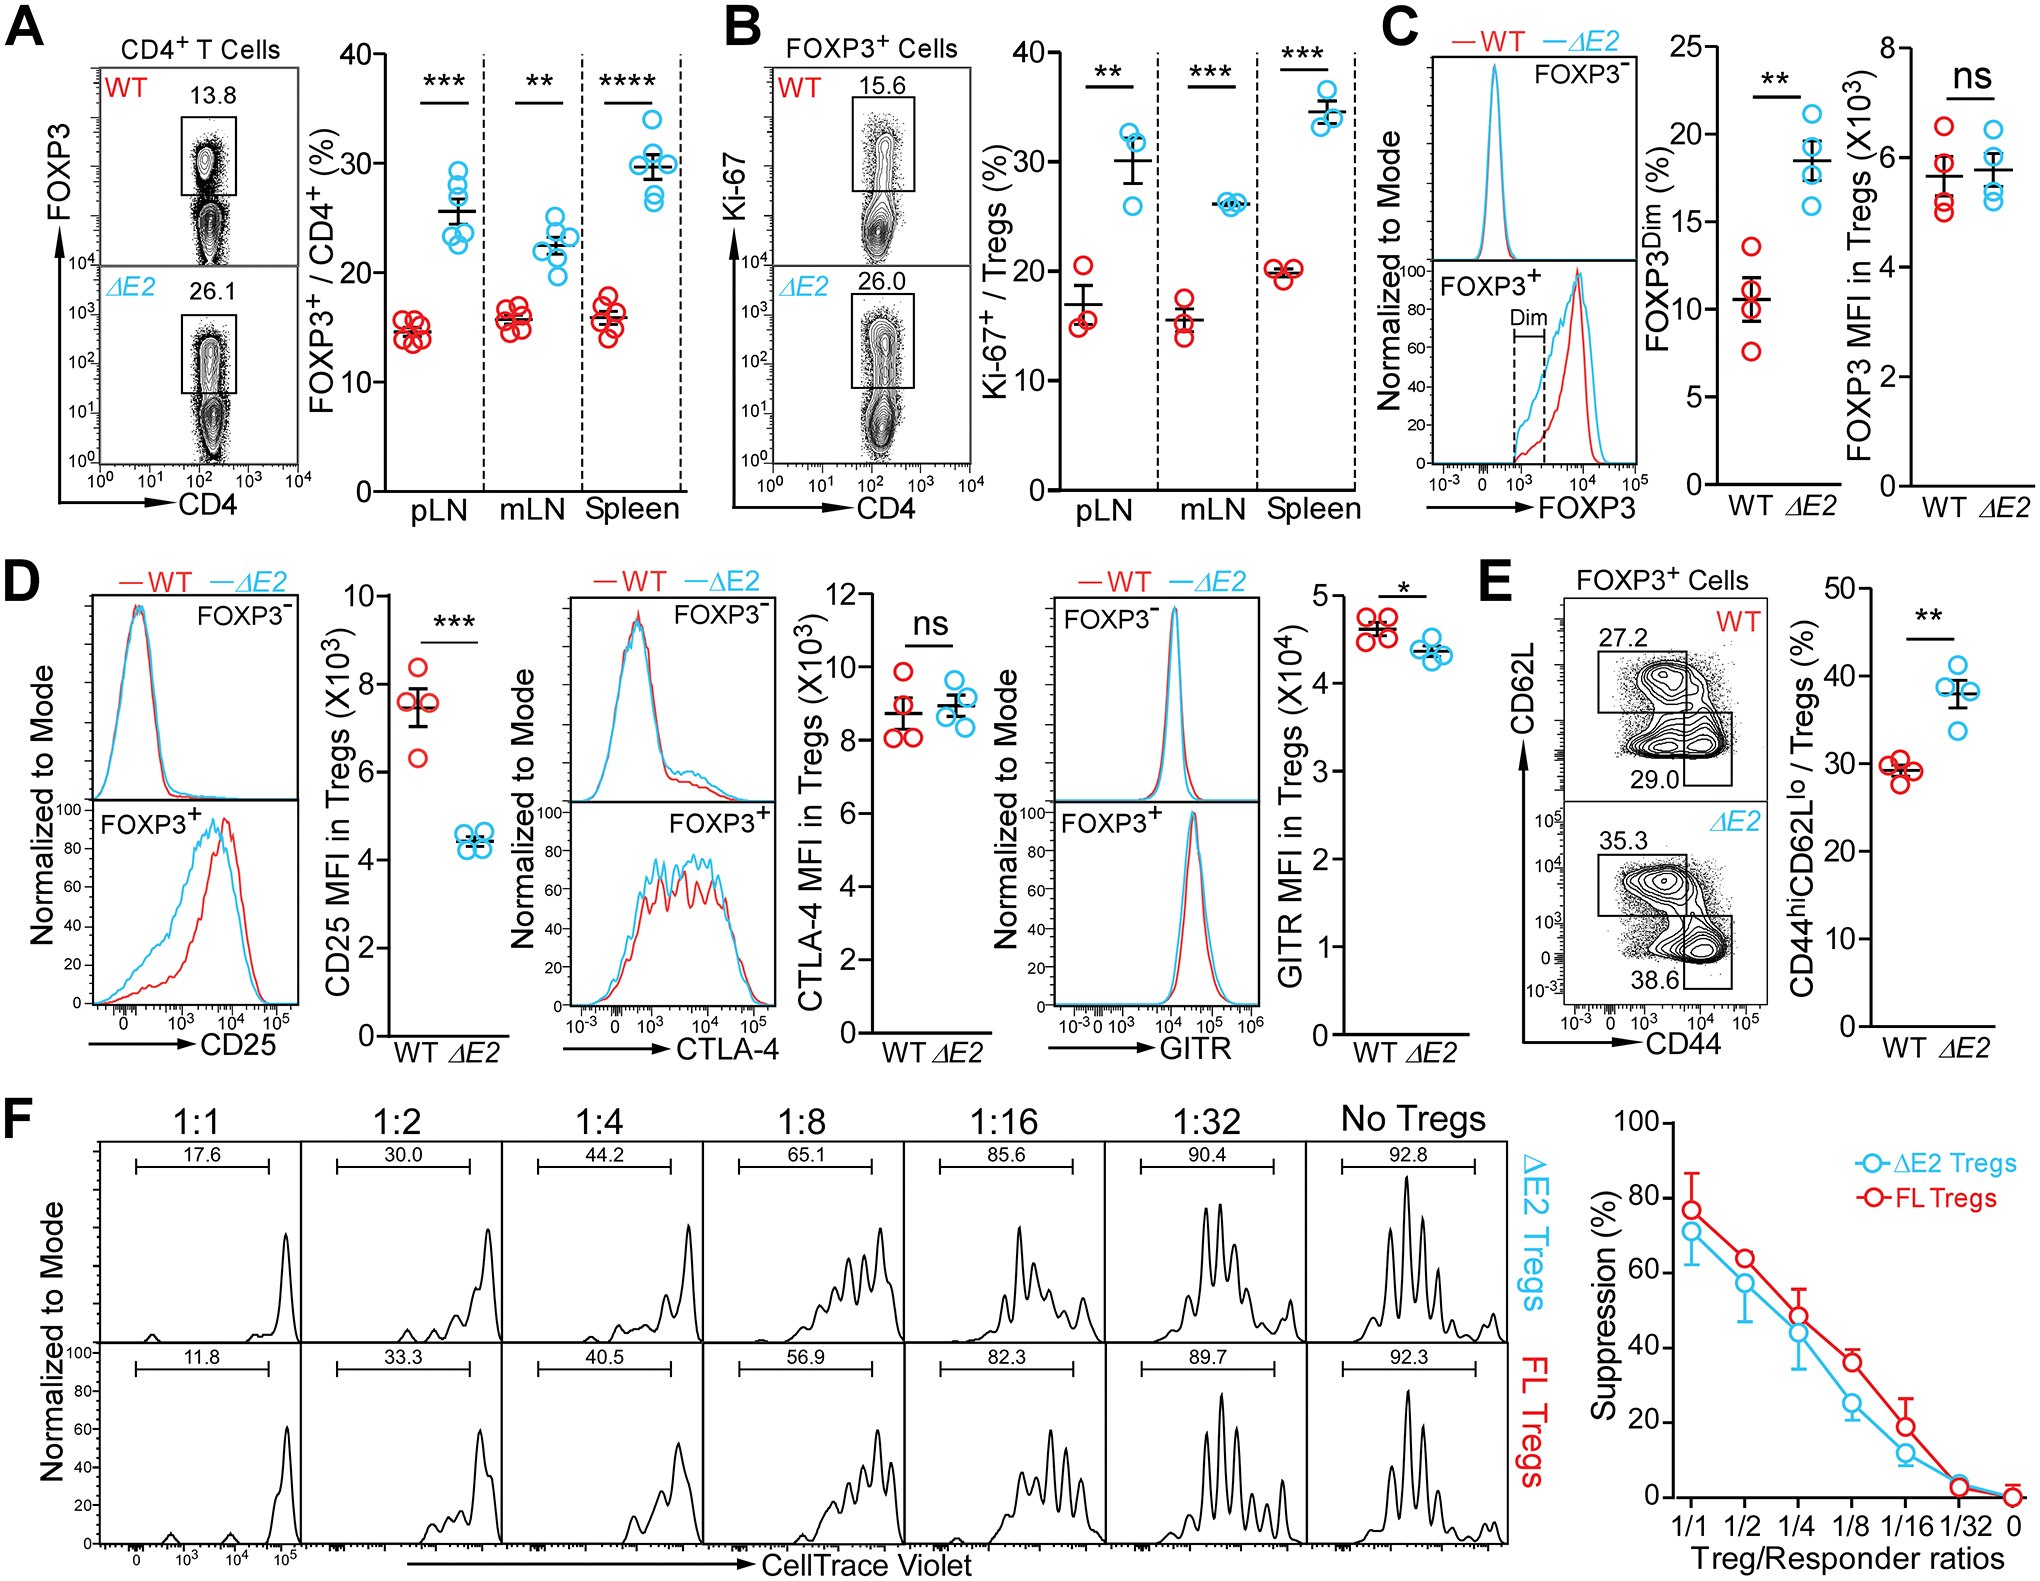
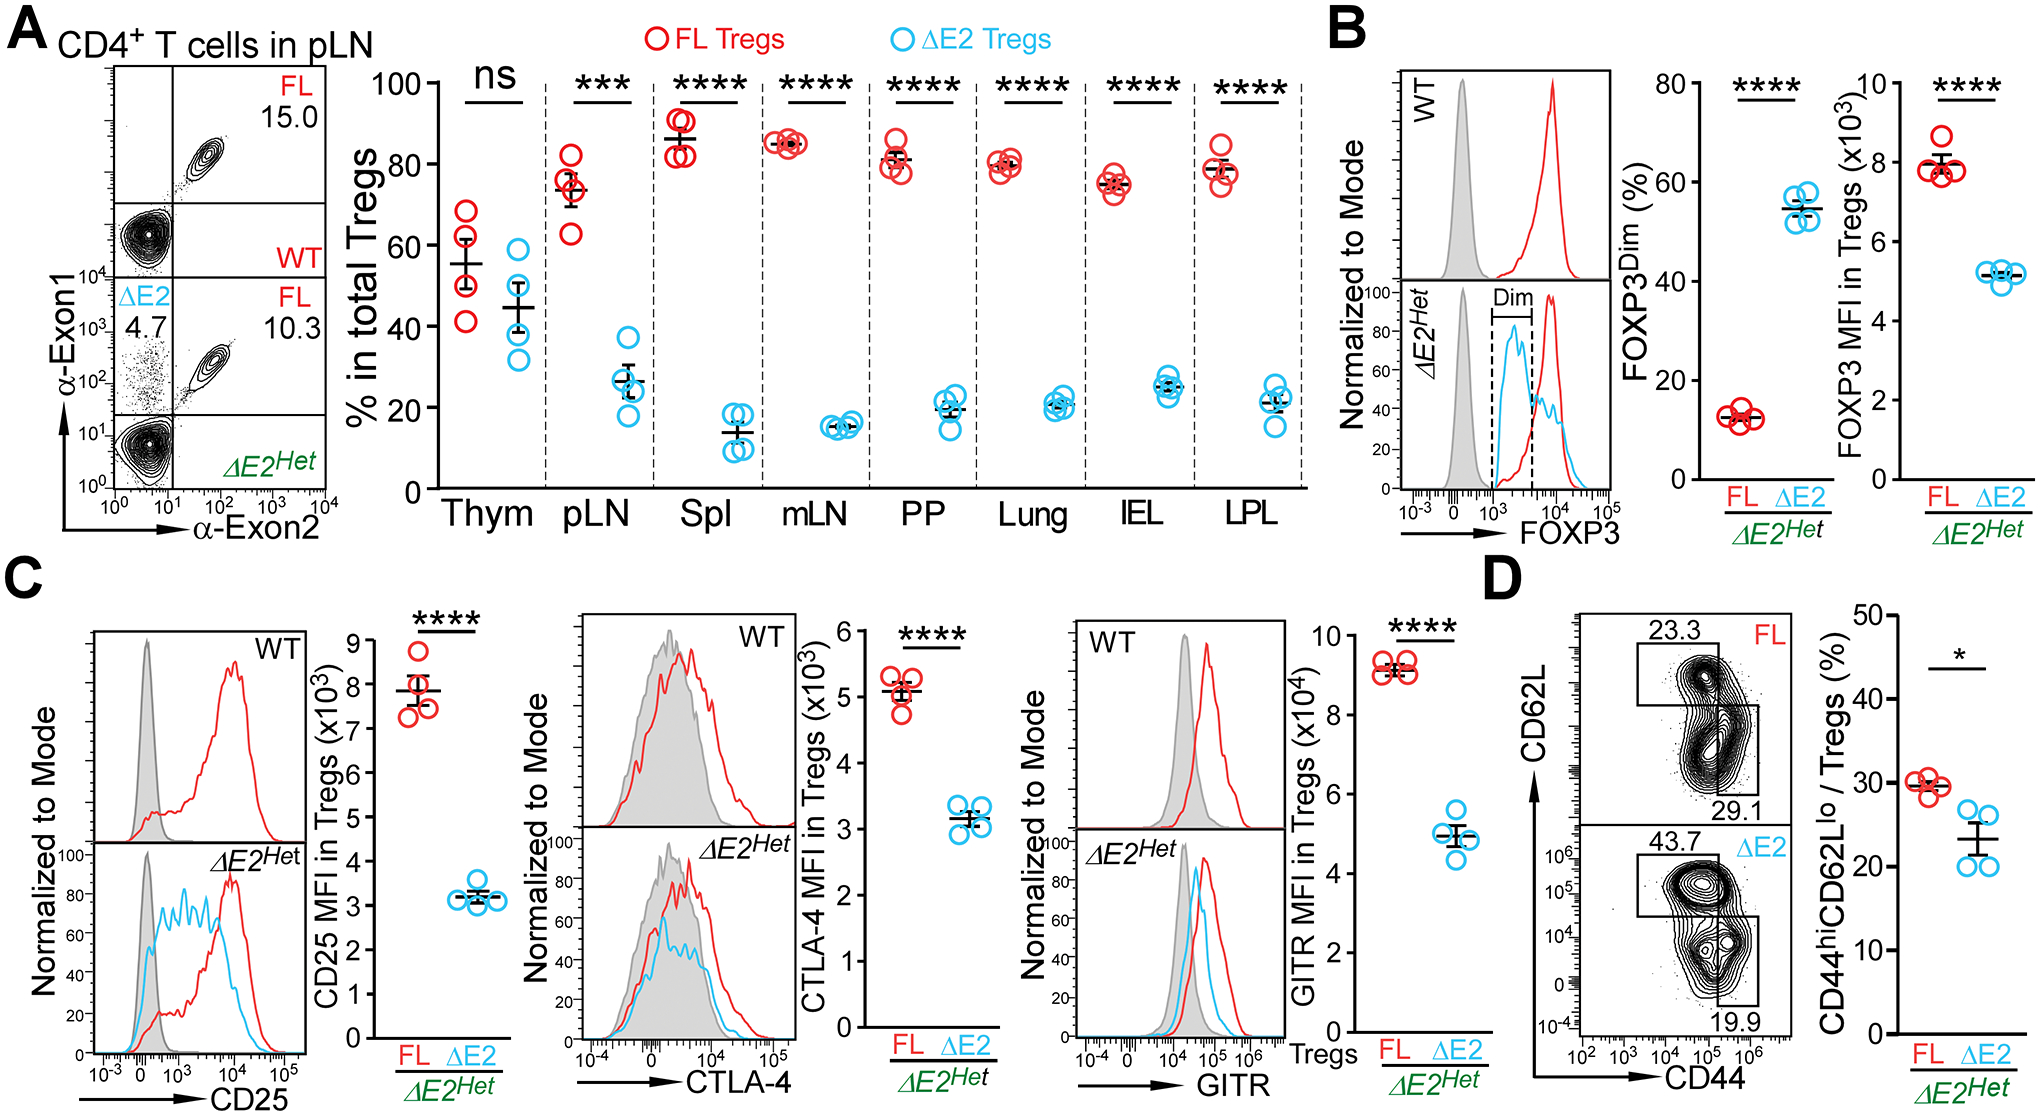
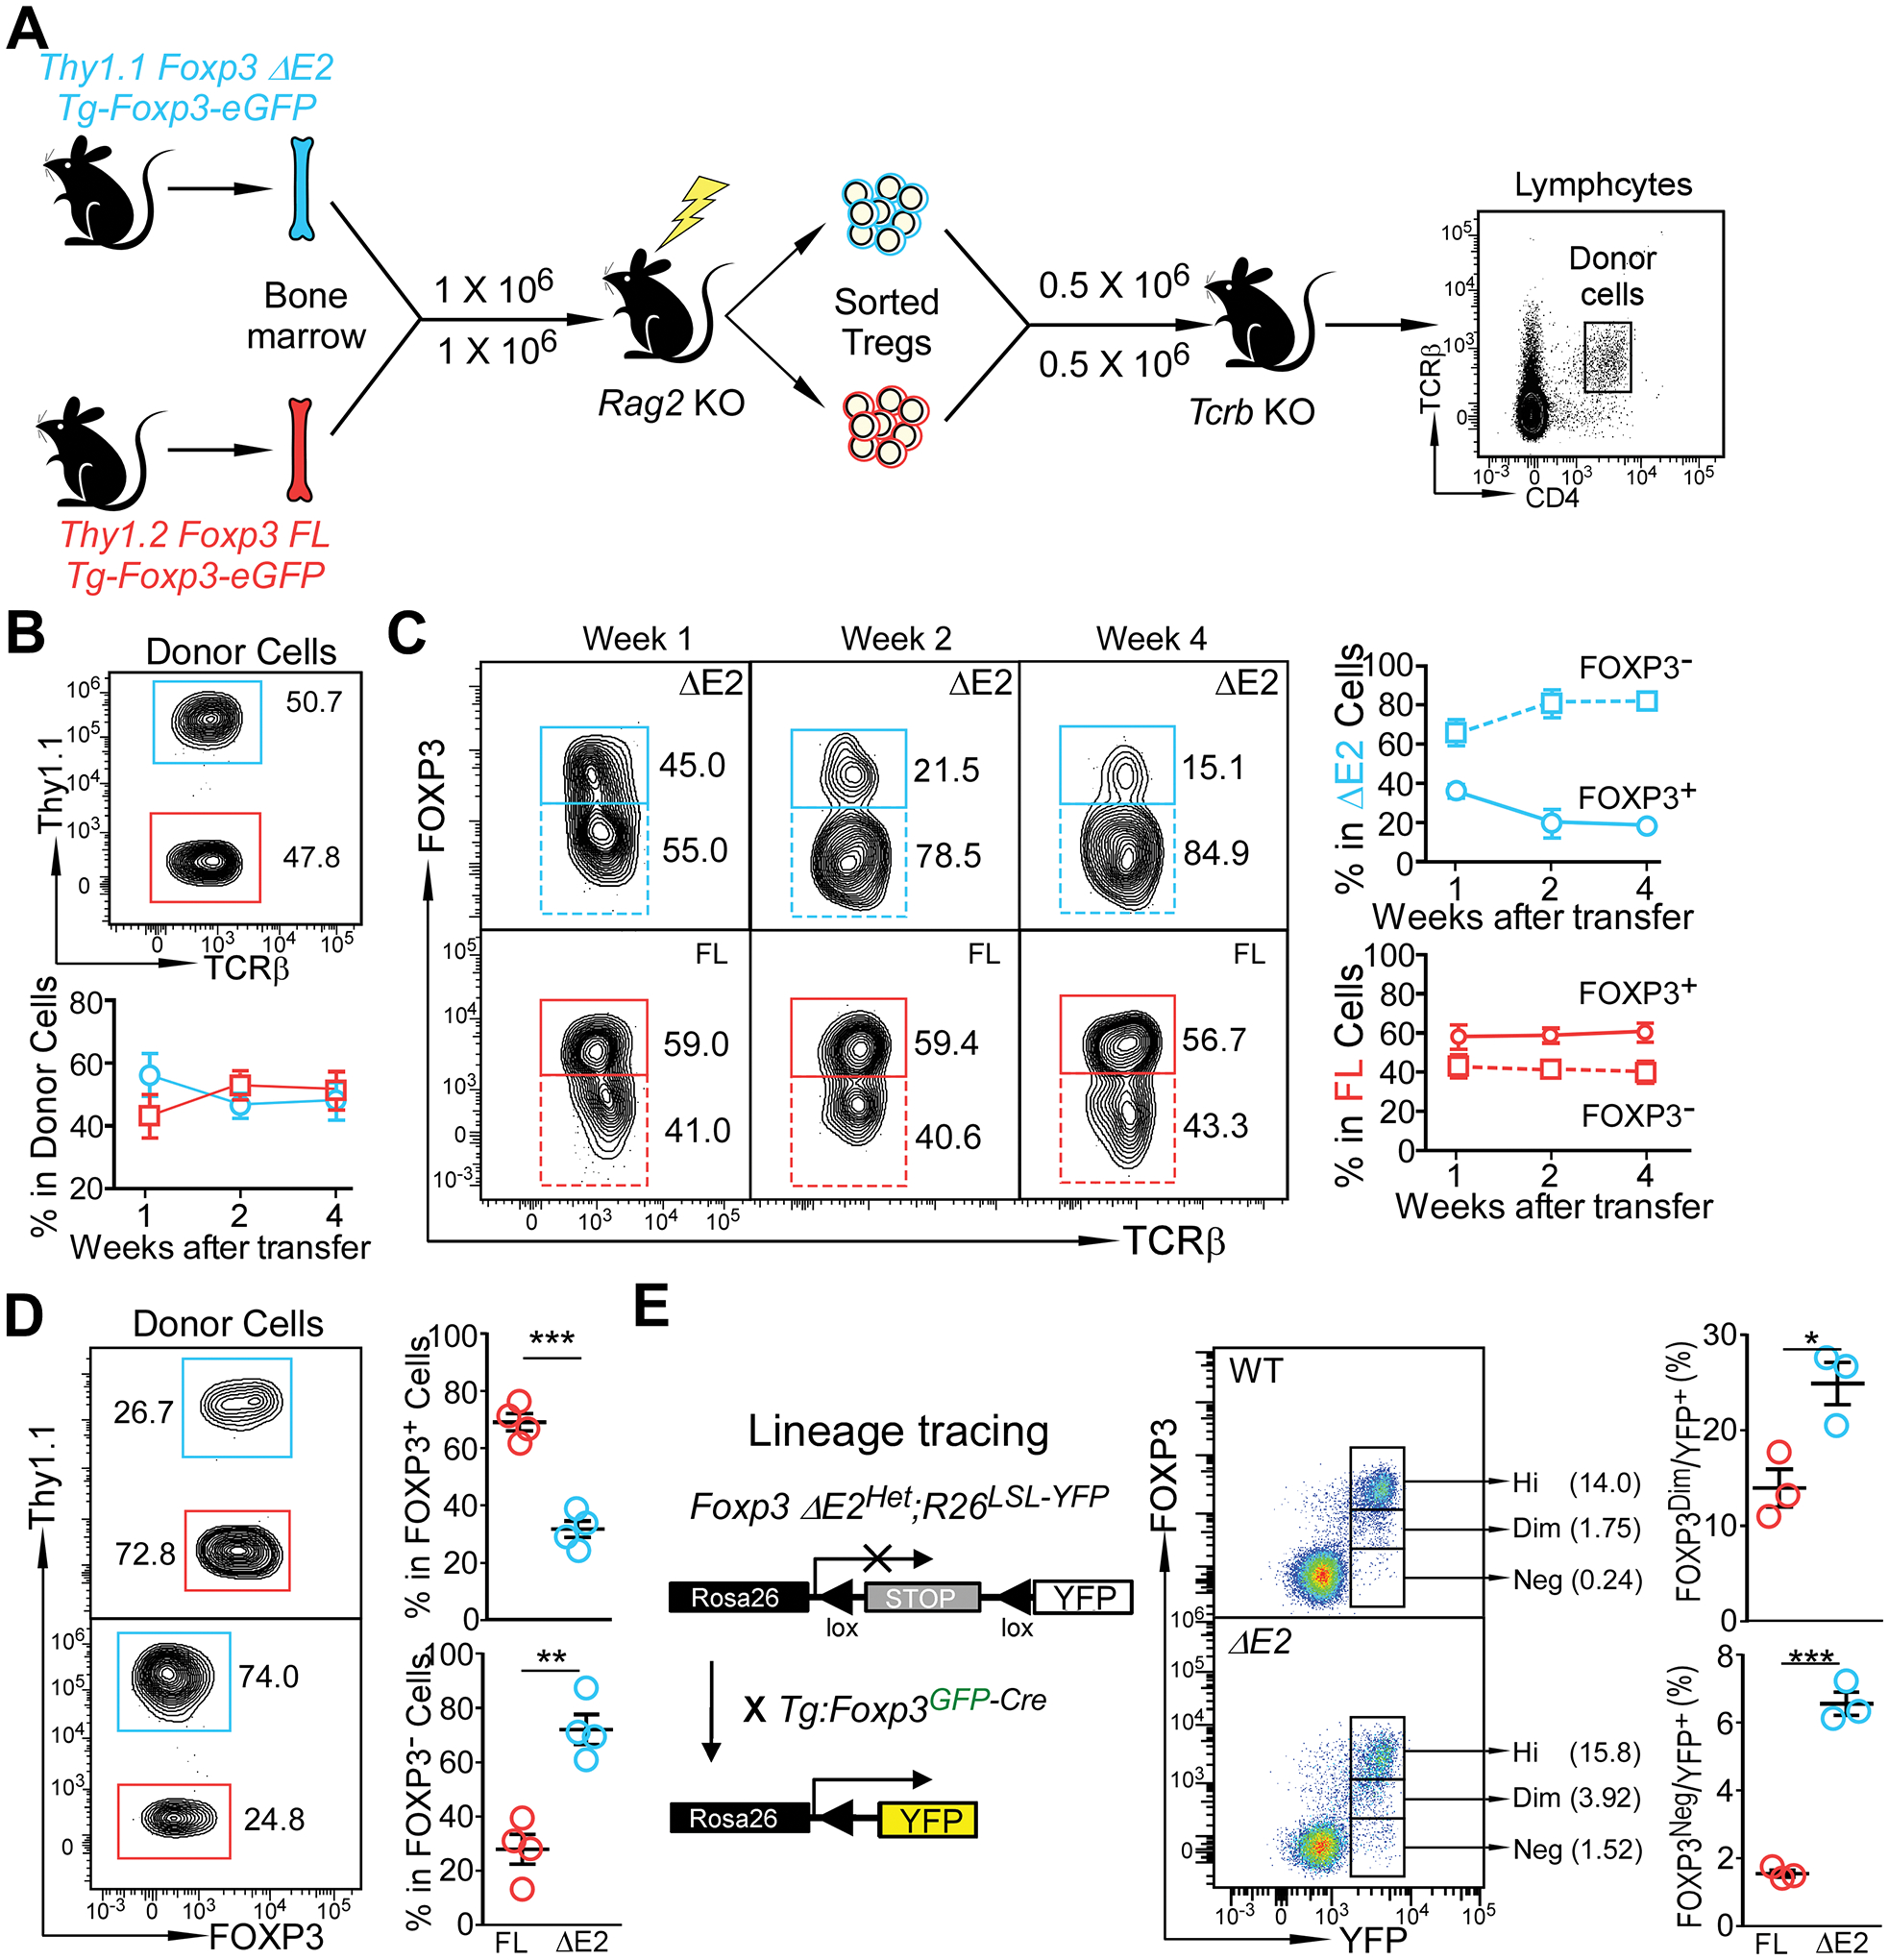
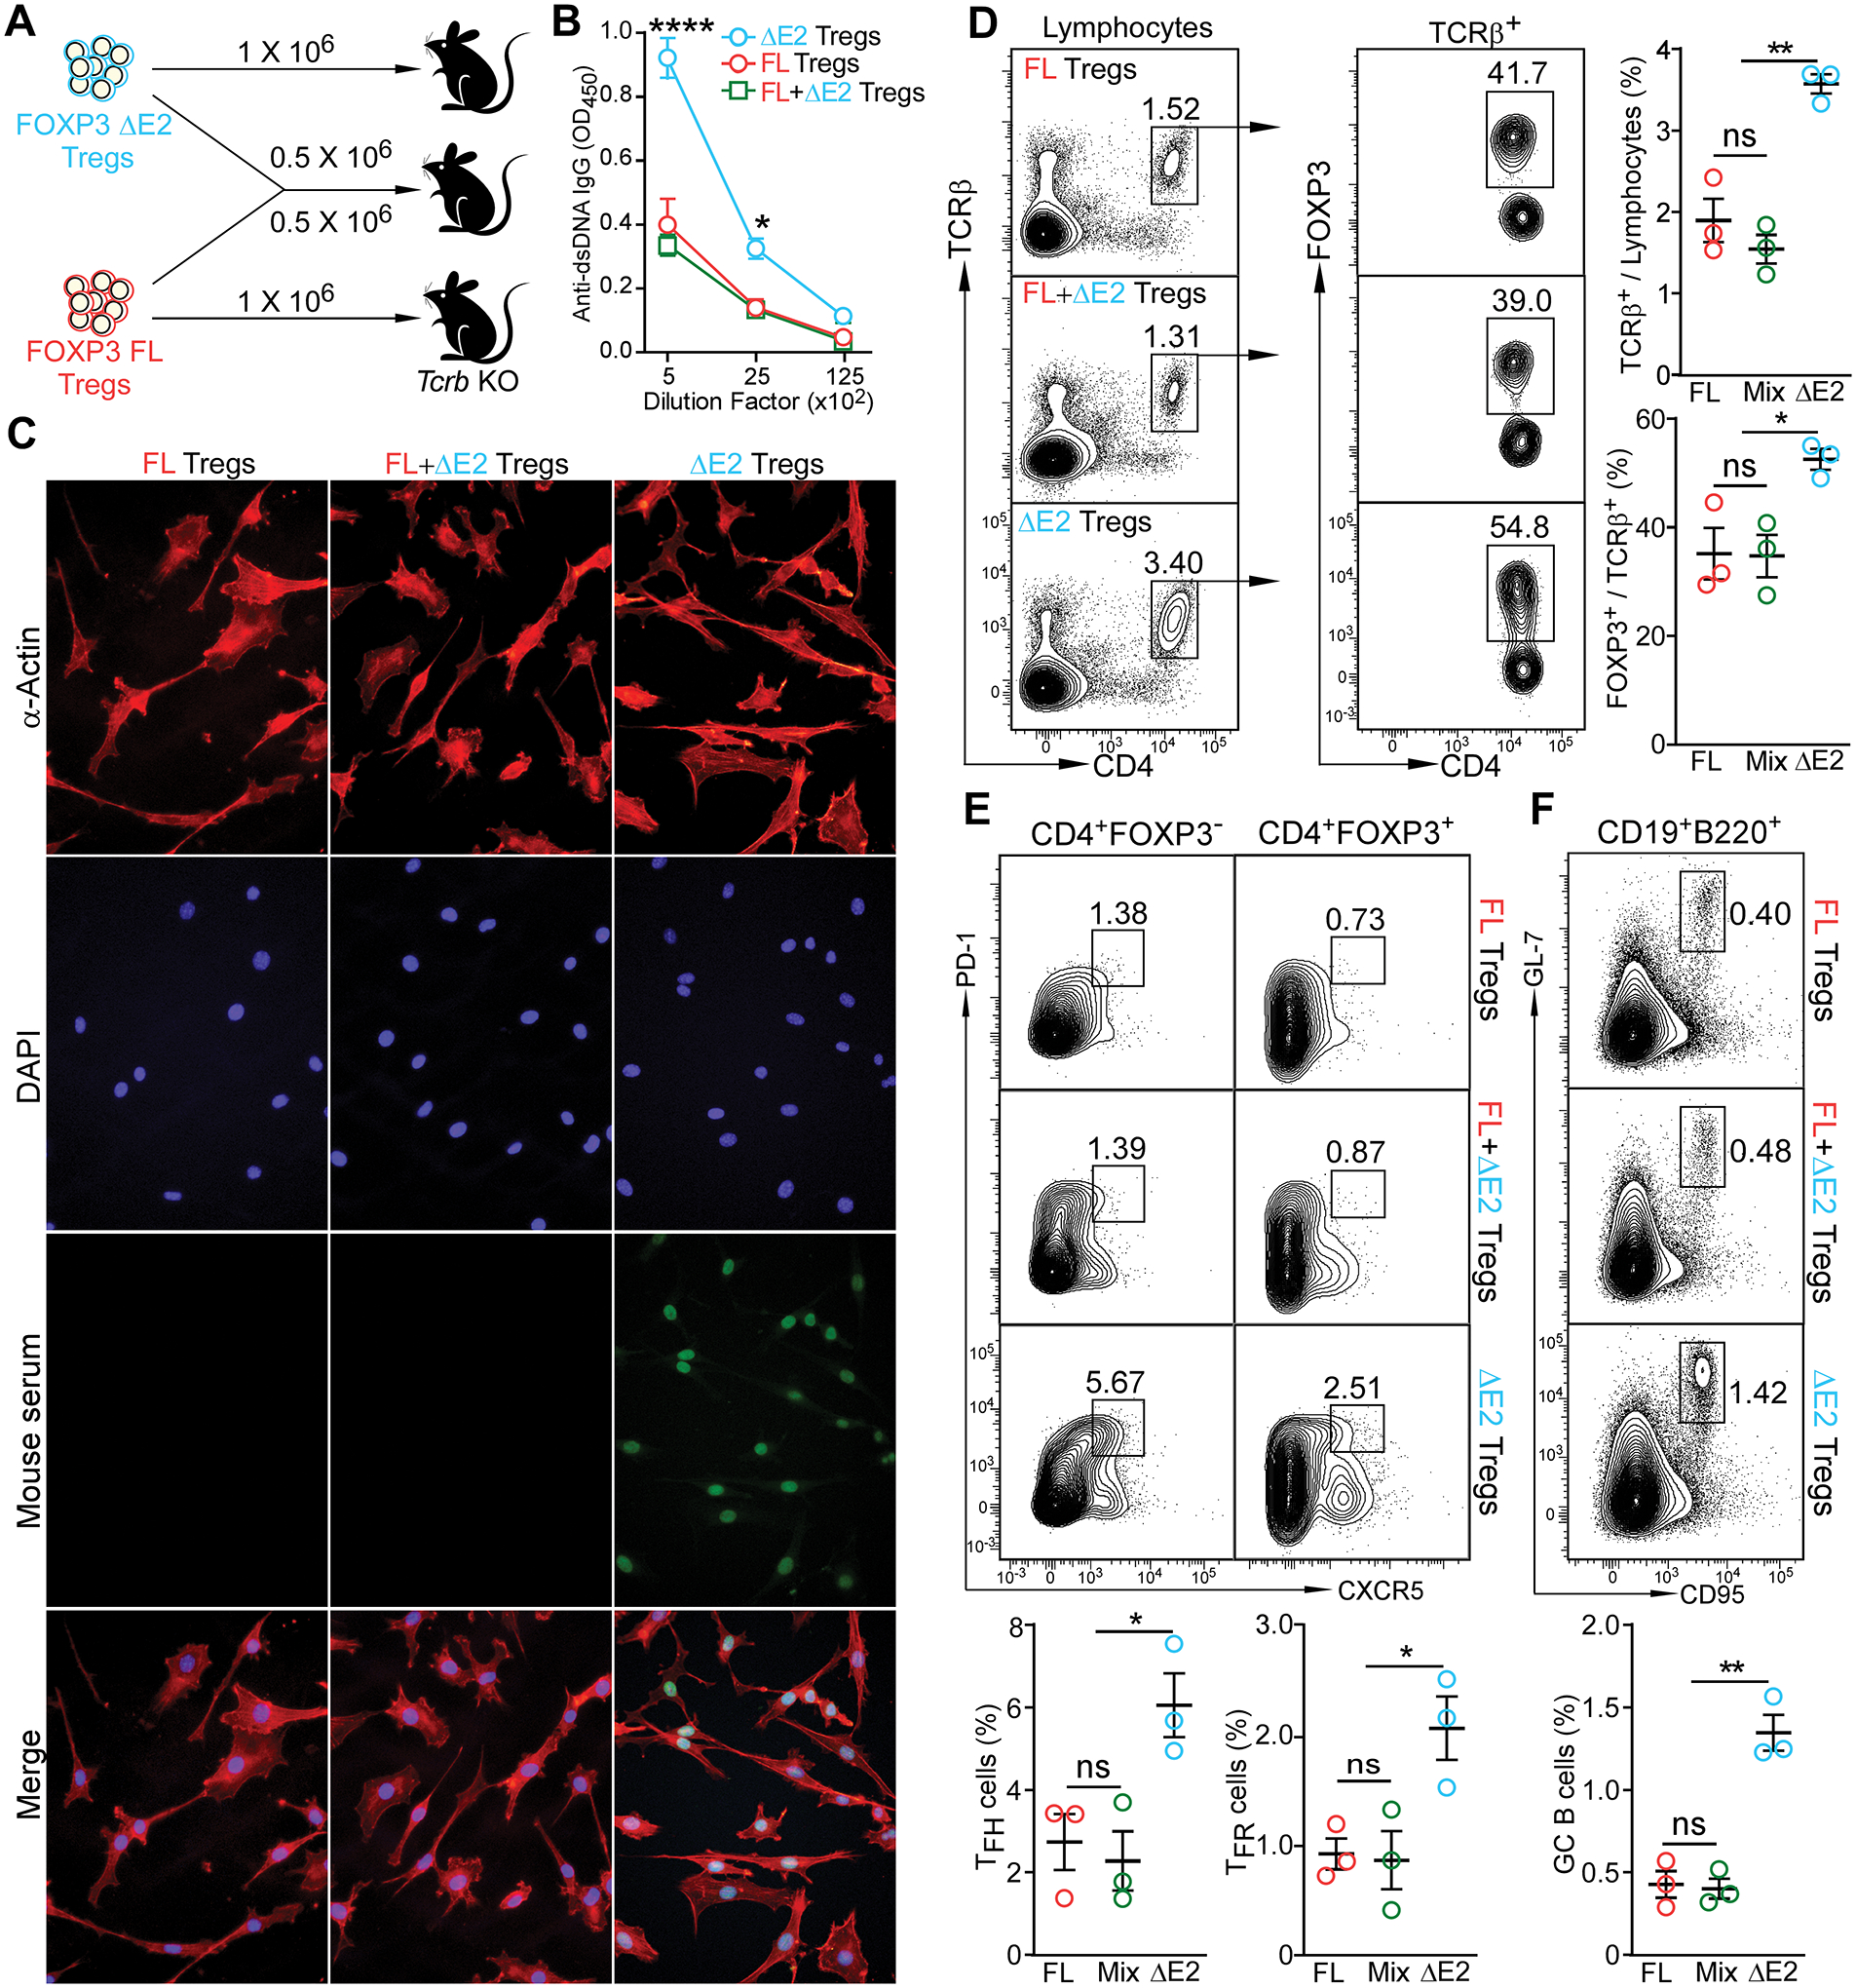
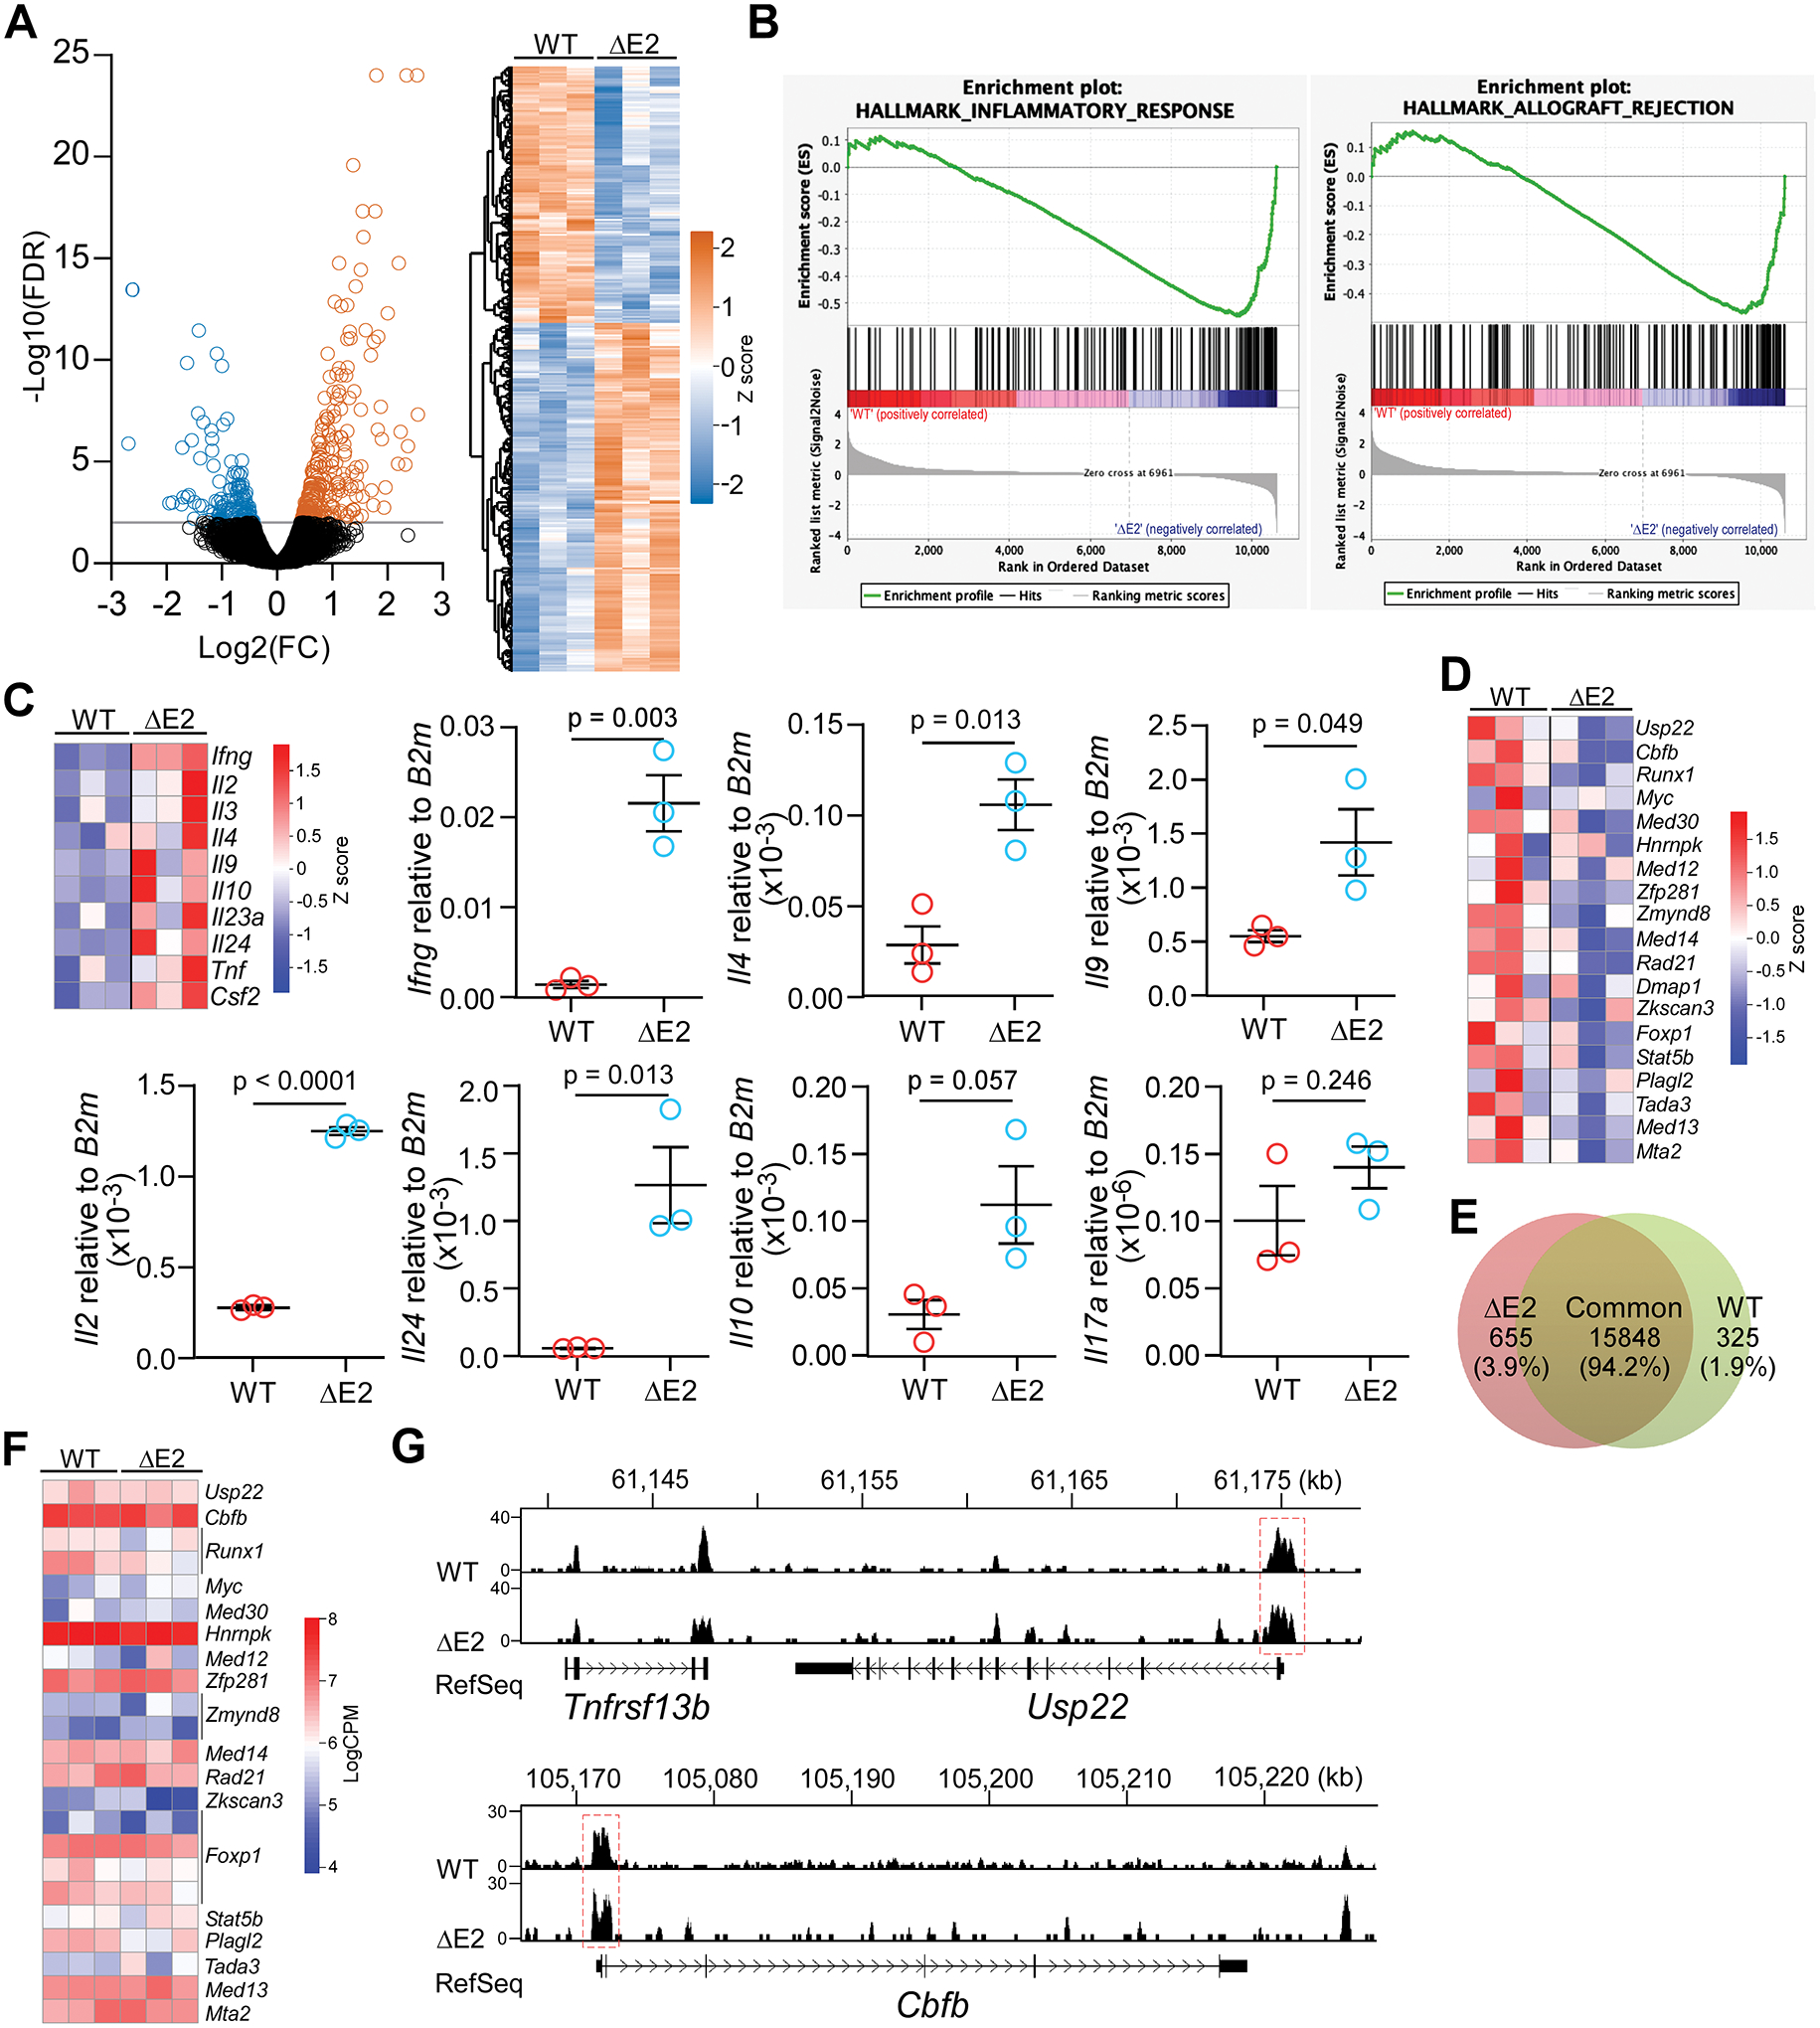
Differing from the mouse Foxp3 gene that encodes only one protein product, human FOXP3 encodes two major isoforms through alternative splicing-a longer isoform (FOXP3 FL) containing all the coding exons and a shorter isoform lacking the amino acids encoded by exon 2 (FOXP3 ΔE2). The two isoforms are naturally expressed in humans, yet their differences in controlling regulatory T cell phenotype and functionality remain unclear. In this study, we show that patients expressing only the shorter isoform fail to maintain self-tolerance and develop immunodeficiency, polyendocrinopathy, and enteropathy X-linked (IPEX) syndrome. Mice with Foxp3 exon 2 deletion have excessive follicular helper T (TFH) and germinal center B (GC B) cell responses, and develop systemic autoimmune disease with anti-dsDNA and antinuclear autoantibody production, as well as immune complex glomerulonephritis. Despite having normal suppressive function in in vitro assays, regulatory T cells expressing FOXP3 ΔE2 are unstable and sufficient to induce autoimmunity when transferred into Tcrb-deficient mice. Mechanistically, the FOXP3 ΔE2 isoform allows increased expression of selected cytokines, but decreased expression of a set of positive regulators of Foxp3 without altered binding to these gene loci. These findings uncover indispensable functions of the FOXP3 exon 2 region, highlighting a role in regulating a transcriptional program that maintains Treg stability and immune homeostasis.


Conflict of interest statement

Competing interests: Authors declare no conflict of interests.

Figures

Figure 1.
Figure 1.. Expression of FOXP3 ΔE2 isoform in IPEX patients with deletion mutations within exon 2 of FOXP3 gene.
(A) Flow cytometric analysis of FOXP3 ΔE2 isoform expression in IPEX patient #3. PBMCs from the patient and a healthy donor were stained with two anti-FOXP3 antibodies. Clone 150D is exon 2-specific while clone 259D recognizes an epitope after exon 2 common for both isoforms. Cells were analyzed either ex vivo (Rest) or stimulated with anti-CD3/anti-CD28 coated beads for 24 hours (Activated). Gated on CD4+ T cells. (B) Flow cytometric analysis of CD25 expression on CD4+ T cells before and after activation. (C) Expression of FOXP3 and CD25 by Tregs (gated on CD4+259D+) from healthy control (green line) and patient #3 (blue line) before or after activation. Gray lines were 259D cells. Numbers in the parenthesis represent mean fluorescence intensity (MFI). Similar results as in A-C were obtained with PBMCs from patient #2. (D) Deletion mutations in FOXP3 exon 2 identified in IPEX patients #1, #2 and #4 lead to expression of only the FOXP3 ΔE2 isoform. Genomic DNA fragment containing exons 1–7 of the FOXP3 gene from a healthy control and patients #1, #2, and #4 were cloned into the pcDNA3-NV5 vector in-frame with an N-terminal V5 epitope tag (upper panel). Jurkat T cells transfected with the expression constructs were examined by Western blot with an anti-V5 antibody.
Figure 2.
Figure 2.. Altered immune homeostasis in Foxp3 ΔE2 mice at 8 weeks of age.
(A) Size and cellularity of lymph nodes and spleen in WT and Foxp3 ΔE2 mice. (B) Flow cytometric analysis of B220+ B cells, CD4+ and CD8+ T cells in peripheral (pLN) and spleen of WT and Foxp3 ΔE2 mice. (C) Expression of CD62L and CD44 in CD4+ T cells of WT and Foxp3 ΔE2 mice. (D) Expression of IL-4 and IFN-γ in CD4+ T cells ex vivo from pLN of WT and Foxp3 ΔE2 mice. (E) Expression of IL-17 in CD4+ T cells ex vivo from pLN of WT and Foxp3 ΔE2 mice. Data represent mean ± SEM from one of ≥ 2 experiments. ns: not significant; *: p < 0.05; **: p < 0.01; ***: p < 0.001 by multiple t-tests (A - D) or two-tailed t-test (E).
Figure 3.
Figure 3.. Foxp3 exon 2 deletion results in a systemic autoimmune disease.
(A) Flow cytometric analysis of CD4+PD-1+CXCR5+ follicular helper T cells (TFH) in peripheral lymph nodes of WT and Foxp3 ΔE2 mice. (B) Flow cytometric analysis of B220+GL-1+CD95+Bcl6+ germinal center B (GC B) cells in peripheral lymph nodes of WT and Foxp3 ΔE2 mice. (C) Spontaneous germinal centers in WT and Foxp3 ΔE2 mice were examined by immunohistochemistry. Representative images (left) and quantification of GCs (right). (D) ELISA quantification of anti-dsDNA IgG in the serum of WT and Foxp3 ΔE2 mice (n = 6–7). (E) Time course of anti-dsDNA IgG in the serum of Foxp3 ΔE2 mice. Sera from WT and Foxp3 ΔE2 mice at indicated ages were diluted at 1:500 (n = 10 mice). (F) Representative images of serum anti-ANA IgG (at 1:160 dilution of serum) detected with fixed mouse 3T3 fibroblast cells. Mouse serum: sera collected from WT or Foxp3 ΔE2 mice were used as primary antibody and FITC anti-mouse IgG was used as secondary antibody to detect the existence of anti-ANA IgG in sera. (G) Immunofluorescence of kidney glomerulus sections showing IgG deposits in Foxp3 ΔE2 mice. WGA: wheat germ agglutinin. (H) Kidney glomerulus sections stained with hematoxylin and eosin (H&E). Data represent mean ± SEM (A-B) or mean ± SD (D&E) from one of ≥ 2 independent experiments. **: p < 0.01; ***: p < 0.001; ****: p < 0.0001 by two-tailed t-test (A-C) or two-way ANOVA with Bonferroni post-hoc test (D&E).
Figure 4.
Figure 4.. FOXP3 ΔE2 Tregs display more activated phenotypes, reduced phenotypic markers, but similar suppressive function.
(A) Flow cytometric analysis of Treg frequencies in secondary lymphoid organs of WT and Foxp3 ΔE2 mice. (B) Proliferation of Treg cells in WT and Foxp3 ΔE2 mice as marked with Ki-67 expression. (C) Mean fluorescent intensity (MFI) of FOXP3 and percentage of FOXP3Dim in Treg cells of WT and Foxp3 ΔE2 mice. (D) Mean fluorescent intensity (MFI) of CD25, CTLA-4 and GITR in Treg cells of WT and Foxp3 ΔE2 mice. (E) Flow cytometric analysis of CD44 and CD62L in Treg cells of WT and Foxp3 ΔE2 mice. Data in (A - E) represent mean ± SEM from one of ≥ 2 independent experiments. **: p < 0.01; ***: p < 0.001; ****: p < 0.0001 by multiple t-tests (A & B) or two-tailed t-test (C – E). (F) Suppressive function of Foxp3 ΔE2 Tregs vs Foxp3 FL Tregs in vitro. Tregs were FACS purified from Foxp3 ΔE2;BAC-Foxp3eGFP and Foxp3 FL;BAC-Foxp3eGFP mice. Data represent mean ± SEM (n = 3 mice) from one of 2 independent experiments. Means were compared by two-way ANOVA with Bonferroni post-hoc test. No difference in suppression by FOXP3 ΔE2 and FOXP3 FL Tregs.
Figure 5.
Figure 5.. Intrinsic defects of FOXP3 ΔE2 Tregs in heterozygous Foxp3 exon 2 deletion female mice.
(A) FOXP3 FL and FOXP3 ΔE2 Treg populations in heterozygous Foxp3 exon 2 deletion (ΔE2Het) female mice at the age of 2 months. Thym: thymus; pLN: peripheral lymph nodes; Spl: spleen; mLN: mesenteric lymph nodes; PP: Peyer’s Patches; IEL: intraepithelial lymphocytes of the gut; LPL: lamina propria lymphocytes of the gut. (B) Expression of FOXP3 in FOXP3 FL and FOXP3 ΔE2 Tregs in ΔE2Het female mice. (C) Mean fluorescent intensity (MFI) of phenotypic Treg markers CD25, CTLA-4, and GITR in FOXP3 FL and FOXP3 ΔE2 Tregs in ΔE2Het female mice. Grey line: FOXP3 cells; Red line: FOXP3 FL Tregs; Blue line: FOXP3 ΔE2 Tregs. (D) Flow cytometric analysis of CD44 and CD62L in Treg cells expressing either the FOXP3 FL (red) or FOXP3 ΔE2 (blue) isoform in pLN of ΔE2Het female mice. Data represent mean ± SEM from one of > 2 independent experiments.*: p < 0.05 **: p < 0.01; ***: p < 0.001; ****: p < 0.001 by paired two-tailed t-test.
Figure 6.
Figure 6.. Instability of FOXP3 ΔE2 Tregs.
(A) Experimental design to examine stability of FOXP3 FL and FOXP3 ΔE2 Tregs. FOXP3 ΔE2 Tregs (Thy1.1+) and FOXP3 FL Tregs (Thy1.2+) were sort purified from mixed bone marrow chimeras. The Tregs were mixed at a 1:1 ratio, adoptively transferred (i.v.) into Tcrb deficient mice, and their identity was tracked by flow cytometry. (B) Percentage of Thy1.1+ (FOXP3 ΔE2 Treg derived) and Thy1.1 (FOXP3 FL Treg derived) donor cells in the blood over the 4 week period. (C) Percentage of Thy1.1+ (FOXP3 ΔE2 Treg derived) and Thy1.1 (FOXP3 FL Treg derived) donor cells still remaining FOXP3+ over time. (D) Flow cytometric analysis of FOXP3 expression in FOXP3 ΔE2 and FOXP3 FL Treg derived donor cells four weeks after transfer. (E) Tracking Treg stability using lineage tracing mice. Data represent mean ± SEM (n = 4 mice for B-D; and n = 3 mice for E) from one of 2 independent experiments. **: p < 0.01; ***: p < 0.001 by two-tailed t-test.
Figure 7.
Figure 7.. FOXP3 ΔE2 Tregs are sufficient to induce autoantibody and enhanced TFH and GC B cell response.
(A) Experimental design. FOXP3 FL and FOXP3 ΔE2 Tregs were purified by FACS sorting. 1 × 10⁶ purified Tregs were adoptively transferred into Tcrb deficient recipients by tail vail injection. Recipient mice were analyzed 3 months after cell transfer. (B) ELISA quantification of anti-dsDNA IgG in the serum of the recipient mice. (C) Representative images of serum anti-ANA IgG (at 1:80 dilution of serum) in the recipient mice detected with fixed mouse 3T3 fibroblast cells. Mouse serum: sera collected from recipient mice receiving indicated Tregs were used as primary antibody and FITC anti-mouse IgG was used as secondary antibody to detect the existence of anti-ANA IgG in sera. (D) Percentage of donor cells and percentage of donor cells still remaining FOXP3+ in the spleen of recipient mice. (E) TFH (left panels) and TFR (right panels) in the spleen of recipient mice. (F) Germinal center B cells in the spleen of recipient mice. Data represent mean ± SEM (n = 3 mice) from one of 2 independent experiments. ns: not significant; *: p < 0.05; **: p < 0.01; ****: p < 0.0001 by two-way ANOVA (B) or one-way ANOVA (D – F) with Bonferroni post-hoc test.
Figure 8.
Figure 8.. FOXP3 isoforms regulate target gene expression mostly independent of DNA binding.
(A) Volcano plot and hierarchical clustering heatmap showing differential gene expression in FOXP3 ΔE2 Tregs. (B) Up-regulated genes in FOXP3 ΔE2 Tregs are enriched in inflammatory response and allograft rejection gene sets. (C) Heatmap (RNA-seq) and RT-qPCR showing up-regulation of cytokines in FOXP3 ΔE2 Tregs. (D) Heatmap of Foxp3 positive regulators in FOXP3 ΔE2 and FOXP3 FLTregs. (E) FOXP3 binding peaks enriched in FOXP3 ΔE2 vs WT (FOXP3 FL) Tregs (change ≥ 1.5 folds, p < 0.05). (F) Heatmap of FOXP3 ΔE2 and FOXP3 FL binding (LogCPM) to the loci of Foxp3 positive regulators in (D). (G) Representative plots of FOXP3 ChIP-seq reads from FOXP3 ΔE2 and FOXP3 FL (WT) Tregs at the Usp22 and Cbfb gene loci. n = 3 mice/group for both RNA-seq and ChIP-seq analysis. Data in (C) represent mean ± SEM (n = 3 mice) with p by two tailed t-test.

Comment in

References

    1. Sakaguchi S, Miyara M, Costantino CM, Hafler DA, FOXP3+ regulatory T cells in the human immune system. Nat Rev Immunol 10, 490–500 (2010). - PubMed
    1. Sakaguchi S, Yamaguchi T, Nomura T, Ono M, Regulatory T cells and immune tolerance. Cell 133, 775–787 (2008). - PubMed
    1. Curotto de Lafaille MA, Kutchukhidze N, Shen S, Ding Y, Yee H, Lafaille JJ, Adaptive Foxp3+ regulatory T cell-dependent and -independent control of allergic inflammation. Immunity 29, 114–126 (2008). - PubMed
    1. Josefowicz SZ, Niec RE, Kim HY, Treuting P, Chinen T, Zheng Y, Umetsu DT, Rudensky AY, Extrathymically generated regulatory T cells control mucosal TH2 inflammation. Nature 482, 395–399 (2012). - PMC - PubMed
    1. Allan SE, Passerini L, Bacchetta R, Crellin N, Dai M, Orban PC, Ziegler SF, Roncarolo MG, Levings MK, The role of 2 FOXP3 isoforms in the generation of human CD4+ Tregs. J Clin Invest 115, 3276–3284 (2005). - PMC - PubMed

Publication types