. 2022 Jun 24;17(6):e0264651.
doi: 10.1371/journal.pone.0264651. eCollection 2022.

Chaperonin containing TCP1 as a marker for identification of circulating tumor cells in blood

Affiliations

Chaperonin containing TCP1 as a marker for identification of circulating tumor cells in blood

Amanda Cox et al. PLoS One. .

Abstract

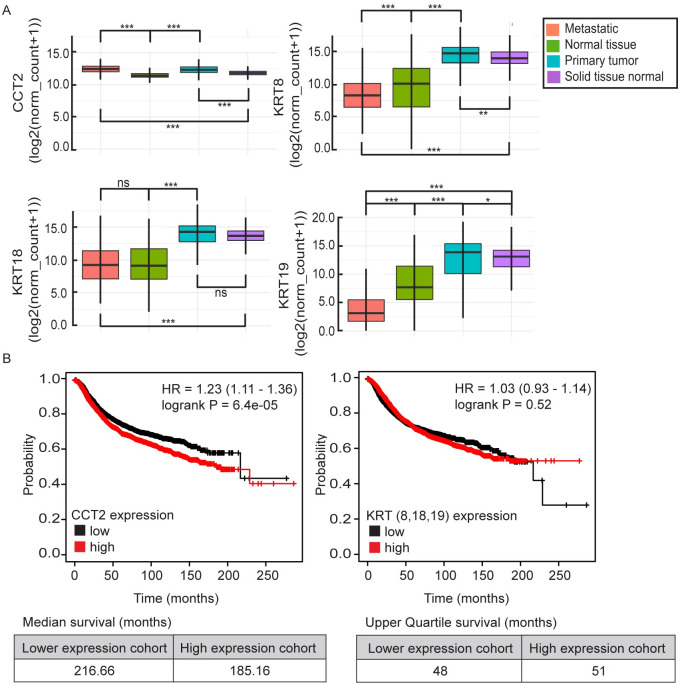
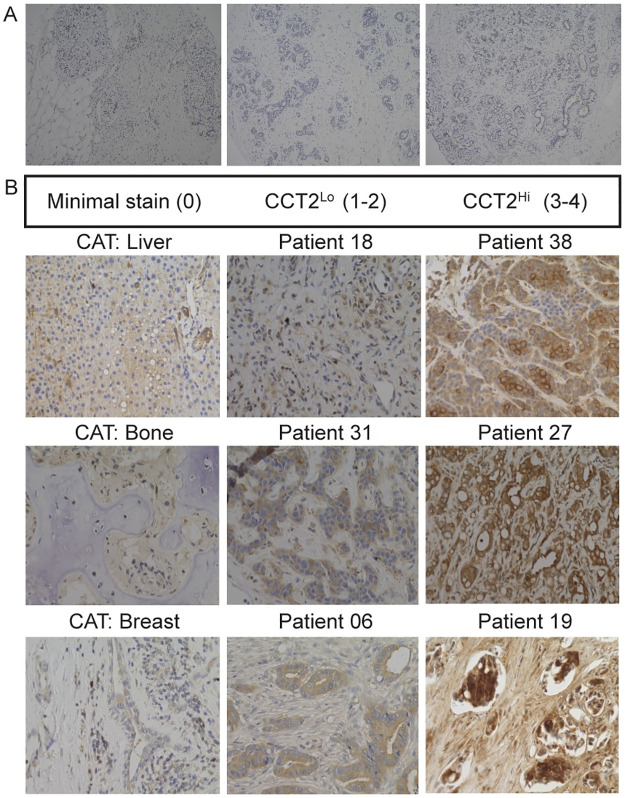
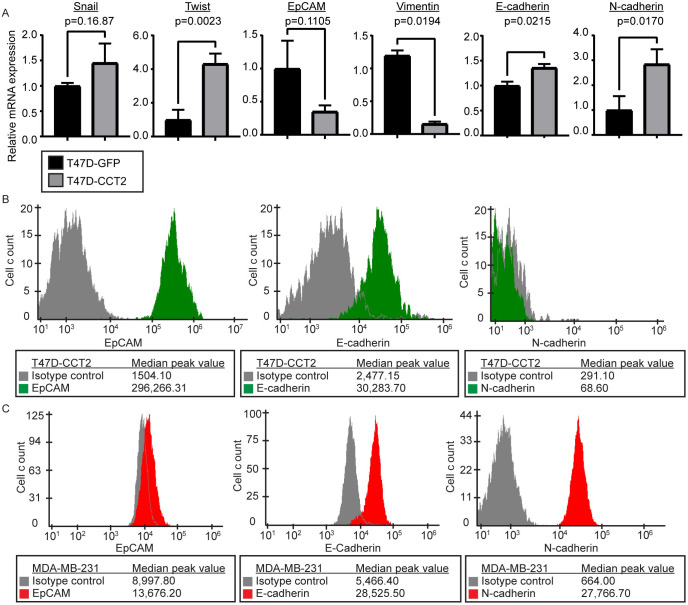
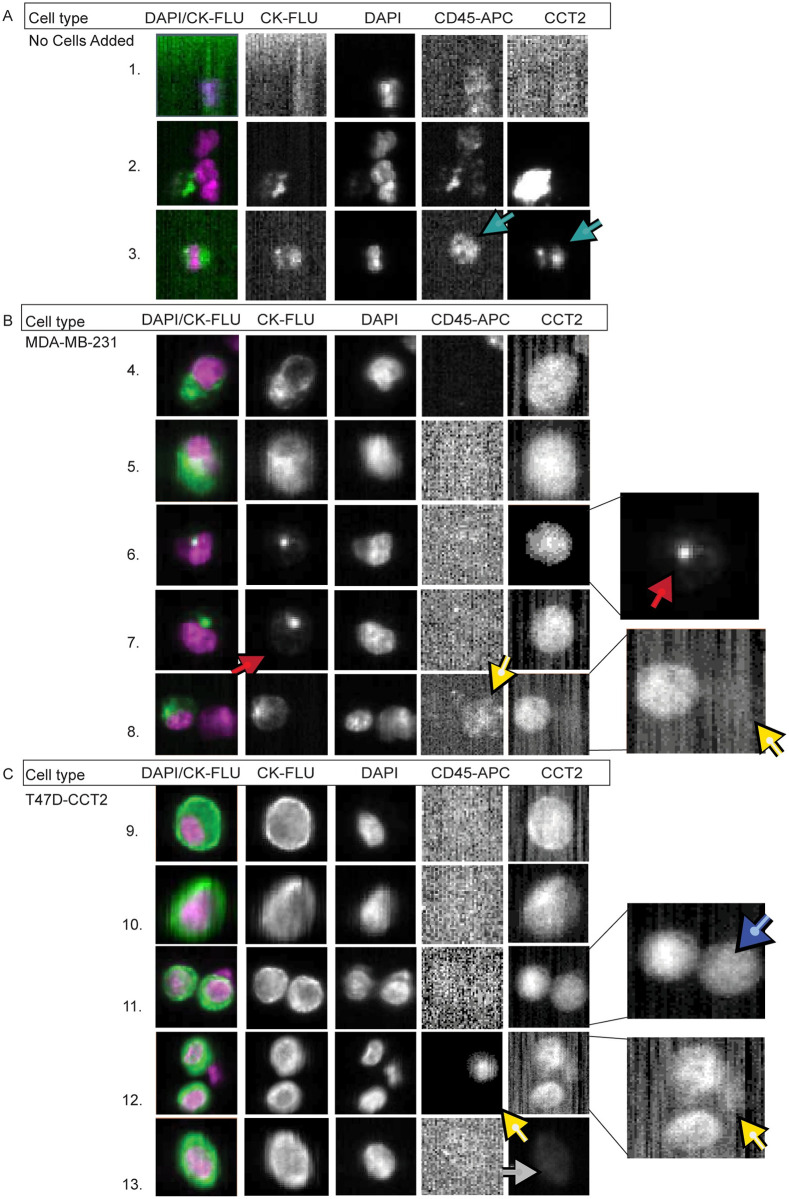
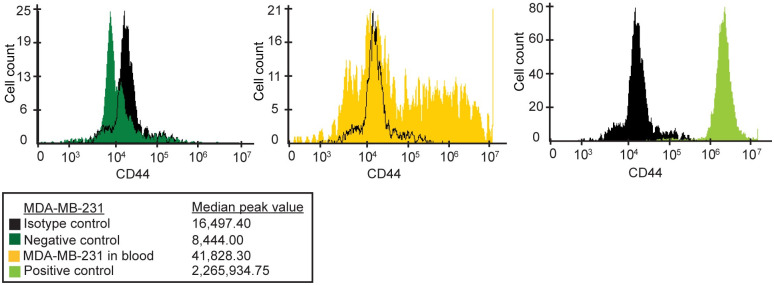
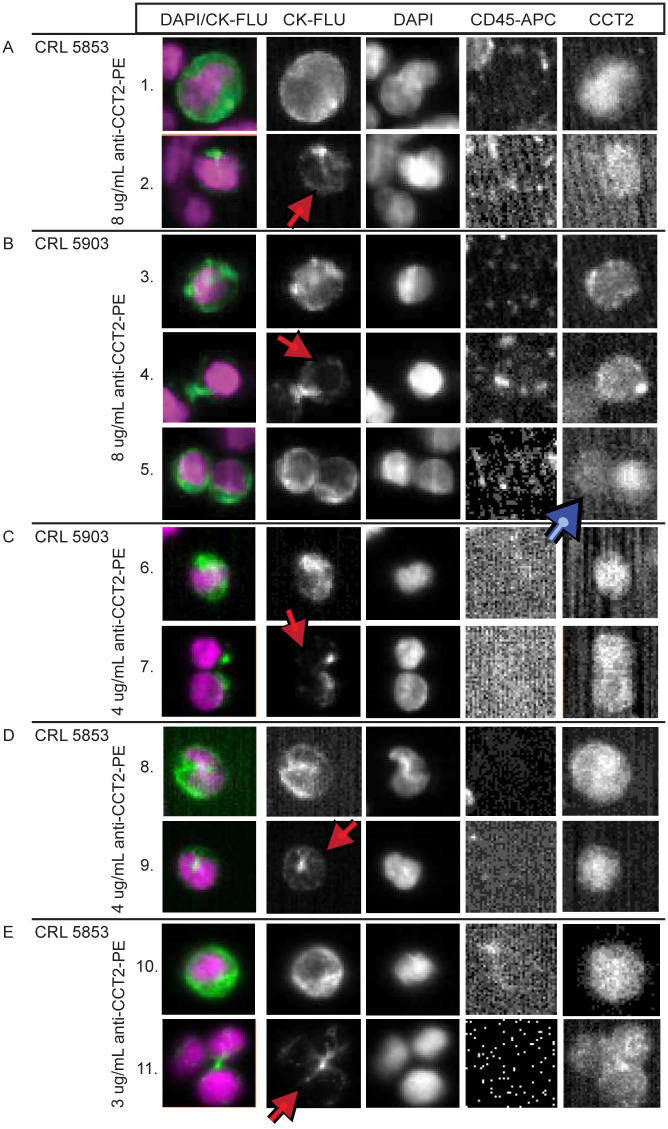
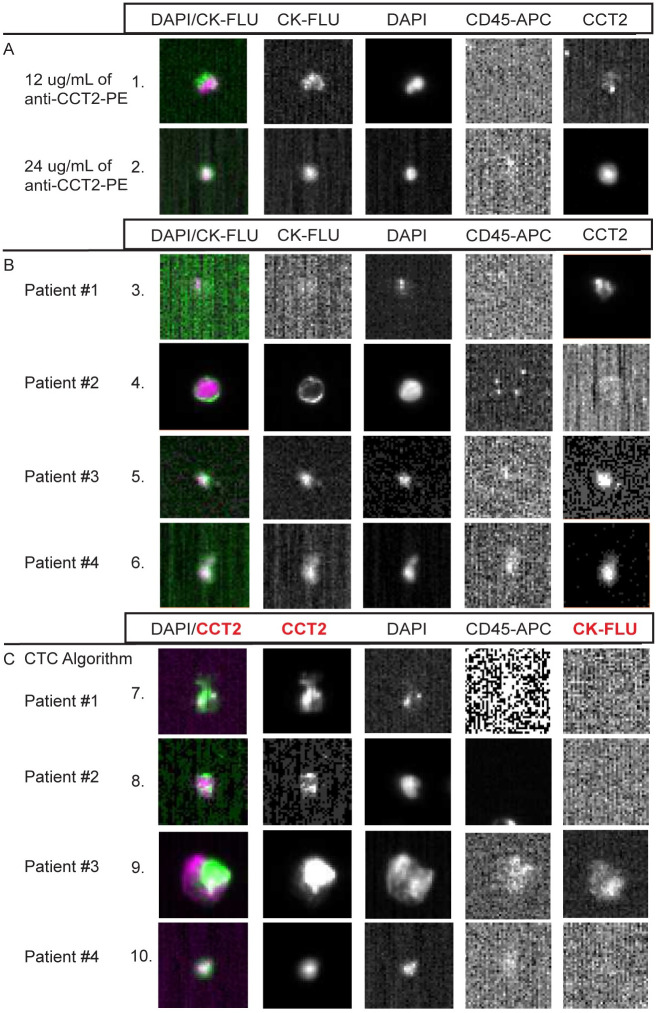
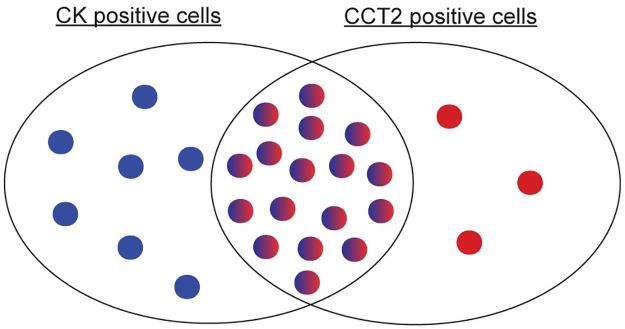
Herein we report the use of Chaperonin-Containing TCP-1 (CCT or TRiC) as a marker to detect circulating tumor cells (CTCs) that are shed from tumors during oncogenesis. Most detection methods used in liquid biopsy approaches for enumeration of CTCs from blood, employ epithelial markers like cytokeratin (CK). However, such markers provide little information on the potential of these shed tumor cells, which are normally short-lived, to seed metastatic sites. To identify a marker that could go beyond enumeration and provide actionable data on CTCs, we evaluated CCT. CCT is a protein-folding complex composed of eight subunits. Previously, we found that expression of the second subunit (CCT2 or CCTβ) inversely correlated with cancer patient survival and was essential for tumorigenesis in mice, driving tumor-promoting processes like proliferation and anchorage-independent growth. In this study, we examined CCT2 expression in cancer compared to normal tissues and found statistically significant increases in tumors. Because not all blood samples from cancer patients contain detectable CTCs, we used the approach of spiking a known number of cancer cells into blood from healthy donors to test a liquid biopsy approach using CCT2 to distinguish rare cancer cells from the large number of non-cancer cells in blood. Using a clinically validated method for capturing CTCs, we evaluated detection of intracellular CCT2 staining for visualization of breast cancer and small cell lung (SCLC) cancer cells. We demonstrated that CCT2 staining could be incorporated into a CTC capture and staining protocol, providing biologically relevant information to improve detection of cancer cells shed in blood. These results were confirmed with a pilot study of blood from SCLC patients. Our studies demonstrate that detection of CCT2 could identify rare cancer cells in blood and has application in liquid biopsy approaches to enhance the use of minimally invasive methods for cancer diagnosis.


Conflict of interest statement

We have read the journal’s policy and one of the authors of this manuscript (Dr. Annette Khaled) has the following competing interests: [shareholder in Seva Therapeutics, Inc.] This commercial entity holds a license to use intellectual property developed by the inventor (Dr. Khaled) and provided no funding and had no role in the design, preparation, or submission of this manuscript and did not employ any of the authors. This competing interest does not alter our adherence to PLOS ONE policies on sharing data and materials.

Figures

Fig 1
Fig 1. Bioinformatic and histological analysis of CCT2 in cancer patients.
(A) UCSC Xena analysis from “TCGA, TARGET, GTEx” dataset (n = 17,200) comparing mRNA expression of CCT2, KRT8, KRT18, and KRT19 in metastatic tissue (orange), normal tissues/GTEx (green), primary tumor (blue), and solid tissue normal/TCGA (purple). * = p<0.05, ** = p<0.005, *** = p<0.0001. (B) KMplotter analysis of overall survival (OS) with low vs. high CCT2 mRNA expression and low vs high mRNA expression of the mean of KRT8, KRT18, and KRT19 combined in breast cancer patients; n = 4,929. Hazard ratios (HR) and log-rank p-values, as calculated by kmplot.com software, are listed on the KmPlots.
Fig 2
Fig 2. Histological analysis of CCT2 in normal tissue vs. metastatic breast cancer (MBC) patients.
(A) Representative images from tissue microarray of normal breast tissue stained for CCT2. (B) Representative images from a cohort of MBC patient tissues (breast and metastatic sites; S4 Table) stained for CCT2. The images are—Left column: cancer adjacent tissue (CAT) from locations indicated in the figure, which had minimal staining. Middle column: CCT2lo tissue, which was classified as a score of 1 or 2. Right column: CCT2hi tissue, which was classified as a score of 3 or 4.
Fig 3
Fig 3. EpCAM, vimentin, E-cadherin, and N-cadherin expression in MDA-MB-231 and T47D cells.
(A) RT-PCR data comparing lentiviral control (T47D-GFP) (black) with T47D-CCT2 (grey) for expression of EMT genetic markers: SNAIL and TWIST, epithelial markers: EpCAM and E-cadherin, and mesenchymal markers: vimentin and N-cadherin. p-values are shown on the graph. (B) Flow cytometry data detecting surface expression of EpCAM, E-cadherin, and N-cadherin protein in T47D-CCT2 cells (green) compared to isotype controls (grey). (C) Flow cytometry data detecting surface expression of EpCAM, E-cadherin, and N-cadherin proteins in MDA-MB-231 cells (red) compared to isotype controls (grey). All experiments were performed in duplicate.
Fig 4
Fig 4. Breast cancer cells spiked in blood can be detected based on CCT2 staining using the CSS.
Representative images of (A) whole healthy human blood without spiked cancer cells processed through the CSS and stained for CCT2, and (B-C) Representative images of MDA-MB-231 (B) or T47D-CCT2 (C) cells spiked into human blood, processed through the CSS, and stained for CCT2. Light blue arrows: leukocyte that is CCT2 positive. Red arrows: cells with dim CK signal and CCT2 positive signal. Yellow arrows: leukocytes that have dim CCT2 signal. Dark blue arrow: doublet of spiked cancer cells with different CCT2 staining intensities. Grey arrows: cells with dim CCT2 signal. CK-FLU. This data is representative of ten experiments.
Fig 5
Fig 5. Recovered breast cancer cells that have dim CK and are CCT2 positive, also express CD44.
MDA-MB-231 cells recovered from the spike in blood were stained and measured for CD44 levels in gated CCT2 positive cells. Alexa-405 served as the isotype control (black). The left panel shows the negative control which was healthy blood cells only stained for CD44 (dark green). The middle panel shows the CCT2 positive spiked cancer cells stained for CD44 (yellow). The right panel shows the positive control which was MDA-MB-231 cells (not spiked in blood) stained for CD44 (light green).
Fig 6
Fig 6. CCT2 staining in lung cancer cell lines.
(A-B) Representative images from CSS Analyzer II show SCLC cells spiked into healthy human blood and processed with the CSS Autoprep using the anti-CCT2-PE antibody. (A) CRL 5853 and (B) CRL 5903. Red arrows: cells that have dim CK and are CCT2 positive. Blue arrows: doublet of spiked cancer cells with different CCT2 staining intensities. The experiment was performed in duplicate. (C-E) Representative images of lung cancer cells (C) CRL 5903 and (D-E) CRL 5853, stained with reduced anti-CCT2 antibody as indicated in Methods. Red arrows: cells with dim CK staining and CCT2 positive staining. CK-FLU.
Fig 7
Fig 7. Representative images from SCLC patient CTCs stained for CCT2.
(A) Representative images of CTCs, based on standard CTC criteria that were CCT2 positive at varying concentrations of the anti-CCT2-PE antibody. (B) Representative images of CTCs from each SCLC patient. Each image was taken from collections of relevant events that were analyzed using standard CTC criteria for the CSS CXC kits as described above. (C) Representative images from CTCs collected using the CTC analysis algorithm (instead of CXC analysis algorithm) where the DAPI signal overlaps with CCT2-PE instead of CK-FLU as in (A, B). Note that images that contain faint CD45 expression are a result of bleed-over from the signal in the PE channel.
Fig 8
Fig 8. Venn diagram showing possible CTC subsets that are CK+/CCT2-, CK+/CCT2+, and CK-/CCT2+.

References

    1. Jego G, Hazoumé A, Seigneuric R, Garrido C. Targeting heat shock proteins in cancer. Cancer letters. 2013;332(2):275–85. doi: 10.1016/j.canlet.2010.10.014 - DOI - PubMed
    1. Solimini NL, Luo J, Elledge SJ. Non-oncogene addiction and the stress phenotype of cancer cells. Cell. 2007;130(6):986–8. Epub 2007/09/25. doi: 10.1016/j.cell.2007.09.007 . - DOI - PubMed
    1. Khalil AA, Kabapy NF, Deraz SF, Smith C. Heat shock proteins in oncology: diagnostic biomarkers or therapeutic targets? Biochimica et Biophysica Acta (BBA)-Reviews on Cancer. 2011;1816(2):89–104. doi: 10.1016/j.bbcan.2011.05.001 - DOI - PubMed
    1. Roh S-H, Kasembeli M, Bakthavatsalam D, Chiu W, Tweardy D. Contribution of the Type II Chaperonin, TRiC/CCT, to Oncogenesis. International Journal of Molecular Sciences. 2015;16(11):26706–20. doi: 10.3390/ijms161125975 - DOI - PMC - PubMed
    1. Leitner A, Joachimiak LA, Bracher A, Mönkemeyer L, Walzthoeni T, Chen B, et al.. The molecular architecture of the eukaryotic chaperonin TRiC/CCT. Structure. 2012;20(5):814–25. Epub 2012/04/17. doi: 10.1016/j.str.2012.03.007 . - DOI - PMC - PubMed

Publication types