. 2022 Aug 16;82(16):2904-2917.
doi: 10.1158/0008-5472.CAN-21-4141.

Cancer-Associated Fibroblasts Suppress CD8+ T-cell Infiltration and Confer Resistance to Immune-Checkpoint Blockade

Affiliations

Cancer-Associated Fibroblasts Suppress CD8+ T-cell Infiltration and Confer Resistance to Immune-Checkpoint Blockade

Liam Jenkins et al. Cancer Res. .

Abstract

Immune-checkpoint blockade (ICB) promotes antitumor immune responses and can result in durable patient benefit. However, response rates in breast cancer patients remain modest, stimulating efforts to discover novel treatment options. Cancer-associated fibroblasts (CAF) represent a major component of the breast tumor microenvironment and have known immunosuppressive functions in addition to their well-established roles in directly promoting tumor growth and metastasis. Here we utilized paired syngeneic mouse mammary carcinoma models to show that CAF abundance is associated with insensitivity to combination αCTLA4 and αPD-L1 ICB. CAF-rich tumors exhibited an immunologically cold tumor microenvironment, with transcriptomic, flow cytometric, and quantitative histopathologic analyses demonstrating a relationship between CAF density and a CD8+ T-cell-excluded tumor phenotype. The CAF receptor Endo180 (Mrc2) is predominantly expressed on myofibroblastic CAFs, and its genetic deletion depleted a subset of αSMA-expressing CAFs and impaired tumor progression in vivo. The addition of wild-type, but not Endo180-deficient, CAFs in coimplantation studies restricted CD8+ T-cell intratumoral infiltration, and tumors in Endo180 knockout mice exhibited increased CD8+ T-cell infiltration and enhanced sensitivity to ICB compared with tumors in wild-type mice. Clinically, in a trial of melanoma patients, high MRC2 mRNA levels in tumors were associated with a poor response to αPD-1 therapy, highlighting the potential benefits of therapeutically targeting a specific CAF subpopulation in breast and other CAF-rich cancers to improve clinical responses to immunotherapy.

Significance: Paired syngeneic models help unravel the interplay between CAF and tumor immune evasion, highlighting the benefits of targeting fibroblast subpopulations to improve clinical responses to immunotherapy.


Figures

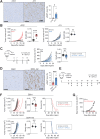
Figure 1. CAF abundance is associated with insensitivity to ICB. A, 4T07 or 4T1 cells were implanted orthotopically into BALB/c mice (n = 5 per group). Mice were culled on day 17. Representative αSMA stained sections (scale bar, 100 μm). Bar chart shows % αSMA+-stained area. B, 4T07 or 4T1 cells were implanted orthotopically into BALB/c or NSG mice (n = 6 per group). Tumor growth curves for individual mice and tumor growth rates. C, 4T1 cells were implanted orthotopically into BALB/c mice (n = 4–9 per group) and treated with αCTLA4 or αPD-L1 antibodies alone (see Supplementary Fig. S1C), or in combination, according to the schedule shown. Control mice received isotype control antibodies. Tumor growth curves for individual mice and tumor growth rates. D, D2A1 or D2A1-m2 cells were implanted orthotopically into BALB/c mice (n = 6 per group), and intratumoral αSMA staining was quantified as in A. E and F, D2A1 or D2A1-m2 cells were implanted orthotopically into BALB/c mice and treated with αCTLA4 and αPD-L1 antibodies in combination according to the schedule shown (n = 8 control and 12 ICB-treated mice per group). Tumor growth curves for individual mice (CR, complete responder), tumor growth rates, and Kaplan–Meier survival analysis (log-rank test). G, D2A1 cells were implanted bilaterally into naïve BALB/c mice (n = 2 mice) or into the opposite mammary fat pad of the surviving mouse from the D2A1 arm of F (rechallenged, n = 1 mouse).
Figure 1.
CAF abundance is associated with insensitivity to ICB. A, 4T07 or 4T1 cells were implanted orthotopically into BALB/c mice (n = 5 per group). Mice were culled on day 17. Representative αSMA stained sections. Scale bar, 100 μm. Bar chart shows percentage of αSMA+-stained area. B, 4T07 or 4T1 cells were implanted orthotopically into BALB/c or NSG mice (n = 6 per group). Tumor growth curves for individual mice and tumor growth rates. C, 4T1 cells were implanted orthotopically into BALB/c mice (n = 4–9 per group) and treated with αCTLA4 or αPD-L1 antibodies alone (see Supplementary Fig. S1C), or in combination, according to the schedule shown. Control mice received isotype control antibodies. Tumor growth curves for individual mice and tumor growth rates. D, D2A1 or D2A1-m2 cells were implanted orthotopically into BALB/c mice (n = 6 per group), and intratumoral αSMA staining was quantified as in A. E and F, D2A1 or D2A1-m2 cells were implanted orthotopically into BALB/c mice and treated with αCTLA4 and αPD-L1 antibodies in combination according to the schedule shown (n = 8 control and 12 ICB-treated mice per group). Tumor growth curves for individual mice (CR, complete responder), tumor growth rates, and Kaplan–Meier survival analysis (log-rank test). G, D2A1 cells were implanted bilaterally into naïve BALB/c mice (n = 2 mice) or into the opposite mammary fat pad of the surviving mouse from the D2A1 arm of F (rechallenged, n = 1 mouse). *, P < 0.05; ***, P < 0.001; ns, nonsignificant.
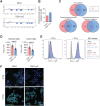
Figure 2. Insensitivity to ICB in vivo is independent of tumor cell–intrinsic factors. D2A1 and D2A1-m2 cell lines and BALB/c mouse germline DNA (as reference) were subjected to whole-exome sequencing. A, Copy-number variation plots (log2 ratio). B, Number of exonic nonsynonymous mutations per megabase (Mb) of exome. C, Venn diagrams illustrating the number of total mutations, nonsynonymous exonic mutations, and nonsynonymous exonic immune mutations in common between the D2A1 and D2A1-m2 cell lines. Immune mutations refer to mutations in the 750 genes represented in the NanoString mouse PanCancer IO 360 panel (see Supplementary Table S2). D, PD-L1 expression in CD45+ immune cells and CD45− tumor cells from dissociated tumors (MFI values). E and F, Cultured cells with or without IFNγ stimulation were (E) stained with APC-conjugated αPD-L1 or isotype control antibody and analyzed via flow cytometry or (F) stained in situ with αPD-L1 antibody followed by Alexa488-conjugated anti-rat Ig and visualized by confocal microscopy (scale bar, 50 μm).
Figure 2.
Insensitivity to ICB in vivo is independent of tumor cell–intrinsic factors. D2A1 and D2A1-m2 cell lines and BALB/c mouse germline DNA (as reference) were subjected to whole-exome sequencing. A, Copy-number variation plots (log2 ratio). B, Number of exonic nonsynonymous mutations per megabase (Mb) of exome. C, Venn diagrams illustrating the number of total mutations, nonsynonymous exonic mutations, and nonsynonymous exonic immune mutations in common between the D2A1 and D2A1-m2 cell lines. Immune mutations refer to mutations in the 750 genes represented in the NanoString mouse PanCancer IO 360 panel (see Supplementary Table S2). D, PD-L1 expression in CD45+ immune cells and CD45 tumor cells from dissociated tumors [maximum fluorescence intensity (MFI) values]. E and F, Cultured cells with or without IFNγ stimulation were stained with APC-conjugated αPD-L1 or isotype control antibody and analyzed via flow cytometry (E) or stained in situ with αPD-L1 antibody, followed by Alexa488-conjugated anti-rat Ig and visualized by confocal microscopy (F). Scale bar, 50 μm. ****, P < 0.0001.
Figure 3. NanoString transcriptomic profiling. D2A1 or D2A1-m2 cells were implanted orthotopically into BALB/c mice (n = 5 or 6 per group). Mice were culled on day 24 (see Supplementary Fig. S2A for tumor weights). A, Profiling of tumors was performed using the NanoString mouse IO 360 panel. Heatmap of significant differentially expressed genes. B, Unsupervised hierarchical clustering based on the expression of NanoString immune cell population abundance signatures (see Supplementary Fig. S2D). C, Significantly differentially expressed NanoString immune cell population abundance signatures. D, CD8 T effector signature expression. E, Treg and macrophage signature expression. F, Expression of fibroblast TGFβ response (F-TBRS) signature (23) and NanoString TGFβ and Wnt signaling signatures (see Supplementary Fig. S2E). G, Correlation between NanoString “CD8 T cells” and F-TBRS (left) or NanoString TGFβ signaling (right) signature expression.
Figure 3.
NanoString transcriptomic profiling. D2A1 or D2A1-m2 cells were implanted orthotopically into BALB/c mice (n = 5 or 6 per group). Mice were culled on day 24 (see Supplementary Fig. S2A for tumor weights). A, Profiling of tumors was performed using the NanoString mouse IO 360 panel. Heatmap of significant differentially expressed genes. B, Unsupervised hierarchical clustering based on the expression of NanoString immune cell population abundance signatures (see Supplementary Fig. S2D). C, Significantly differentially expressed NanoString immune cell population abundance signatures. D, CD8 T effector signature expression. E, Treg and macrophage signature expression. F, Expression of fibroblast TGFβ response (F-TBRS) signature (23) and NanoString TGFβ and Wnt signaling signatures (see Supplementary Fig. S2E). G, Correlation between NanoString “CD8 T cells” and F-TBRS (left) or NanoString TGFβ signaling (right) signature expression. *, P < 0.05; **, P < 0.01; ***, P < 0.001; ****, P < 0.0001; ns, nonsignificant.
Figure 4. CAF-rich tumors exhibit an immunologically cold TME. Tumor cells were implanted orthotopically into BALB/c mice. Mice were culled on day 19 (D2A1/D2A1-m2; n = 7–8 per group for flow cytometry, n = 6 per group for IHC) or day 16 (4T07/4T1; n = 6–8 per group for flow cytometry, n = 5 per group for IHC; see Supplementary Fig. S3A for tumor weights at necropsy). Left, % CD8+ T cells assessed by flow cytometry (see Supplementary Fig. S3B for gating strategy). Right, IHC analysis. CD8+ T cells per mm2 tumor section. Representative images (scale bar, 100 μm). E, Quantification of αSMA staining and CD8+ T-cell number in matched 0.25 mm2 regions from serial sections of D2A1 and D2A1-m2 tumors (n = 3 tumors per group; n = 18–25 regions per section). Right, correlation of all regions sampled. F and G, Left, representative pseudocolor dot plots showing the proportion of granzyme B+ CD8+ cells and PD-1+ CD8+ cells. Right, granzyme B+ or PD-1+ cells as a proportion of CD8+ T cells.
Figure 4.
CAF-rich tumors exhibit an immunologically cold TME. A–D, Tumor cells were implanted orthotopically into BALB/c mice. Mice were culled on day 19 (D2A1/D2A1-m2; n = 7–8 per group for flow cytometry; n = 6 per group for IHC) or day 16 (4T07/4T1; n = 6–8 per group for flow cytometry; n = 5 per group for IHC; see Supplementary Fig. S3A for tumor weights at necropsy). Left, % CD8+ T cells assessed by flow cytometry (see Supplementary Fig. S3B for gating strategy). Right, IHC analysis. CD8+ T cells per mm2 tumor section. Representative images. Scale bar, 100 μm. E, Quantification of αSMA staining and CD8+ T-cell number in matched 0.25 mm2 regions from serial sections of D2A1 and D2A1-m2 tumors (n = 3 tumors per group; n = 18–25 regions per section). Right, correlation of all regions sampled. F and G, Left, representative pseudocolor dot plots showing the proportion of granzyme B+ CD8+ cells and PD-1+ CD8+ cells. Right, granzyme B+ or PD-1+ cells as a proportion of CD8+ T cells. *, P < 0.05; **, P < 0.01; ****, P < 0.0001.
Figure 5. CD8+ T-cell abundance and distribution in CAF-rich and CAF-poor tumors. A, D2A1 cells alone or with GFP+ NMFs or CAFs were implanted orthotopically into BALB/c mice (n = 6–8 mice per group). Tumor growth curves and tumor growth rates. B–D, Primary tumors from A were analyzed via flow cytometry. B, % live GFP+, CD45-/Thy1.2+, and CD8+ T cells. C, Correlation between CD8+ and CD45−/Thy1.2+ cell number in all tumors. D, % Ki67+/CD8+ T cells and PD-1+/CD8+ T cells. E–G, D2A1 or D2A1-m2 cells were implanted orthotopically into BALB/c mice (n = 15–18 per group) and treated with αCTLA4 and αPD-L1 antibodies or isotype controls according to the schedule in Fig. 1E. E, Representative images of peripheral and central regions of tumors from isotype control and ICB-treated mice stained for CD8. Dotted line indicates tumor stroma boundary (scale bar, 250 μm). F, % of centrally located CD8+ T cells (see Supplementary Fig. S5A for the methodology of central and peripheral CD8+ T-cell quantification). G, CD8+ T-cell density in control (C) or ICB-treated tumors.
Figure 5.
CD8+ T-cell abundance and distribution in CAF-rich and CAF-poor tumors. A, D2A1 cells alone or with GFP+ NMFs or CAFs were implanted orthotopically into BALB/c mice (n = 6–8 mice per group). Tumor growth curves and tumor growth rates. B–D, Primary tumors from A were analyzed via flow cytometry. B, Percentage of live GFP+, CD45-/Thy1.2+, and CD8+ T cells. C, Correlation between CD8+ and CD45/Thy1.2+ cell number in all tumors. D, Percentage of Ki67+/CD8+ T cells and PD-1+/CD8+ T cells. E–G, D2A1 or D2A1-m2 cells were implanted orthotopically into BALB/c mice (n = 15–18 per group) and treated with αCTLA4 and αPD-L1 antibodies or isotype controls according to the schedule in Fig. 1E. E, Representative images of peripheral and central regions of tumors from isotype control and ICB-treated mice stained for CD8. Dotted line, tumor stroma boundary. Scale bar, 250 μm. F, Percentage of centrally located CD8+ T cells (see Supplementary Fig. S5A for the methodology of central and peripheral CD8+ T-cell quantification). G, CD8+ T-cell density in control (C) or ICB-treated tumors. *, P < 0.05; **, P < 0.01; ***, P < 0.001; ****, P < 0.0001; ns, nonsignificant.
Figure 6. Functional characterization of Endo180+ CAFs. A, Expression of MRC2 and EPCAM in stromal cells from scRNA-seq of 26 human breast cancers (27). B, D2A1-m2 cells were implanted orthotopically into Endo180 WT or KO BALB/c mice (n = 5 per group). Mice were culled on day 35. Bar chart shows % αSMA+ stained area (mean values per mouse ± SEM, unpaired t test). Representative images (scale bar, 100 μm). C, D2A1 tumor cells were implanted alone or coimplanted with shNTC or shE180 CAFs (n = 8 per group; ref. 16). Mice were culled on day 32. Representative images of CD8 IHC in peripheral and central tumor regions (scale bar, 200 μm). CD8+ T cells per mm2 and % centrally located CD8+ T cells. D, mCherry-tagged D2A1-m2 cells were implanted orthotopically into Endo180 WT or KO BALB/c mice (n = 5 per group; ref. 16). Mice were culled on day 27. Left, tumor growth curves. Remaining panels, flow-cytometric analysis of indicated stromal cell populations.
Figure 6.
Functional characterization of Endo180+ CAFs. A, Expression of MRC2 and EPCAM in stromal cells from scRNA-seq of 26 human breast cancers (27). B, D2A1-m2 cells were implanted orthotopically into Endo180 WT or KO BALB/c mice (n = 5 per group). Mice were culled on day 35. Bar chart shows percentage of αSMA+ stained area (mean values per mouse ± SEM, unpaired t test). Representative images. Scale bar, 100 μm. C, D2A1 tumor cells were implanted alone or coimplanted with shNTC or shE180 CAFs (n = 8 per group; ref. 16). Mice were culled on day 32. Representative images of CD8 IHC in peripheral and central tumor regions. Scale bar, 200 μm. CD8+ T cells per mm2 and percentage of centrally located CD8+ T cells. D, mCherry-tagged D2A1-m2 cells were implanted orthotopically into Endo180 WT or KO BALB/c mice (n = 5 per group; ref. 16). Mice were culled on day 27. Left, tumor growth curves. Remaining panels, flow cytometric analysis of indicated stromal cell populations. *, P < 0.05; **, P < 0.01; ns, nonsignificant.
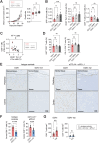
Figure 7. Stromal Endo180 depletion sensitizes tumors to ICB. A, D2A1-m2 cells were implanted orthotopically into Endo180 WT or KO BALB/c mice. Mice were treated with combination αCTLA4/αPD-L1 therapy or isotype control antibodies, according to the Fig. 1E schedule (n = 8 control and 19 ICB-treated mice per group). Left, tumor growth curves for individual mice. Note, two Endo180 KO ICB-treated mice show complete tumor regression (CR). Middle, tumor growth rates. Right, Kaplan–Meier survival analysis (log-rank test). B, D2A1-m2 cells were implanted into the opposite mammary fat pad of the two surviving E180 KO mice from A (rechallenged) or into five naïve BALB/c mice. C, Tumors from ICB-treated mice from A stained for αSMA and CD8. Representative CD8-stained images (scale bar, 100 μm). Right, total number of CD8+ T cells per mm2 and % centrally located CD8+ T cells. D, mRNA abundance profiles (log2 (FPKM + 1)) of selected marker genes in melanomas from anti–PD-1 nonresponders (NR) and responders (R; ref. 26; Wilcox rank-sum test).
Figure 7.
Stromal Endo180 depletion sensitizes tumors to ICB. A, D2A1-m2 cells were implanted orthotopically into Endo180 WT or KO BALB/c mice. Mice were treated with combination αCTLA4/αPD-L1 therapy or isotype control antibodies, according to the Fig. 1E schedule (n = 8 control and 19 ICB-treated mice per group). Left, tumor growth curves for individual mice. Note, two Endo180 KO ICB-treated mice show complete tumor regression (CR). Middle, tumor growth rates. Right, Kaplan–Meier survival analysis (log-rank test). B, D2A1-m2 cells were implanted into the opposite mammary fat pad of the two surviving E180 KO mice from A (rechallenged) or into five naïve BALB/c mice. C, Tumors from ICB-treated mice from A stained for αSMA and CD8. Representative CD8-stained images. Scale bar, 100 μm. Right, total number of CD8+ T cells per mm2 and percentage of centrally located CD8+ T cells. D, mRNA abundance profiles [log2 (FPKM + 1)] of selected marker genes in melanomas from anti–PD-1 nonresponders (NR) and responders (R; Wilcox rank-sum test; ref. 26). *, P < 0.05; **, P < 0.01; ns, nonsignificant.

References

    1. Wei SC, Duffy CR, Allison JP. Fundamental mechanisms of immune-checkpoint blockade therapy. Cancer Discov 2018;8:1069–86. - PubMed
    1. Kalbasi A, Ribas A. Tumour-intrinsic resistance to immune checkpoint blockade. Nat Rev Immunol 2020;20:25–39. - PMC - PubMed
    1. Sharma P, Hu-Lieskovan S, Wargo JA, Primary Ribas A., Adaptive, and acquired resistance to cancer immunotherapy. Cell 2017;168:707–23. - PMC - PubMed
    1. Loi S, Michiels S, Adams S, Loibl S, Budczies J, Denkert C, et al. . The journey of tumor-infiltrating lymphocytes as a biomarker in breast cancer: clinical utility in an era of checkpoint inhibition. Ann Oncol 2021;32:1236–44. - PubMed
    1. Cortes J, Cescon DW, Rugo HS, Nowecki Z, Im SA, Yusof MM, et al. . Pembrolizumab plus chemotherapy versus placebo plus chemotherapy for previously untreated locally recurrent inoperable or metastatic triple-negative breast cancer (KEYNOTE-355): a randomised, placebo-controlled, double-blind, phase 3 clinical trial. Lancet 2020;396:1817–28. - PubMed

Publication types

Substances