. 2022 Aug 15;75(Suppl 1):S110-S120.
doi: 10.1093/cid/ciac399.

Advancing Precision Vaccinology by Molecular and Genomic Surveillance of Severe Acute Respiratory Syndrome Coronavirus 2 in Germany, 2021

Collaborators, Affiliations

Advancing Precision Vaccinology by Molecular and Genomic Surveillance of Severe Acute Respiratory Syndrome Coronavirus 2 in Germany, 2021

Djin Ye Oh et al. Clin Infect Dis. .

Abstract

Background: Comprehensive pathogen genomic surveillance represents a powerful tool to complement and advance precision vaccinology. The emergence of the Alpha variant in December 2020 and the resulting efforts to track the spread of this and other severe acute respiratory syndrome coronavirus 2 (SARS-CoV-2) variants of concern led to an expansion of genomic sequencing activities in Germany.

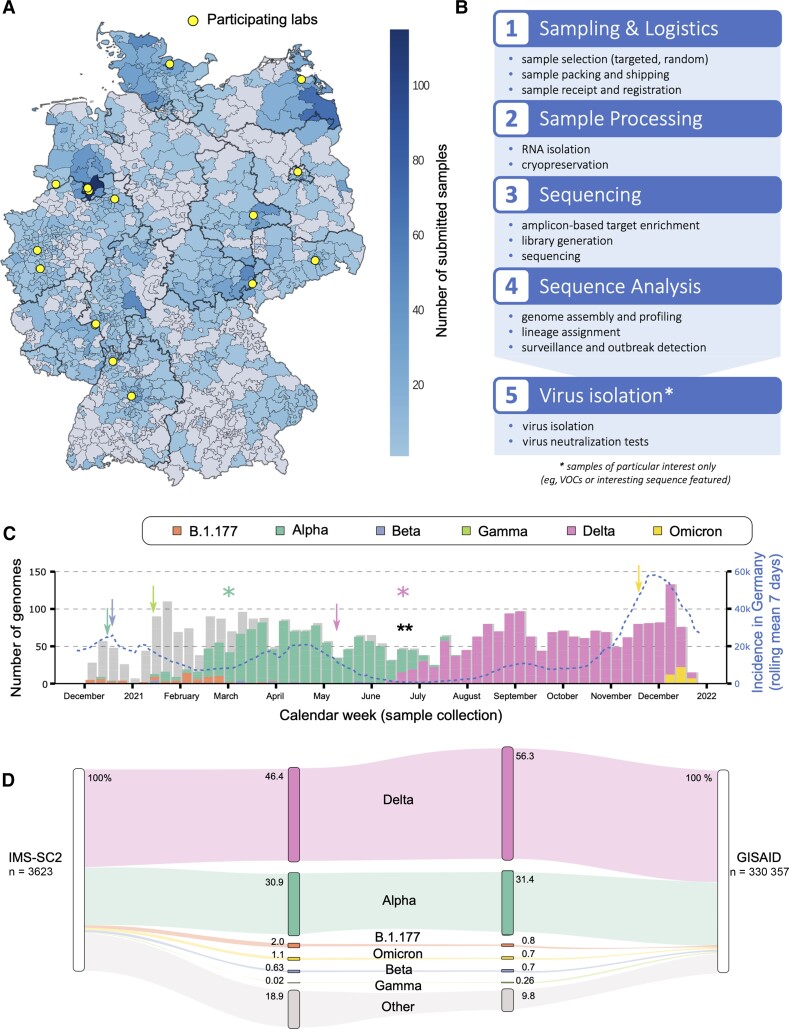
Methods: At Robert Koch Institute (RKI), the German National Institute of Public Health, we established the Integrated Molecular Surveillance for SARS-CoV-2 (IMS-SC2) network to perform SARS-CoV-2 genomic surveillance at the national scale, SARS-CoV-2-positive samples from laboratories distributed across Germany regularly undergo whole-genome sequencing at RKI.

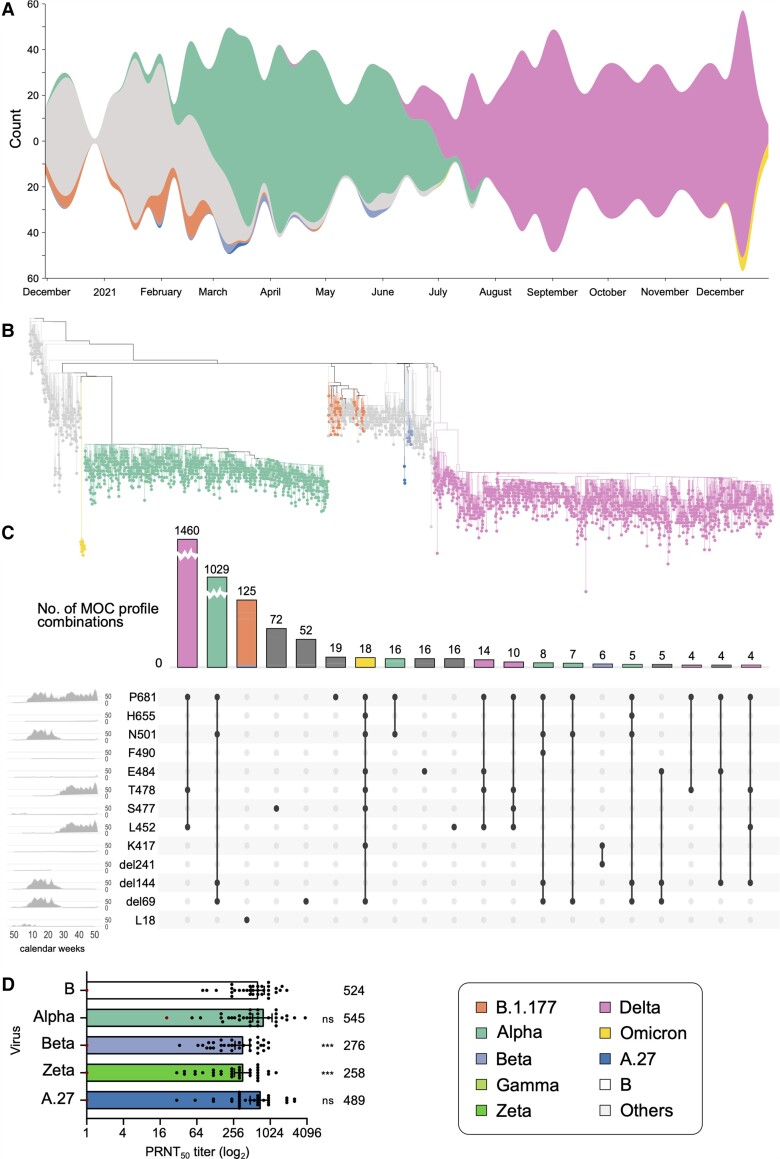
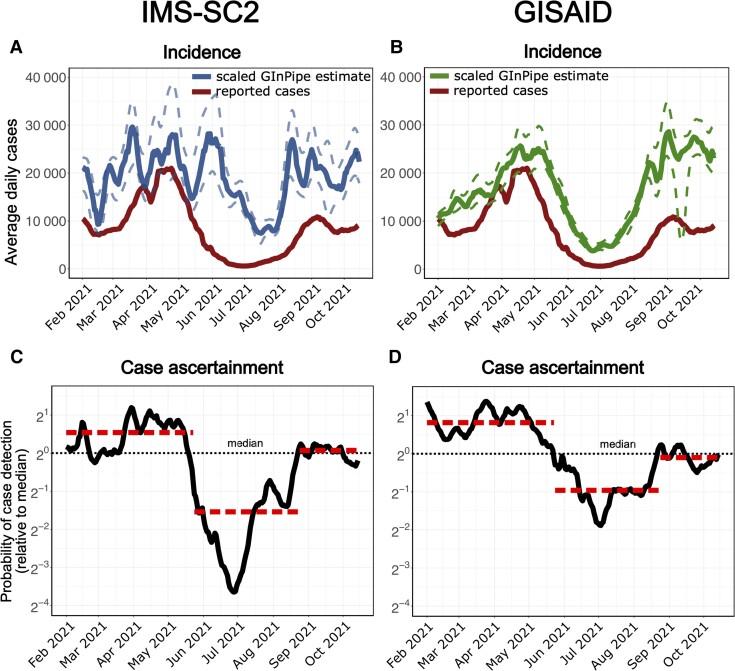
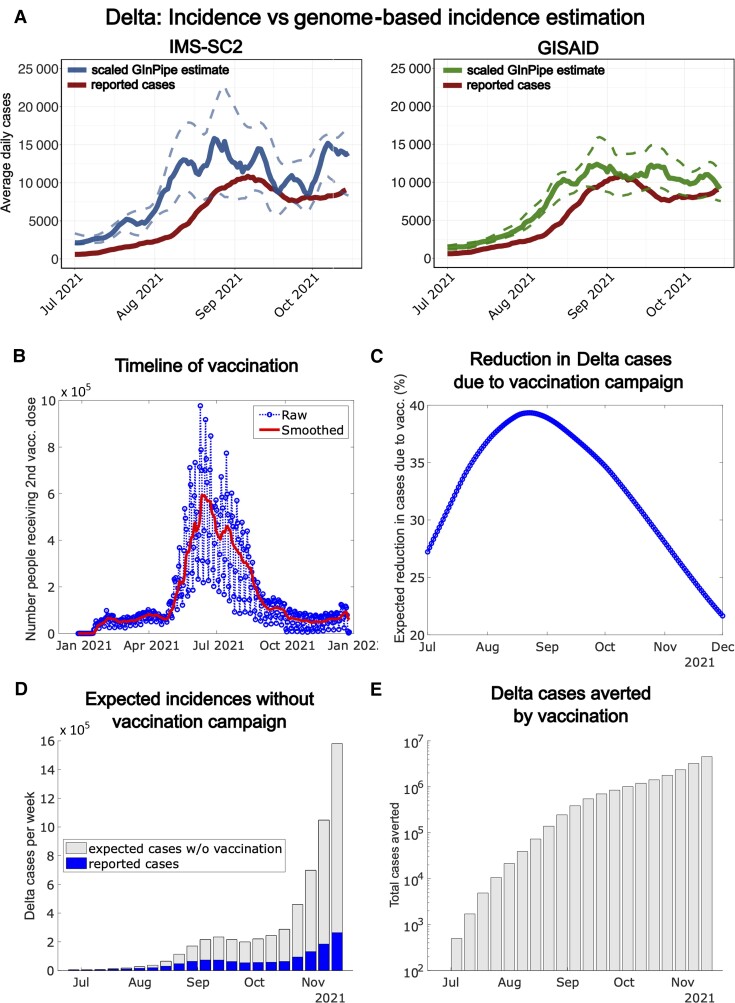
Results: We report analyses of 3623 SARS-CoV-2 genomes collected between December 2020 and December 2021, of which 3282 were randomly sampled. All variants of concern were identified in the sequenced sample set, at ratios equivalent to those in the 100-fold larger German GISAID sequence dataset from the same time period. Phylogenetic analysis confirmed variant assignments. Multiple mutations of concern emerged during the observation period. To model vaccine effectiveness in vitro, we employed authentic-virus neutralization assays, confirming that both the Beta and Zeta variants are capable of immune evasion. The IMS-SC2 sequence dataset facilitated an estimate of the SARS-CoV-2 incidence based on genetic evolution rates. Together with modeled vaccine efficacies, Delta-specific incidence estimation indicated that the German vaccination campaign contributed substantially to a deceleration of the nascent German Delta wave.

Conclusions: SARS-CoV-2 molecular and genomic surveillance may inform public health policies including vaccination strategies and enable a proactive approach to controlling coronavirus disease 2019 spread as the virus evolves.

Keywords: SARS-CoV-2; incidence estimation; molecular surveillance; pathogen genomics; variant of concern.


Conflict of interest statement

Potential conflicts of interest. The authors report no potential conflicts of interest. All authors have submitted the ICMJE Form for Disclosure of Potential Conflicts of Interest. Conflicts that the editors consider relevant to the content of the manuscript have been disclosed.

Figures

Figure 1.
Figure 1.
A, Map visualizing the distribution and amount of submitted samples to the Integrated Molecular Surveillance for SARS-CoV-2 (IMS-SC2) project in Germany based on 3-digit zip codes. The locations of participating laboratories are highlighted in yellow. The map is based on random samples (n = 3282), suspected samples (n = 194), and unknown samples (n = 147) of which 3.42% (n = 124) were excluded due to missing or incorrect geographical data. B, IMS-SC2 workflow. Severe acute respiratory syndrome coronavirus 2 (SARS-CoV-2)–positive samples from multiple locations are transported to the Robert Koch Institute wet laboratory where they undergo processing for whole-genome sequencing. Sequence data are analyzed using standardized pipelines, which are updated at regular intervals to adjust for changing wet-lab protocols as well as sequence variation and evolution. All IMS-SC2 samples are cryopreserved, enabling isolation and further in vitro evaluation (eg, via neutralization assays) of SARS-CoV-2 strains displaying sequence features of interest, for example, amino acid substitutions in the spike gene that may be associated with immune evasion. C, SARS-CoV-2 lineage counts over time as captured by the IMS-SC2 network. Variants of concern (VOCs) shown are Alpha (B.1.1.7), Beta (B.1.351), Gamma (P.1), Delta (B.1.617.2), and Omicron (B.1.1.529). Lineage B.1.177 is also shown as an early variant that emerged in Europe in early summer 2020 [41]. Information on sublineages (such as AY sublineages for Delta) are summarized in their parent lineage. Shadow bars indicate total sequence numbers determined. Blue line displays national SARS-CoV-2 incidences (right y-axis) at the corresponding time points. Arrows denote the time points that each VOC was declared as such by the World Health Organization (Alpha: mint; Beta: blue; Gamma: light green; Delta: pink; Omicron: yellow); a black double-asterisk shows the time point at which the weekly count of Delta genomes increased significantly (Fisher exact test, P <.01); colored asterisks denote the time points when Alpha and Delta were declared predominant variants in Germany, based on sequencing data, registered case counts, and polymerase chain reaction genotyping efforts. Additional information is shown in Supplementary Table 1. D, SARS-CoV-2 lineage and corresponding sublineage proportions as captured by the IMS-SC2, compared to German genome proportions in GISAID in the same time frame. VOCs shown here are Alpha (B.1.1.7), Beta (B.1.351), Gamma (P.1), Delta (B.1.617.2), and Omicron (B.1.1.529), including their corresponding sublineages. Lineage B.1.177 is also shown as an early variant that emerged in Europe in early summer 2020. All remaining SARS-CoV-2 lineages are pooled into “Other.”
Figure 2.
Figure 2.
A, Variant proportions over time, as captured in the representative sampling subset of Integrated Molecular Surveillance for SARS-CoV-2 (IMS-SC2) laboratory network genome sequences. To visualize the dynamics in the virus population over time, virus lineages were determined with pangolin based on the randomly sampled genome sequences (n = 3282, see Materials and Methods). Lineage frequencies were aggregated based on the date of sampling relative to calendar weeks. Missing values have been interpolated. Visualization was performed using RAWGraphs. Please see Supplementary Figure 1 for a detailed visualization including non–variants of concern (VOCs). B, Phylogenetic tree highlighting VOC clades. Sequencing data presented here are based on all randomly selected severe acute respiratory syndrome coronavirus 2 (SARS-CoV-2)–positive specimens from the IMS-SC2 network (n = 3282). Lineage B.1.177 is also shown as an early variant that emerged in Europe in early summer 2020 as well as 3 A.27 samples. Please see Supplementary Figure 2 for the full tree visualization, including the 2 long branch attractions described in the Supplementary Methods. C, Mutation of concern (MOC) proportions and combinations over time, as captured by the randomly sampled IMS-SC2 genomes. MOCs shown here highlight the spike amino acid positions, rather than the specific exchanged amino acid, as the selected positions can have >1 amino acid substitution. We constructed an UpSet diagram to visualize the 20 most common intersecting sets, ie, shared MOCs among the randomly selected IMS-SC2 sequences. For selected MOCs, the diagram shows all intersections (specific mutation profiles) and the number of IMS-SC2 sequences that harbor these profiles. On the leftmost panel, we show the frequencies of specific MOCs over time (x-axis: calendar weeks). For selected mutation profiles, we also show the distribution of SARS-CoV-2 lineages. For additional information on the selected mutations, please see Supplementary Figure 3 and Supplementary Table 3. D, Assessing the susceptibility of SARS-CoV-2 variants to neutralization. Thirty-four sera drawn from individuals vaccinated twice with the BNT162b2 vaccine were assessed for their capacity to neutralize different SARS-CoV-2 isolates in vitro. Bars represent the geometric mean plaque reduction neutralization test (PRNT50) titer and 95% confidence intervals. The red dot–marked patient in (A) is immunosuppressed and not included in the statistical analysis. The geometric mean titer is indicated above each bar. Significance was determined by 2-way analysis of variance. ***P < 0.001; ns, not significant.
Figure 3.
Figure 3.
A and B, Reported severe acute respiratory syndrome coronavirus 2 (SARS-CoV-2) cases in Germany (rolling average, red line) and genome-based incidence estimation using GInPipe [39]. A, The solid and dashed blue lines depict the median trajectory and its 5th to 95th percentile of GInPipe’s incidence estimate using only Integrated Molecular Surveillance for SARS-CoV-2 (IMS-SC2) laboratory network data (3282 sequences, random set). B, The solid and dashed green lines depict the corresponding estimates using all available German sequences deposited in GISAID (226 316 sequences). C and D, Predicted changes in case ascertainment using GInPipe with the IMS-SC2 data (C), as well as all available German sequences deposited in GISAID (D). Case ascertainment is centered on the median case ascertainment probability.
Figure 4.
Figure 4.
A, Reported cases (rolling average) during the onset of the Delta wave in Germany (July–November 2021, solid red line) and genome-based incidence estimation to infer the “true” Delta incidences for the considered time window, using an established in-house bioinformatic method [38] using the Integrated Molecular Surveillance for SARS-CoV-2 (IMS-SC2) sequence set (solid blue line = median estimate; dashed blue lines = 5th and 95th percentile, 1497 sequences) vs the GISAID sequence set (solid green line = median estimate; dashed green lines = 5th and 95th percentile, 132 610 sequences). B, Daily number of individuals receiving the second vaccine shot (blue line) in Germany and smoothed 7-day average (red line). C, Expected reduction of new Delta cases in Germany resulting from the timeline of vaccination and the waning dynamics of vaccine efficacy. D, Reported weekly severe acute respiratory syndrome coronavirus 2 cases during the onset of the Delta wave in Germany (blue bars) and expected additional weekly Delta cases if the German vaccine campaign had not been rolled out (gray bars; computed using the susceptible-infected-recovered [SIR] model outlined in the Supplementary Methods). E, Expected total Delta cases averted by the German vaccination campaign until December 2021 (computed using the SIR model outlined in the Supplementary Methods).

References

    1. Avanzato VA, Matson MJ, Seifert SN, et al. . Case study: prolonged infectious SARS-CoV-2 shedding from an asymptomatic immunocompromised individual with cancer. Cell 2020; 183:1901–1912.e9. - PMC - PubMed
    1. Tarhini H, Recoing A, Bridier-Nahmias A, et al. . Long-term severe acute respiratory syndrome coronavirus 2 (SARS-CoV-2) infectiousness among three immunocompromised patients: from prolonged viral shedding to SARS-CoV-2 superinfection. J Infect Dis 2021; 223:1522–7. - PMC - PubMed
    1. Cele S, Karim F, Lustig G, et al. . SARS-CoV-2 prolonged infection during advanced HIV disease evolves extensive immune escape. Cell Host Microbe 2022; 30:154–62.e5. - PMC - PubMed
    1. Chandler JC, Bevins SN, Ellis JW, et al. . SARS-CoV-2 exposure in wild white-tailed deer (Odocoileus virginianus). Proc Natl Acad Sci U S A 2021; 118:e2114828118. - PMC - PubMed
    1. Griffin BD, Chan M, Tailor N, et al. . SARS-CoV-2 infection and transmission in the North American deer mouse. Nat Commun 2021; 12:3612. - PMC - PubMed

Publication types

Supplementary concepts