. 2022 Jun 23;185(13):2213-2233.e25.
doi: 10.1016/j.cell.2022.05.017.

Cholesterol and matrisome pathways dysregulated in astrocytes and microglia

Affiliations

Cholesterol and matrisome pathways dysregulated in astrocytes and microglia

Julia Tcw et al. Cell. .

Abstract

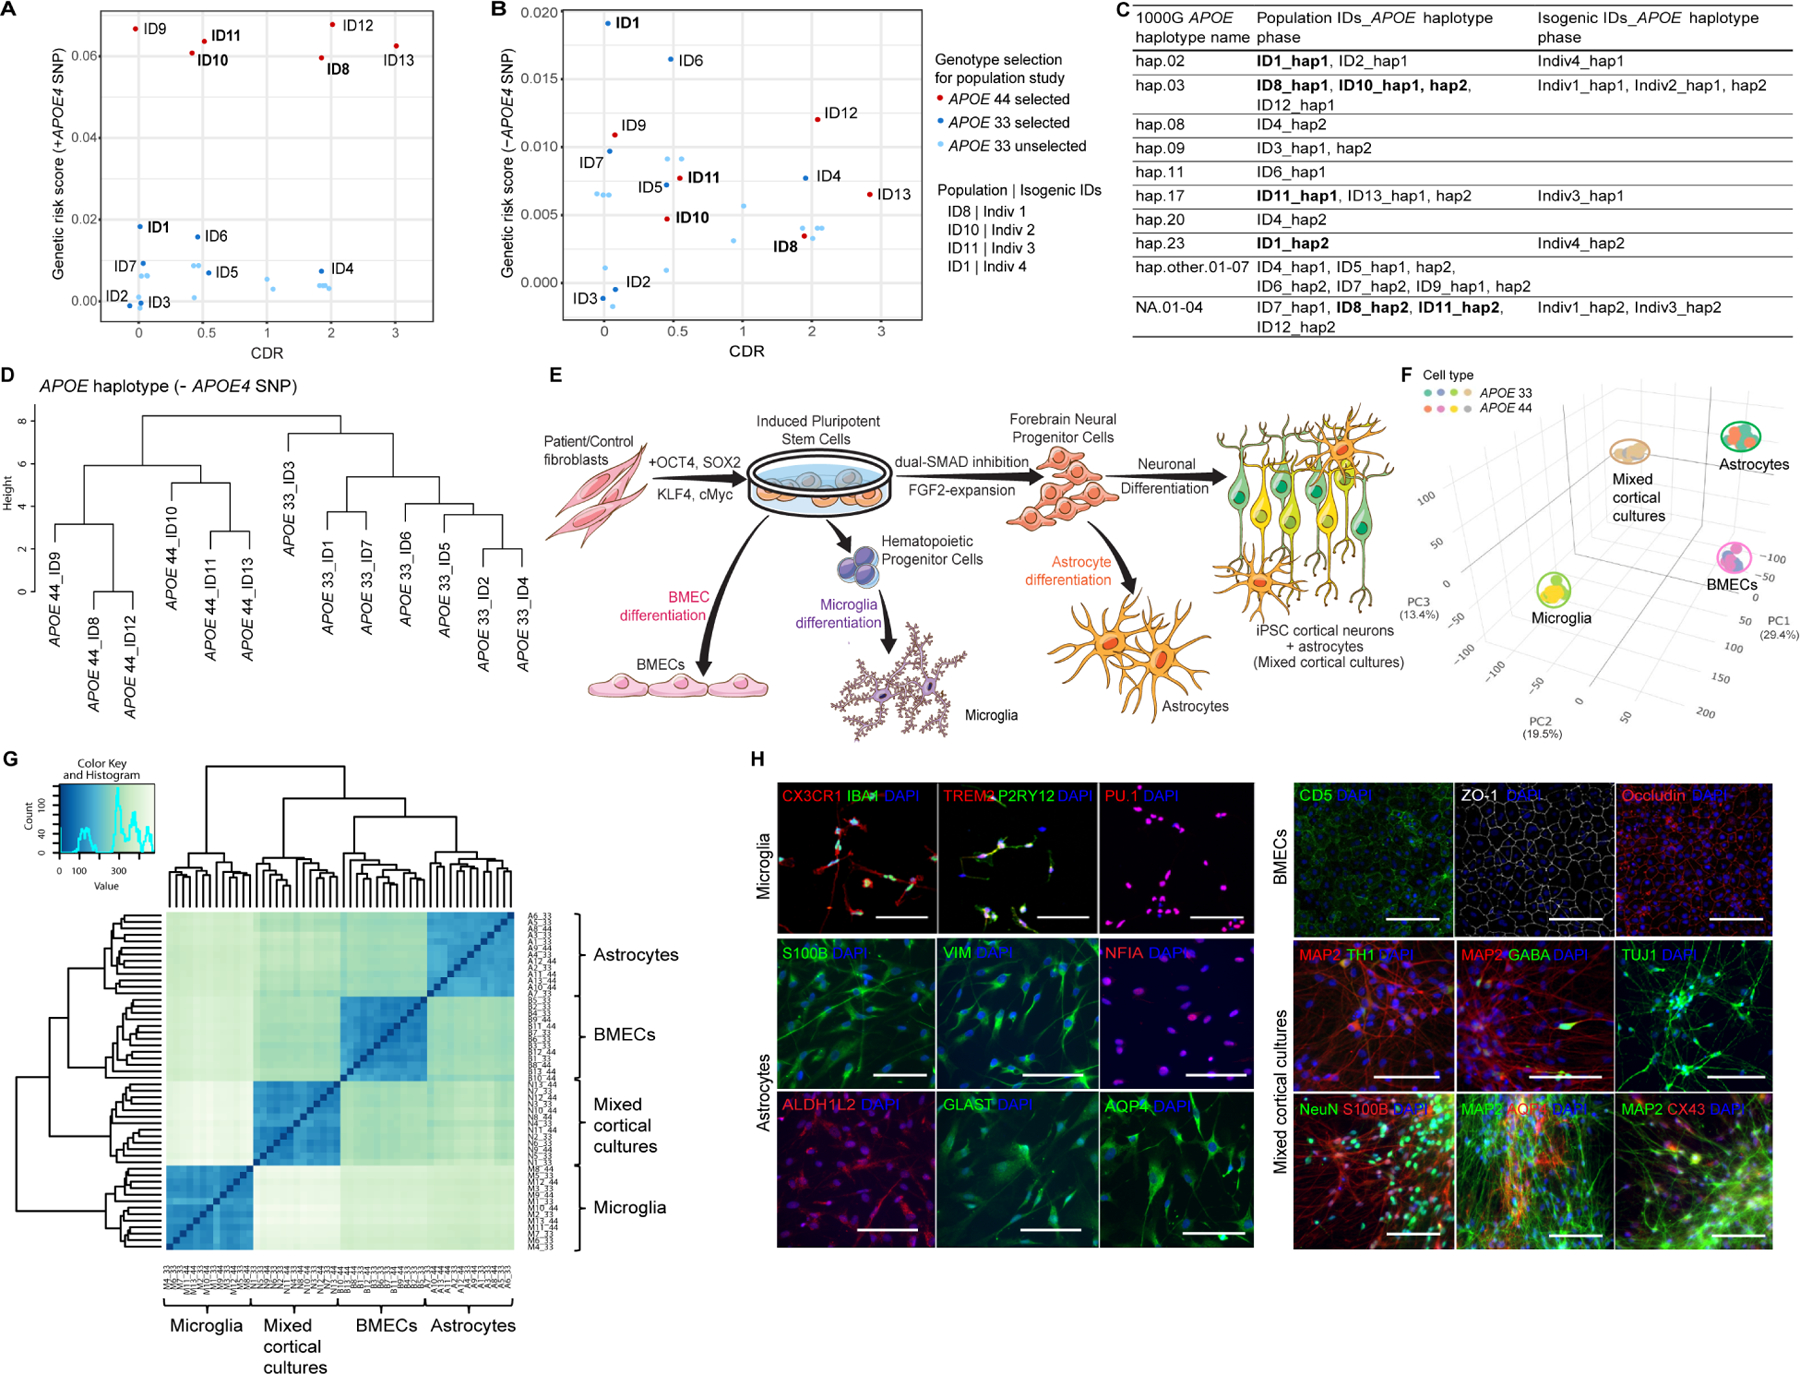
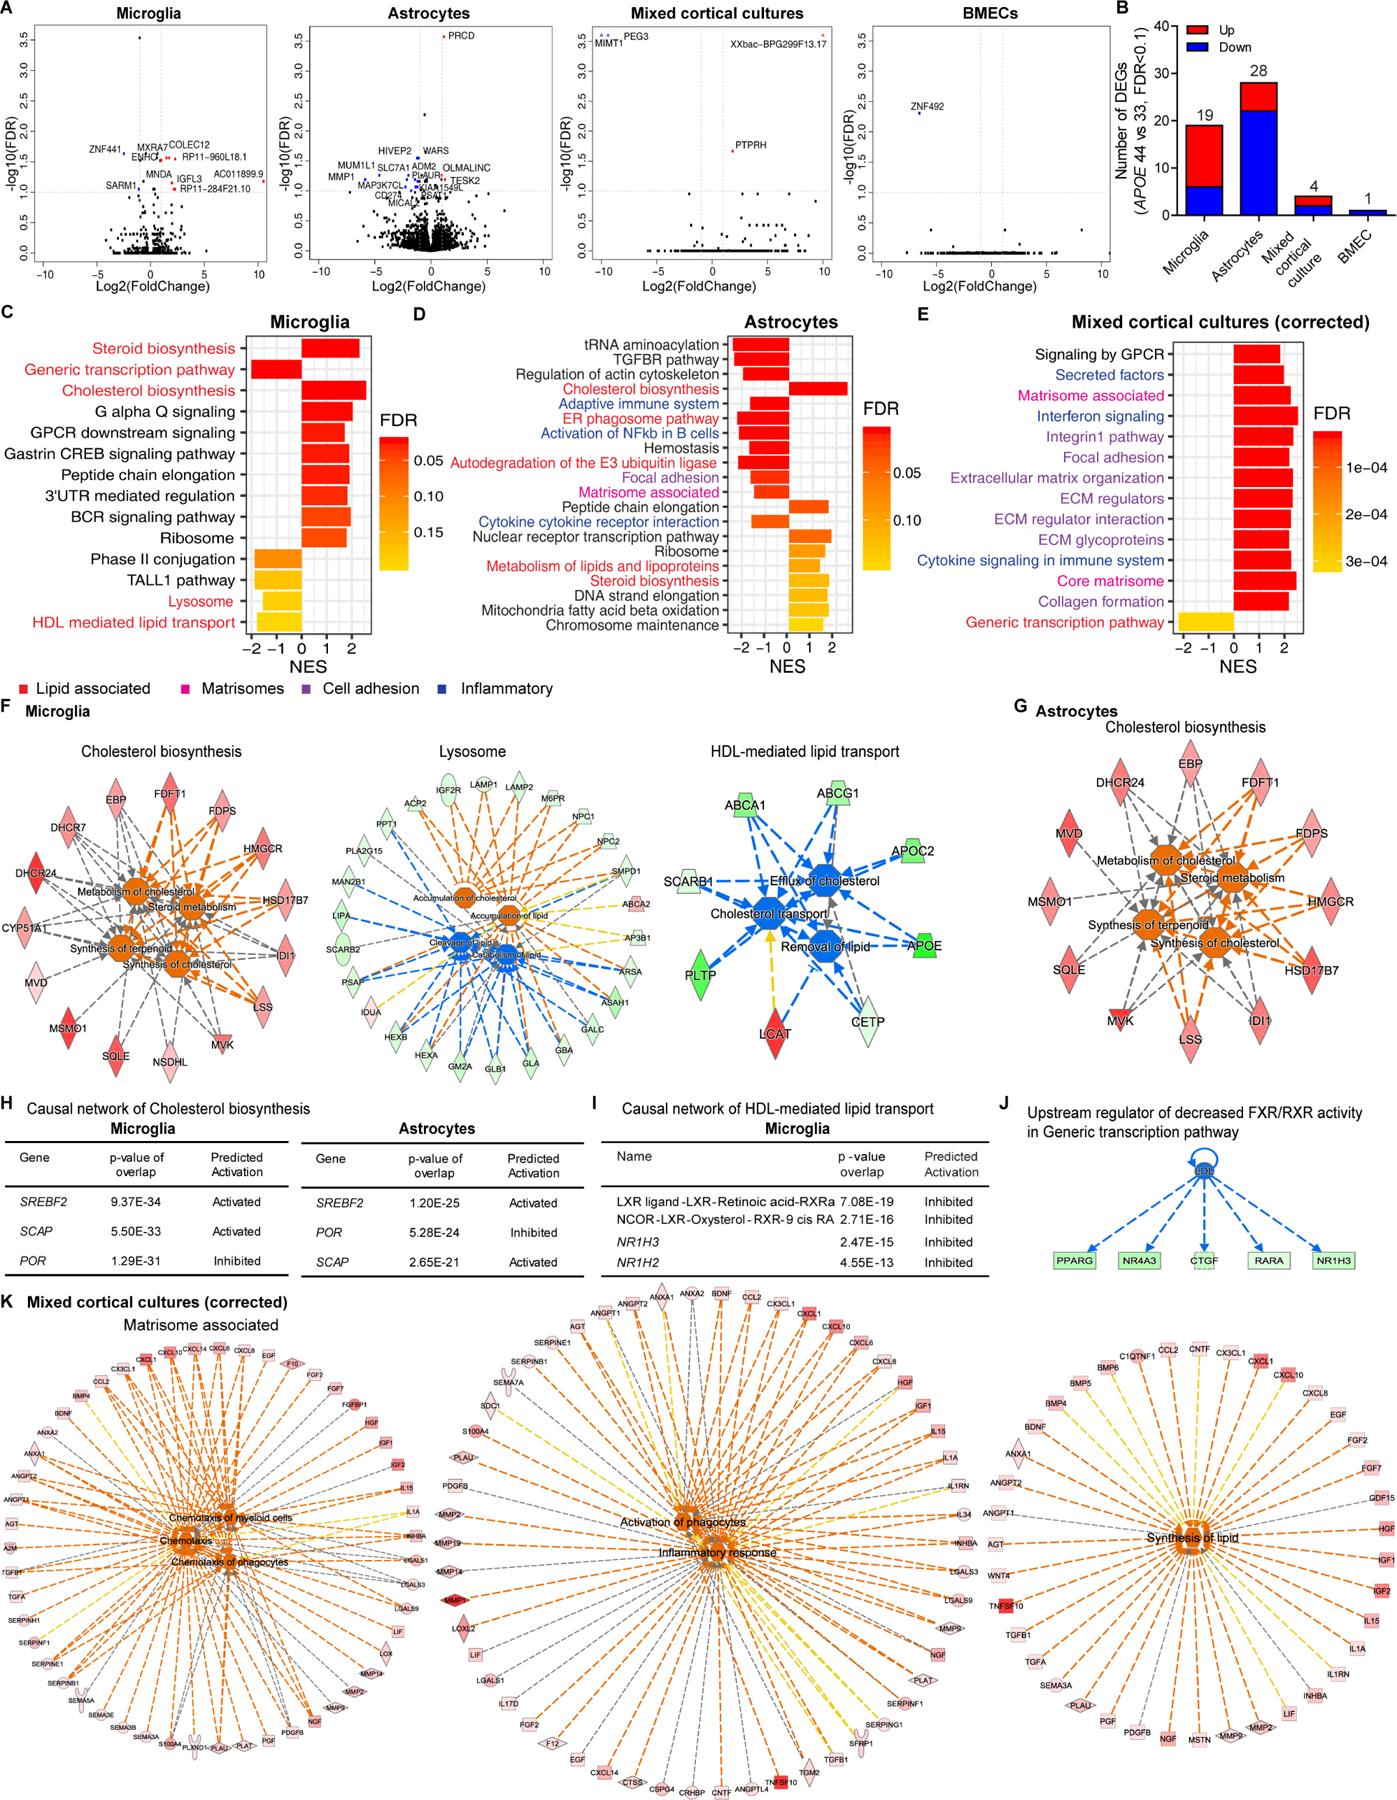
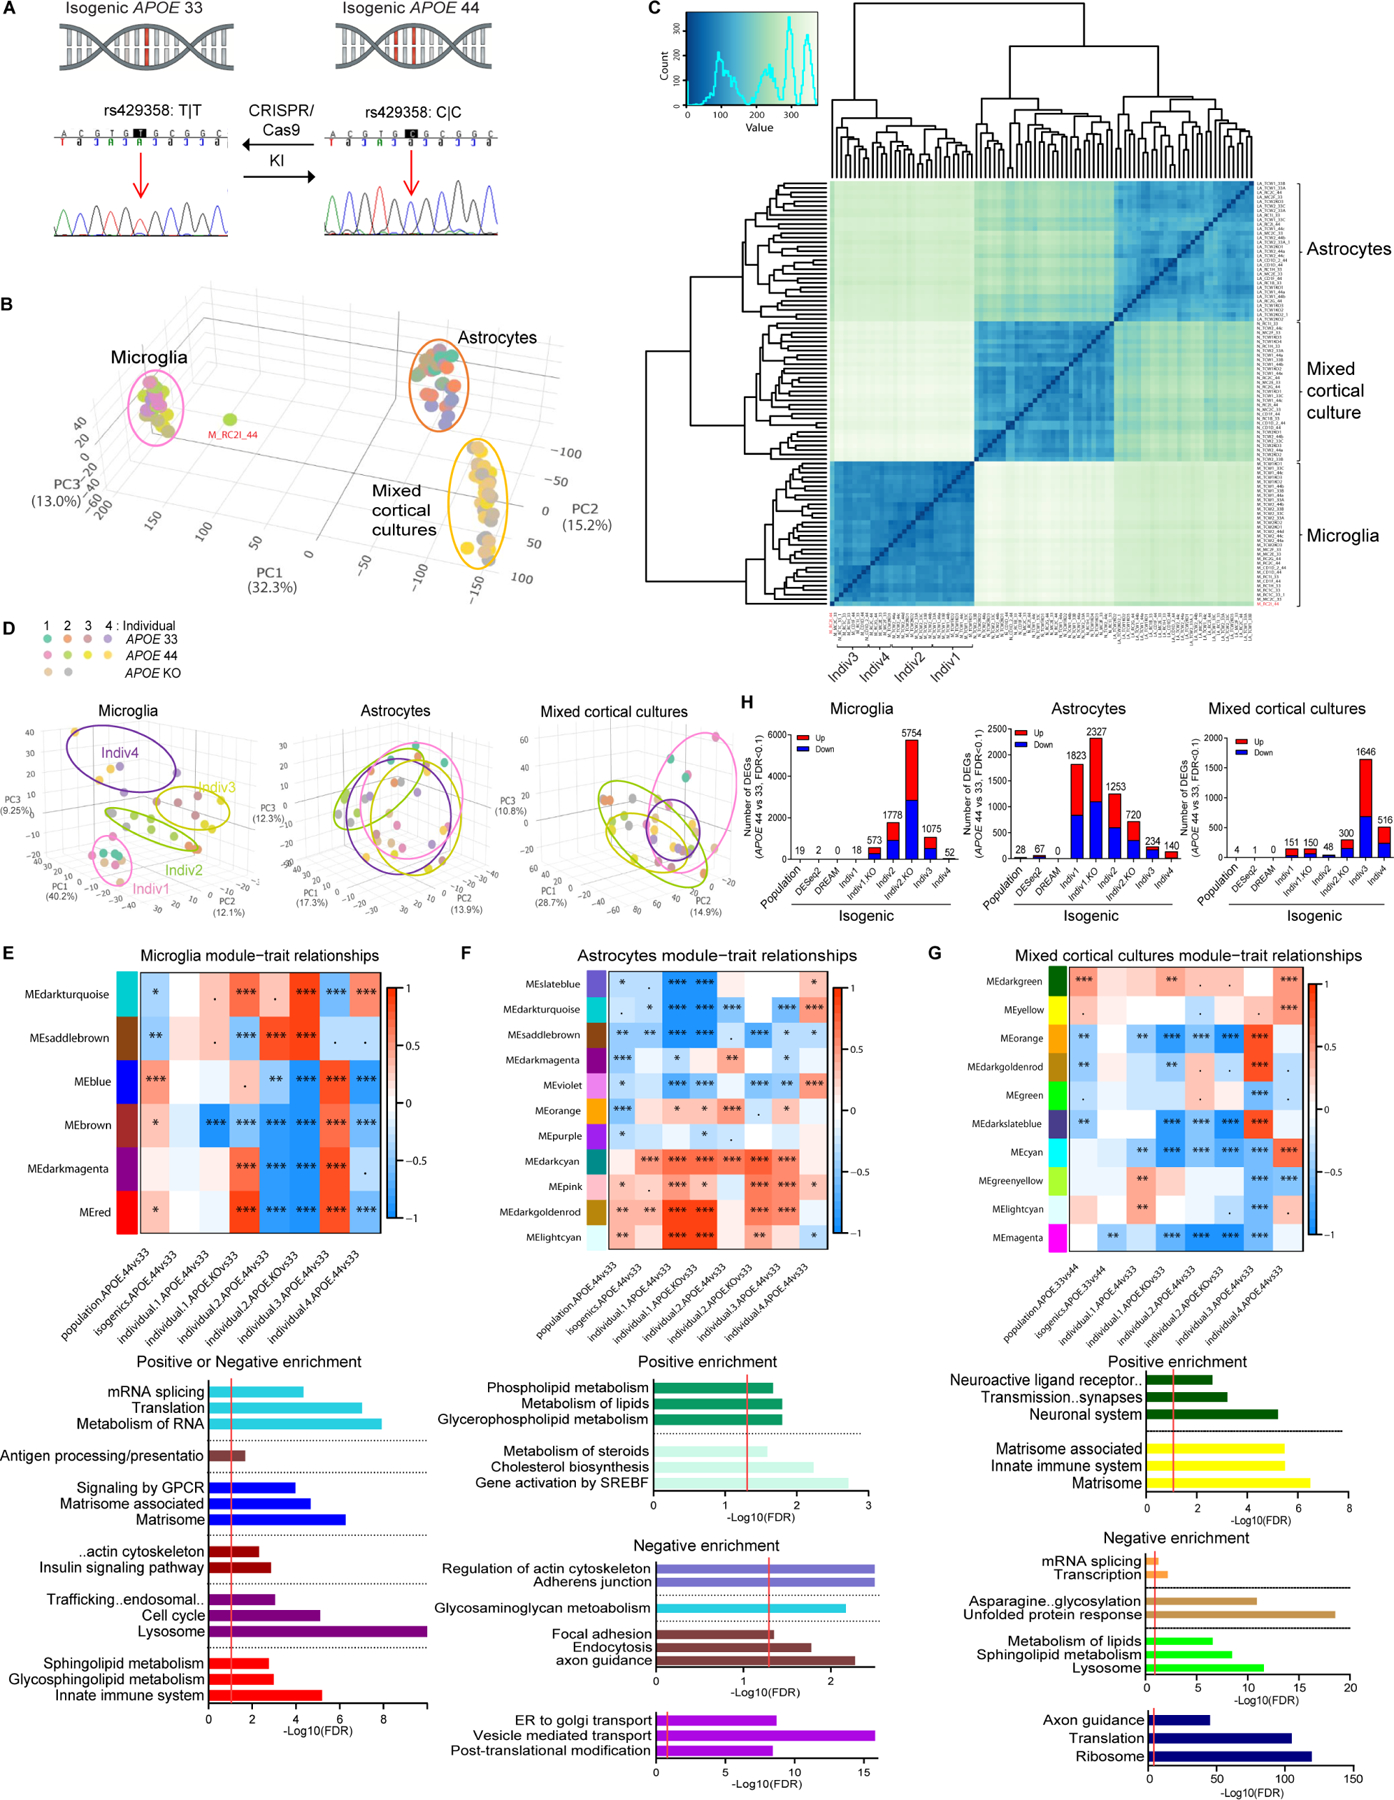
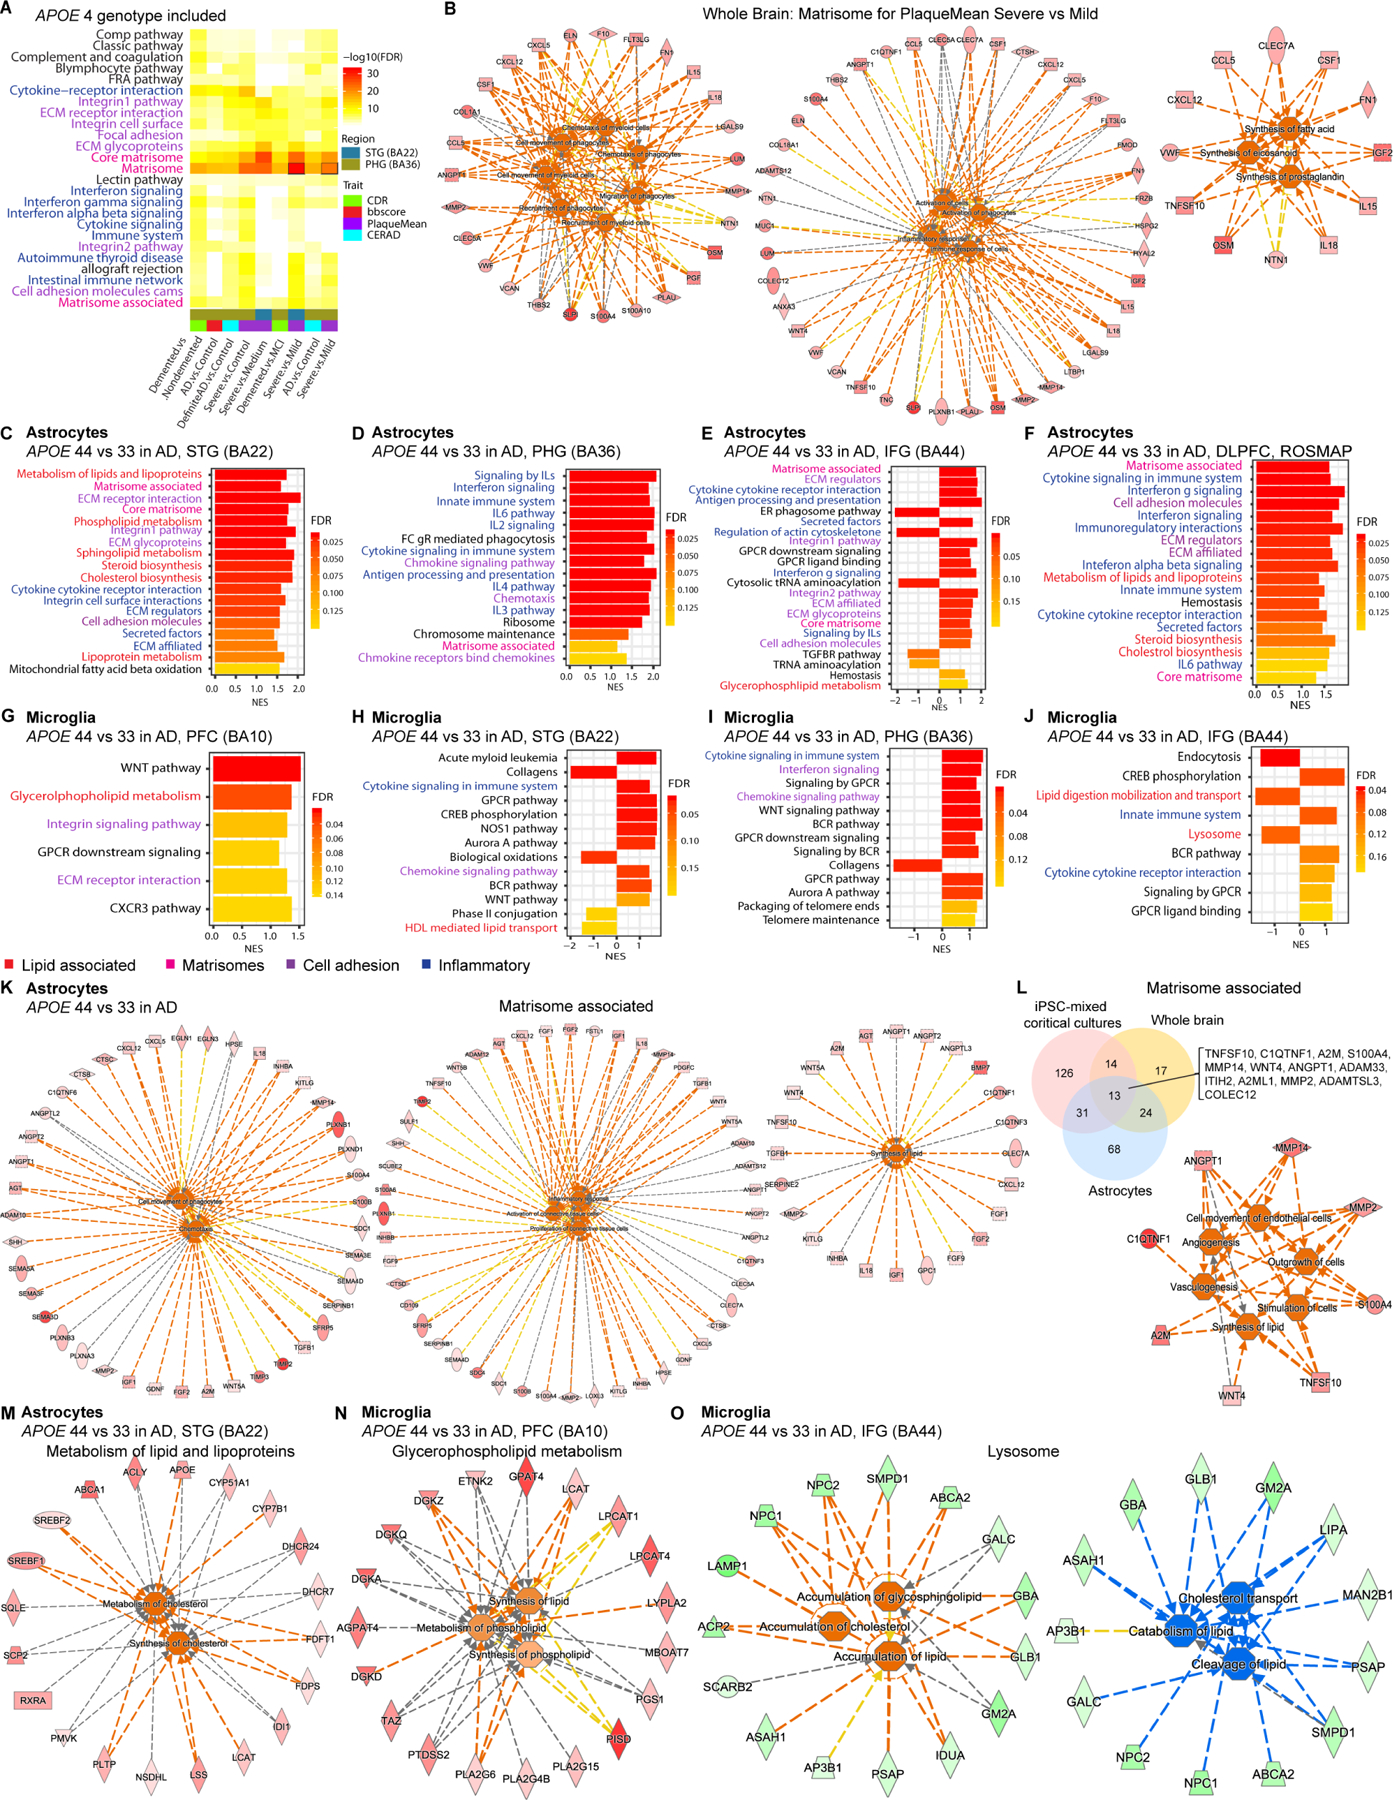
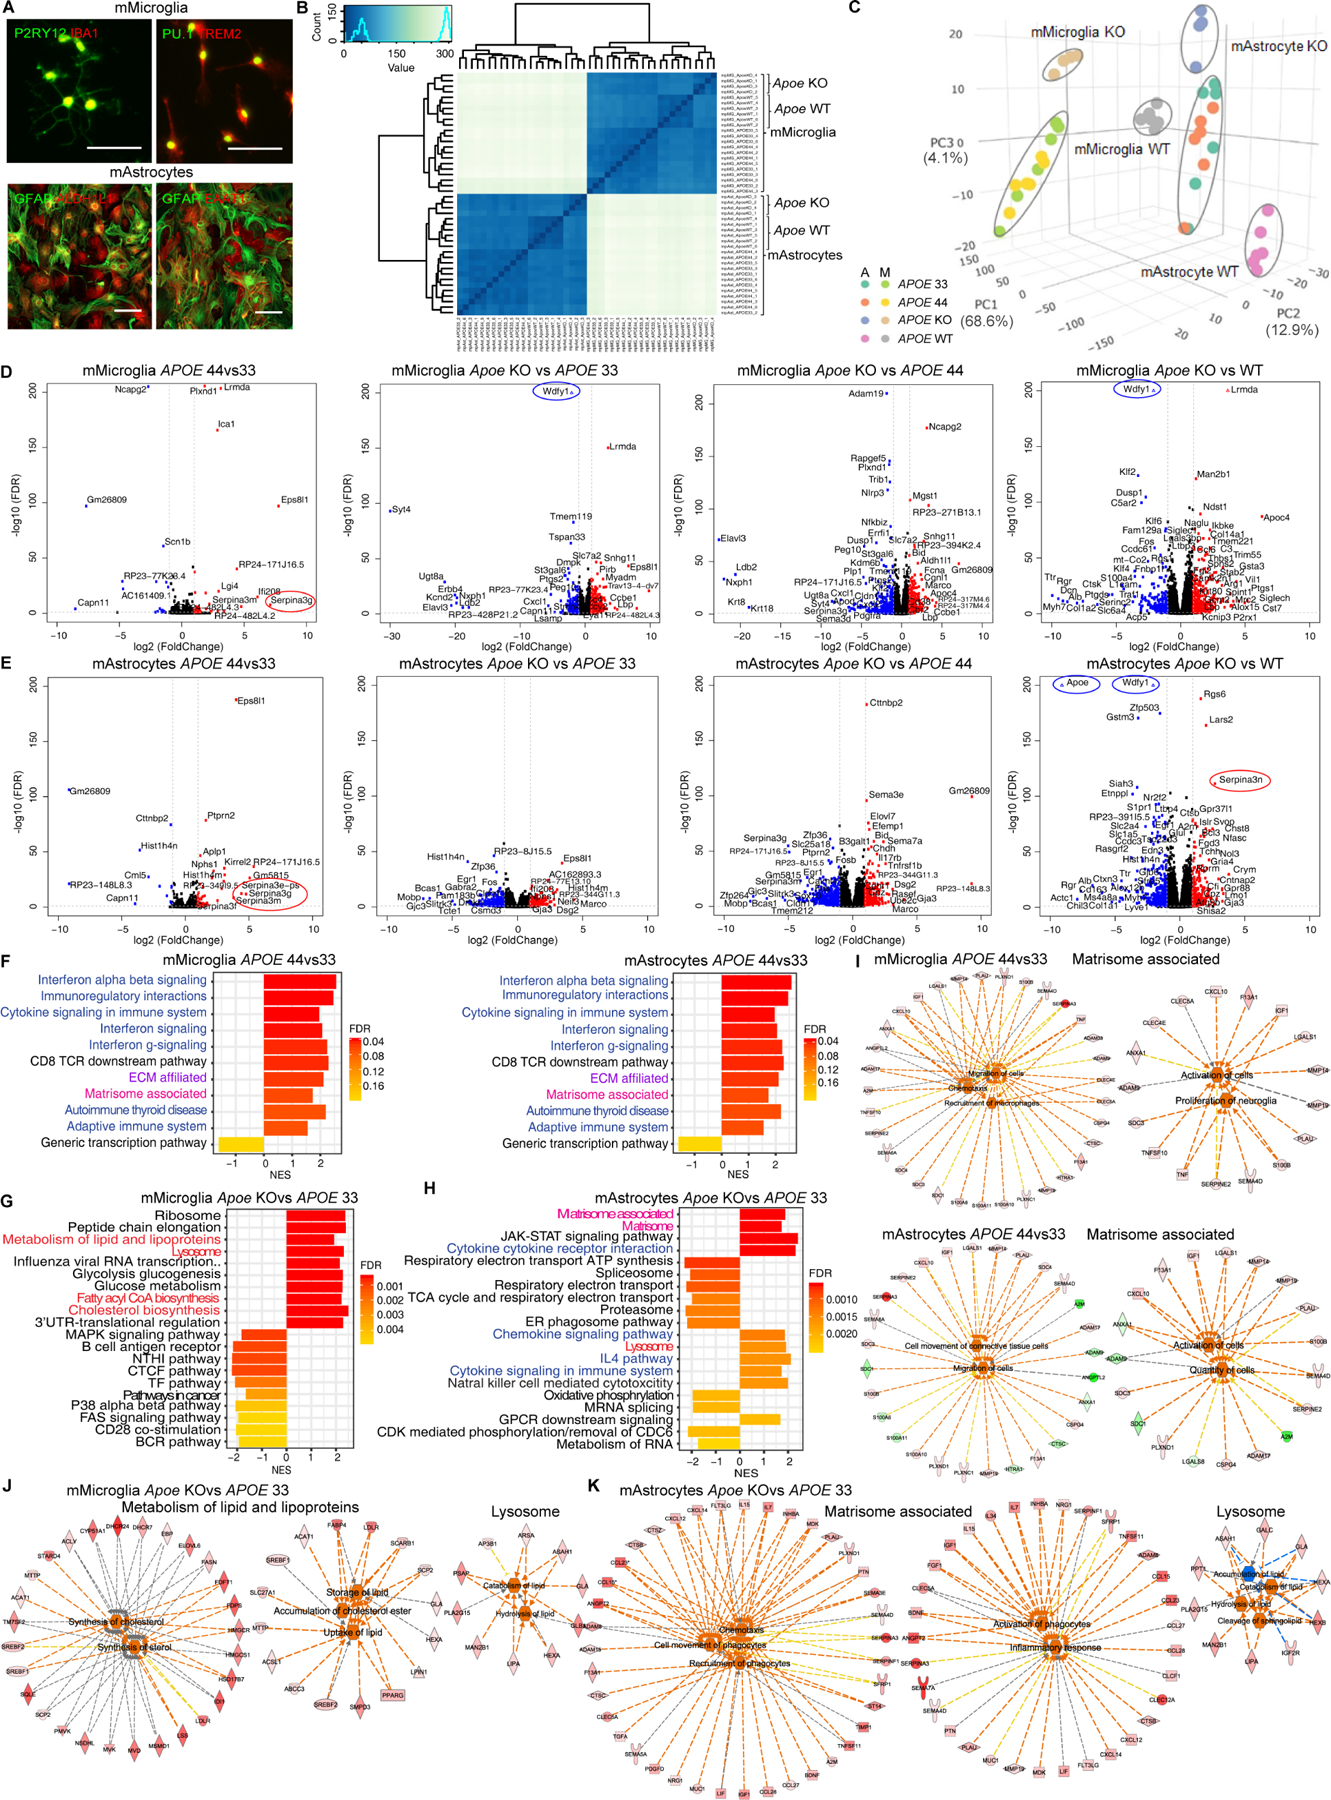
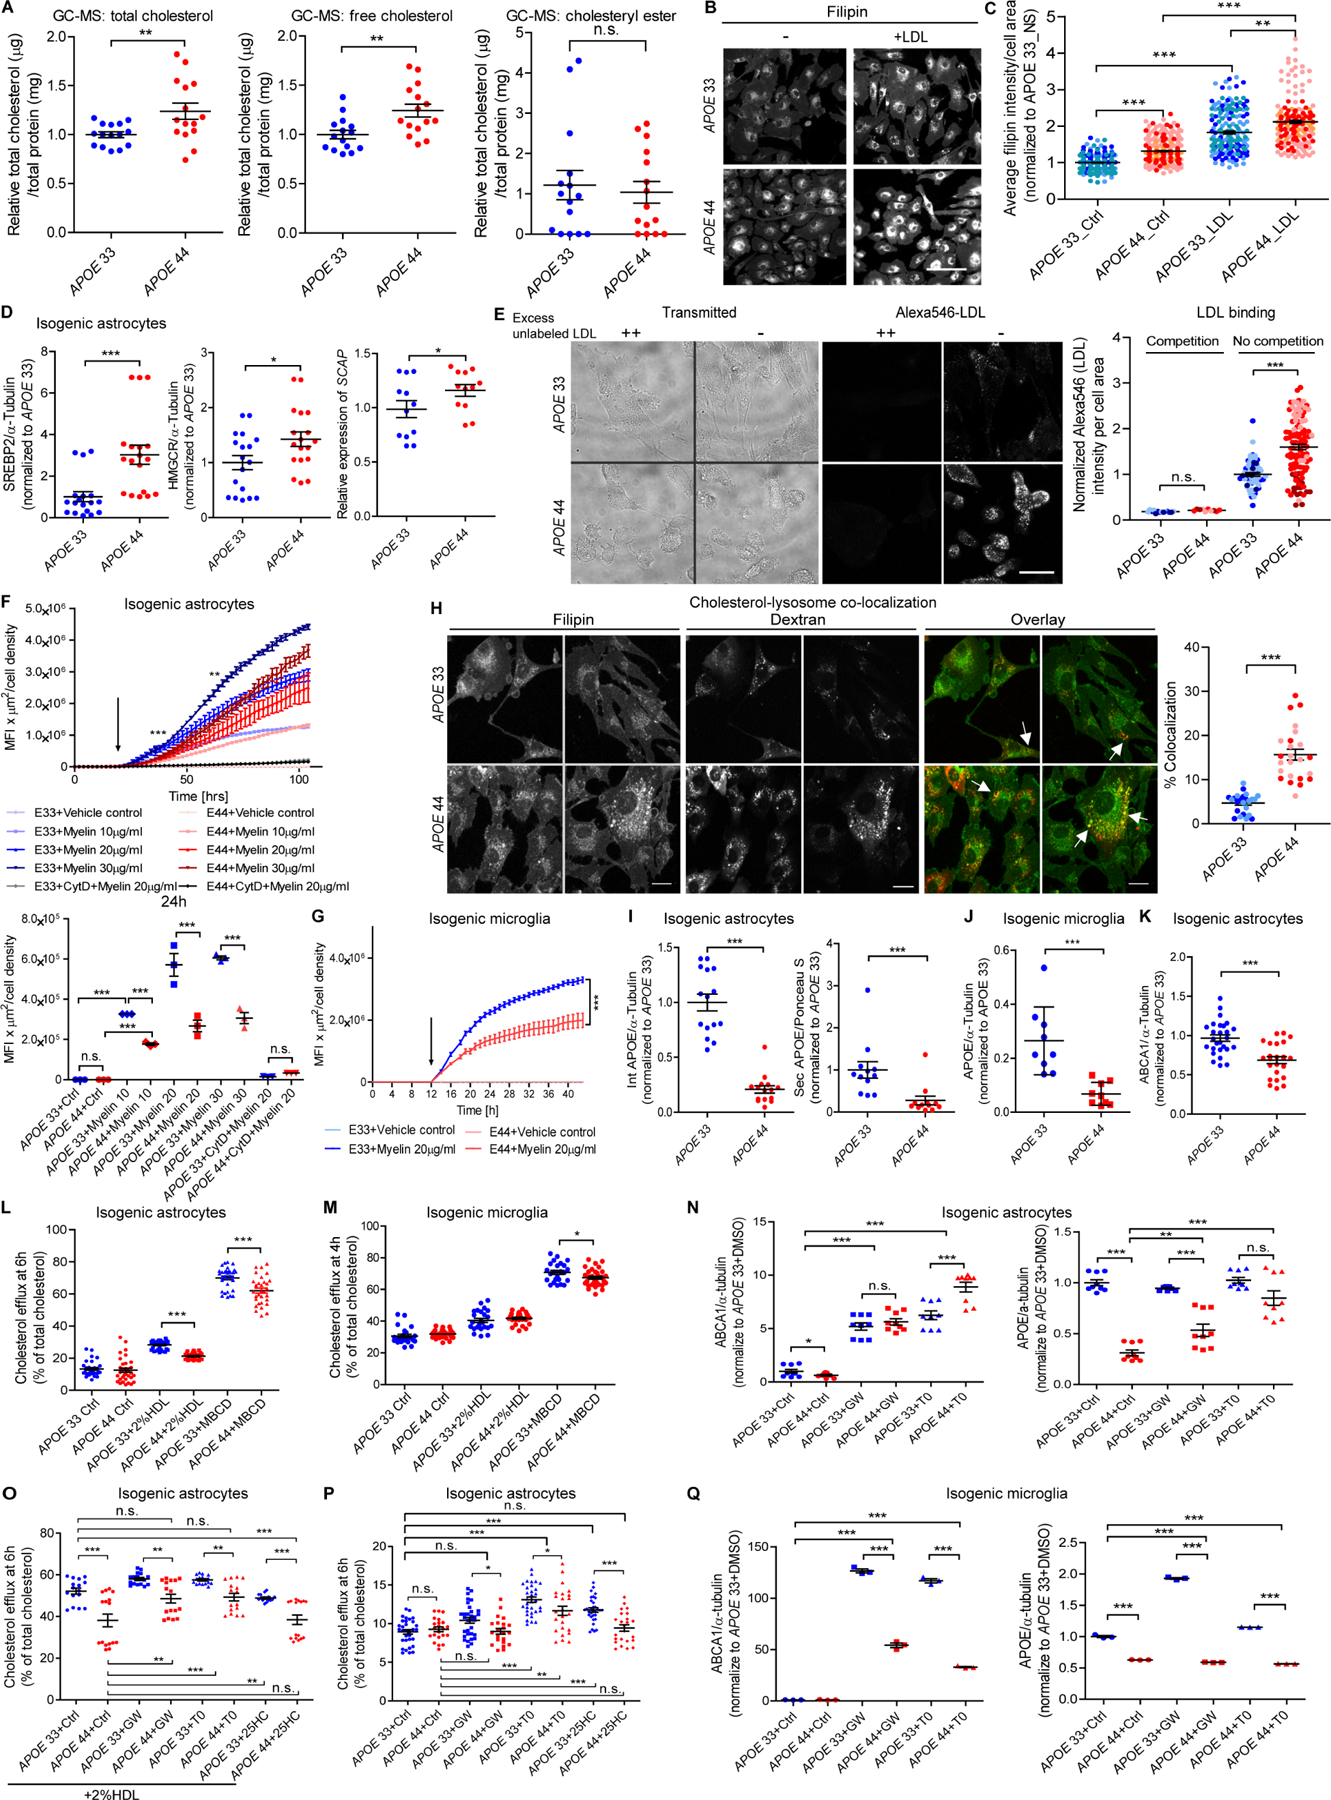
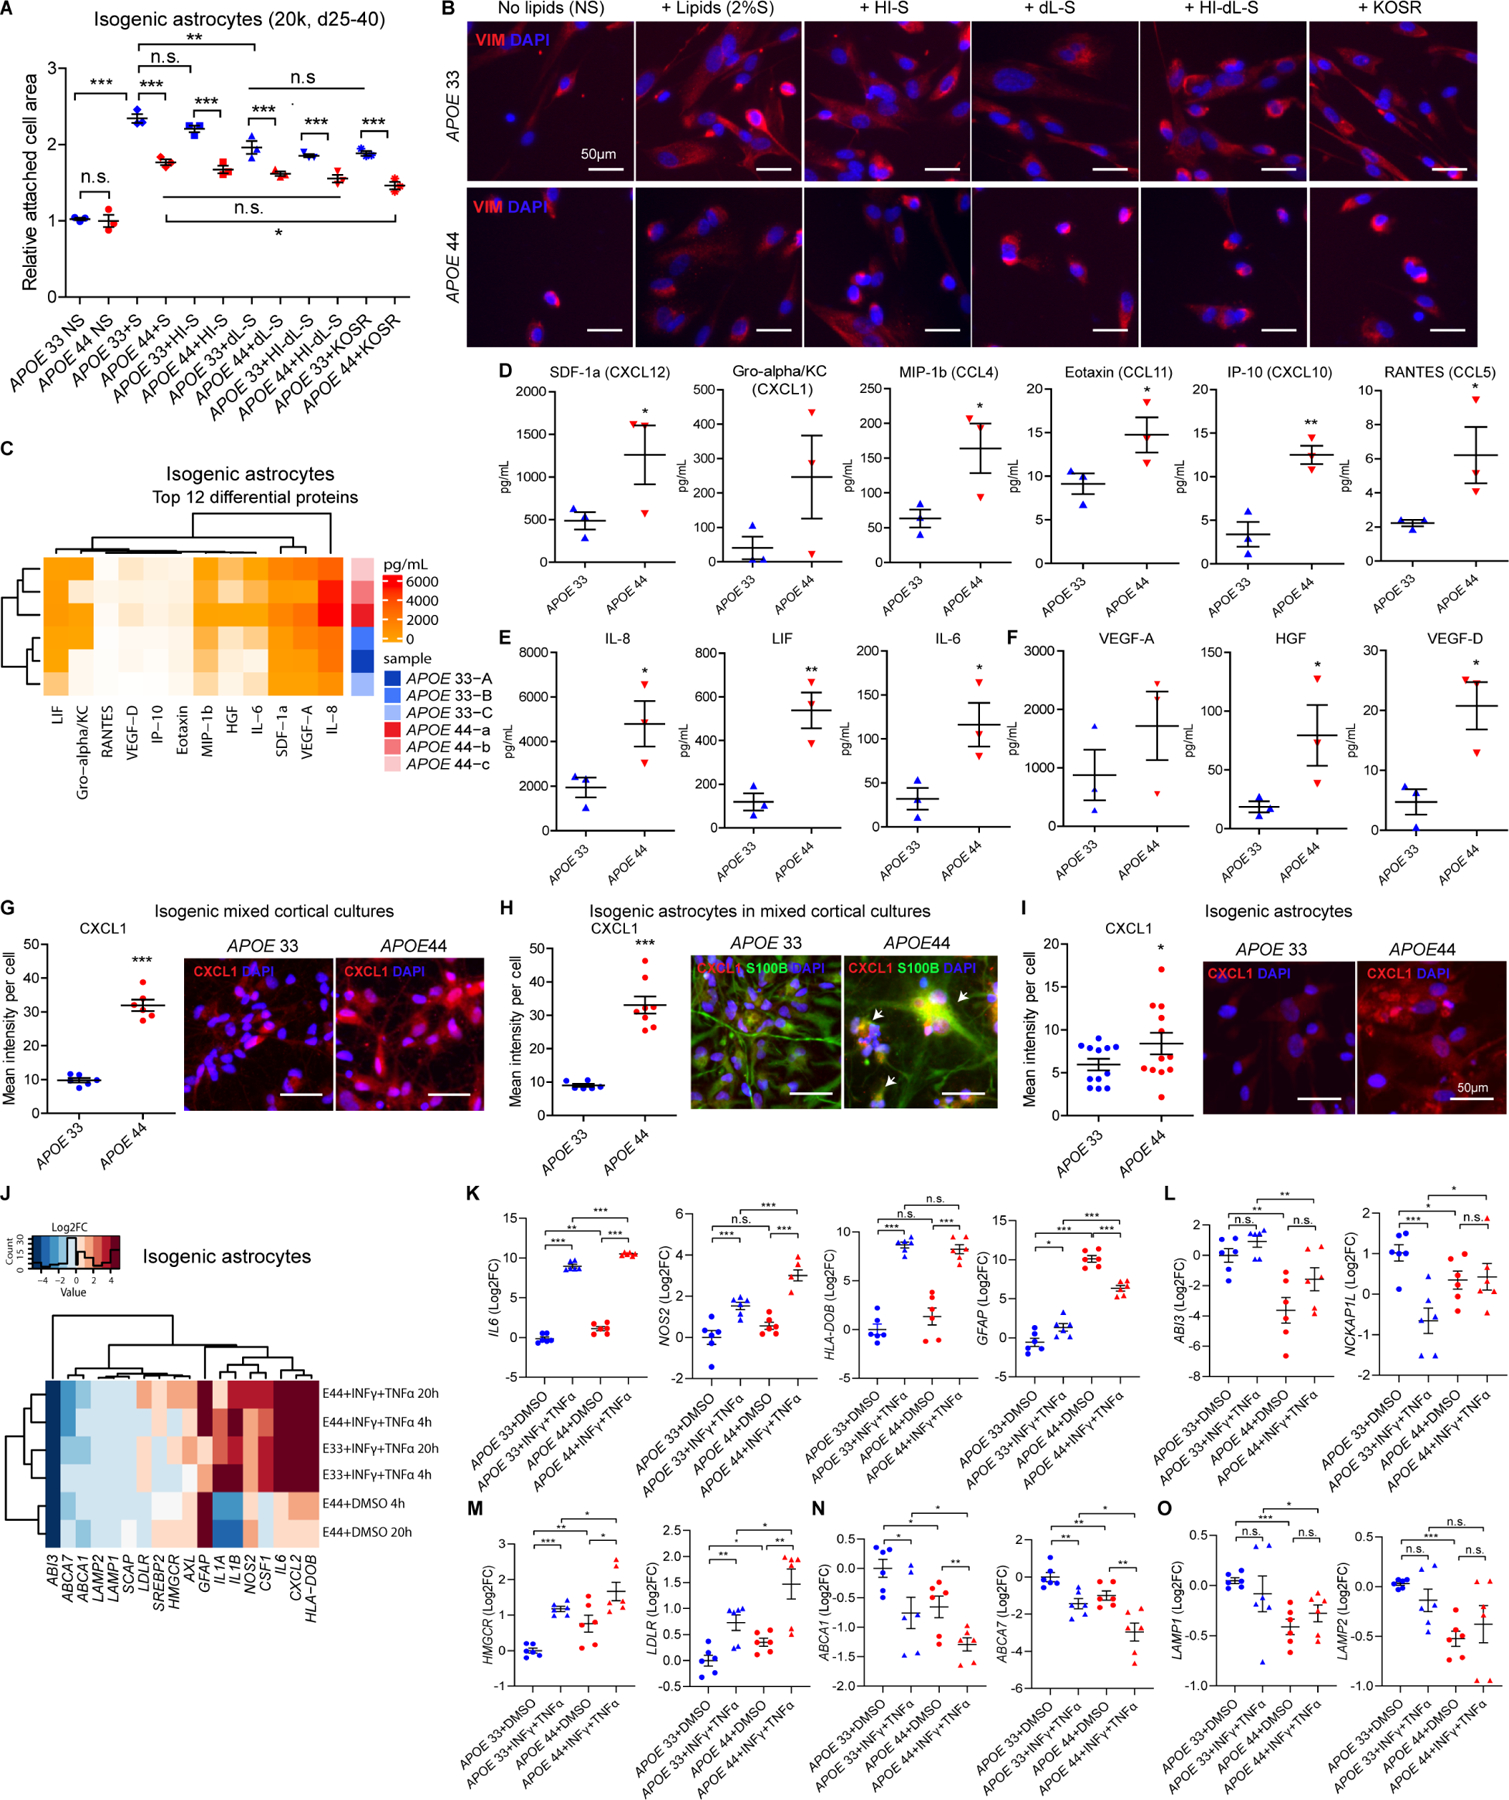
The impact of apolipoprotein E ε4 (APOE4), the strongest genetic risk factor for Alzheimer's disease (AD), on human brain cellular function remains unclear. Here, we investigated the effects of APOE4 on brain cell types derived from population and isogenic human induced pluripotent stem cells, post-mortem brain, and APOE targeted replacement mice. Population and isogenic models demonstrate that APOE4 local haplotype, rather than a single risk allele, contributes to risk. Global transcriptomic analyses reveal human-specific, APOE4-driven lipid metabolic dysregulation in astrocytes and microglia. APOE4 enhances de novo cholesterol synthesis despite elevated intracellular cholesterol due to lysosomal cholesterol sequestration in astrocytes. Further, matrisome dysregulation is associated with upregulated chemotaxis, glial activation, and lipid biosynthesis in astrocytes co-cultured with neurons, which recapitulates altered astrocyte matrisome signaling in human brain. Thus, APOE4 initiates glia-specific cell and non-cell autonomous dysregulation that may contribute to increased AD risk.

Keywords: APOE; Alzheimer; astrocytes; cholesterol; genetic heterogeneity; haplotypes; iPSC disease modeling; inflammation; matrisome; microglia.


Conflict of interest statement

Declaration of interests J.TCW. co-founded Asmos Therapeutics, LLC, serves on the scientific advisory board of NeuCyte, Inc, and has consulted for FIND Genomics Inc., CareCureSystems Corporation, TheWell Biosciences Inc., and Aleta Neuroscience, LLC. A.M.G. has consulted for Eisai, Biogen, Pfizer, AbbVie, Cognition Therapeutics, and GSK and served on the scientific advisory board at Denali Therapeutics from 2015–2018. D.M.H. co-founded and is on the scientific advisory board of C2 N Diagnostics, LLC (licensed anti-tau antibody to AbbVie) and the scientific advisory board of Denali and consults for Genentech and Idorsia. F.R.M. has consulted for Denali Therapeutics in 2019. W.W.P. is a co-inventor of patent WO/2018/160496 (microglia differentiation).

Figures

Figure 1
Figure 1. APOE genotype and haplotype-based brain cell type model.
(A-B) GRS analysis with (A) or without (B) APOE4 SNP in 43 APOE iPSC lines. Labeled IDs for the population model, bolded IDs for the isogenic model. CDR, clinical dementia rating. See Table S1 for phenotypes. (C) APOE local haplotype analysis of population (N=13) and isogenic (N=4) hiPSC lines after haplotype phasing referenced to 1000G (N=399). Bold IDs represent isogenic lines. See Table S1, S5 and S9 for detail. (D) Hierarchical clustering analysis of APOE local haplotype without APOE4 SNP in population lines. (E) Schematic of mixed cortical cultures, astrocytes, microglia and BMECs differentiated from APOE hiPSCs. (F-G) PCA (F) and Spearman correlation analysis (G) of the whole transcriptome from 52 differentiated samples (N=13/cell type). (H) Representative immunofluorescent images of microglia, astrocytes, BMECs and mixed cortical cultures markers. Scale bar=100μm.
Figure 2
Figure 2. Enriched lipid and matrisome pathways by APOE4 in population model.
(A) Volcano plots of APOE4 vs. APOE3 in each cell type. Gene names labeled by >|2| fold change, FDR<0.1. (B) The number of significant DEGs in each cell type. (C-E) Top significant pathways from fGSEA of APOE4 vs. APOE3 in microglia (C), astrocytes (D) mixed cortical cultures after cell type proportion correction (E). (F) Functional pathway analysis of Cholesterol biosynthesis, Lysosome and HDL-mediated lipid transport from fGSEA enriched in APOE4 microglia. Red/orange: upregulated, green/blue: downregulated genes/functions. See Table S2 for functional pathway statistics. (G) Functional pathway analysis of Cholesterol biosynthesis in APOE4 astrocytes. (H) Causal network analysis of Cholesterol biosynthesis in APOE4 microglia and astrocytes. (I) Causal network analysis of HDL-mediated lipid transport in APOE4 microglia. (J) Upstream regulator of downregulated FXR/RXR activity in APOE4 microglia. (K) Functional pathway analysis of Matrisome associated in APOE4 mixed cortical cultures after proportion correction. See Table S3 for functional pathway statistics.
Figure 3
Figure 3. Isogenic model revealing individual variability.
(A) DNA sequence of APOE4 SNP conversion in hiPSCs by CRISPR/Cas9 KI (Knockin). See Table S4 for established isogenic lines. (B-C) PCA (B) and Spearman correlation analysis (C) of gene expression from 90 samples (N=30/cell type). (D) PCA of each cell type (N=30). (E-G) Significant module-trait relationships and pathway enrichments (by Fisher’s exact test, p<0.1; .<0.1, *<0.05, **<0.01, ***<0.005) of the ME differential expression of APOE4 vs. APOE3 and APOE KO vs. APOE3, in population and isogenic microglia (E), astrocytes (F) or mixed cortical cultures (G) after proportion correction from WGCNA. Red or blue modules indicate positive or negative correlations, respectively, of MEs with the comparison traits. FDR=0.05. (H) The number of significant DEGs of APOE4 vs. APOE3 and APOE KO vs. APOE3 in population or isogenic individual for each cell type by DESeq2 or DREAM.
Figure 4
Figure 4. Enriched matrisome pathways by APOE4 in deconvoluted AD brain astrocytes.
(A)Upregulated pathways of DEGs comparing various trait of AD vs. control including APOE4 carriers in different brain regions. See Table S6 for brain cohort details. (B) Functional pathway analysis of Matrisome in severe vs. mild AD from (A). See Table S3 for functional pathway statistics. (C-J) fGSEA of APOE4 vs. APOE3 in each cell type after cell type deconvolution in various regions of AD brain (MSBB and ROSMAP). PFC, prefrontal cortex; STG, superior temporal gyrus; PHG, parahippocampal gyrus; IFG, inferior frontal gyrus; DLPFC, dorsolateral prefrontal cortex. (K) Functional pathway analysis of Matrisome associated in APOE4 AD astrocytes after cell type deconvolution. (L) Overlapping genes in Matrisome associated among iPSC-mixed cortical cultures, whole brain and deconvoluted astrocytes, and predicted functional co-regulations of overlapping genes. (M-O) Functional pathway analysis of lipid pathways in APOE4 AD brain (MSBB) astrocytes (M) and microglia (N-O).
Figure 5
Figure 5. Mouse Apoe and human APOE4 effects in mouse astrocytes and microglia
(A) Representative immunofluorescent images of purified mouse microglia (mMicroglia) and astrocytes (mAstrocytes) markers. Scale bar=100μm. (B-C) Spearman correlation analysis (B) and PCA (C) of gene expression from 44 samples (N=22/cell type). (D-E) Volcano plots of different APOE genotype comparisons in mMicroglia (D) or mAstrocytes (E). Gene names labeled by >|2.5| fold change, FDR<0.1. (F-H) fGSEA of APOE4 (F) or Apoe KO (G-H) vs. APOE3 in mMicroglia and mAstrocytes. (I) Functional pathway analysis of Matrisome associated in APOE4 mMicroglia and mAstrocytes. (J-K) Functional pathway analysis of enriched pathways in Apoe KO mMicroglia (J) and mAstrocytes (K)
Figure 6
Figure 6. Decoupled lipid metabolism due to lysosomal free cholesterol sequestration in APOE4 glia.
(A) Relative total cholesterol, free cholesterol and CE in isogenic APOE astrocytes measured by GC-MS (N=6 lines, 4 independent experiments, 3 replicates). (B-C) Representative fluorescence images (B) and quantification (C) of filipin in isogenic APOE astrocytes +/− LDL. Scale bar=100μm. (N=6, 5 independent experiments, ~20 quantified areas per experiment). (D) Relative protein/transcript levels of SREBP2, HMGCR and SCAP in isogenic APOE astrocytes (N=12, 3 independent experiments). See Figure S6C for representative Westerns. (E) Representative brightfield and fluorescence images and quantification of Alexa546-labeled LDL binding with (competition) or without (no competition) excess unlabeled LDL in isogenic APOE astrocytes. Each dot represents fluorescent intensity in a field, and each field had 4–12 cells. Scale bar=30 µM. (F-G) Mean fluorescent intensity (MFIxµm2) of internalized pHrodo-red-myelin normalized by cell density for 90h (top) and 24h (bottom) in isogenic APOE astrocytes (F) and for 36h in microglia (G). Arrow: treatment starting time point. (N=6, 3 independent experiments). (H) Representative images and % co-localization of filipin and endocytosed TRITC-Dextran in isogenic APOE astrocytes (N=4, 3 independent experiments, each image=an independent line). Yellow puncta labeled arrows in overlays indicate lysosomal cholesterol localization. Scale bar=15μm. (I-K) Relative protein levels of intracellular (int), secreted (sec) APOE (I) and ABCA1 (K) in isogenic APOE astrocytes (N=12, 3 independent experiments) and APOE (J) in microglia (N=6, 3 independent experiments). See Figures S6J, S6N and S6J for representative Westerns. (L-M) Percent cholesterol efflux in no serum control (Ctrl), 2% HDL and methyl-β-cyclodextrin (MBCD) at 6h in isogenic APOE astrocytes (L) and at 4h in isogenic microglia (M). (N=12, 3 independent experiments). (N, Q) Relative protein levels of ABCA1 and APOE with vehicle control (Ctrl, DMSO), GW3965 (GW) and T0901317 (T0) in isogenic APOE astrocytes (N) (N=12, 3 independent experiments) and isogenic microglia (Q) (N=6, 3 independent experiments). See Figures S6Q and S6S for representative Westerns. (O-P) Percent cholesterol efflux at 24h with DMSO, GW, T0 and 25-hydroxycholesterol (25HC) in isogenic APOE astrocytes (N=12, 3 independent experiments). One-way unpaired t-test for genotype comparisons, Two-way ANOVA with Bonferroni post-hoc corrections for comparisons of multiple treatments. *, p<0.05, **, p<0.01, ***, p<0.001, n.s., not significant, Error bars=SEM
Figure 7
Figure 7. Actin cytoskeleton and matrisome dysregulation in APOE4 mixed cortical culture astrocytes.
(A) Relative attached cell area on the surface measured by whole cell masks in isogenic APOE astrocytes with no serum (NS), serum (S), heat-inactivated serum (HI-S), delipidated serum (dL-S), heat-inactivated delipidated serum (HI-dL-S) and knockout serum replacement (KOSR). (B) Representative VIM images in isogenic APOE astrocytes with NS, S, HI-S, dL-S, HI-dL-S and KOSR. (C) Clustering heatmap for top 12 secreted proteins from 45-plex human panel 1 in isogenic APOE astrocytes (N=6, A-C, a-c, isogonics lines, 2 independent experiments, 3 replicates). (D-F) Quantification of chemokines (D), cytokines (E) and growth factors (F) secreted by isogenic APOE astrocytes. (N=6, each dot=2 experiments). (G-I) Representative images and quantification of chemotaxis marker, CXCL1 in isogenic APOE mixed cortical cultures (G), astrocyte ROIs in mixed cortical cultures (H) and pure astrocytes (I) (N=12). (J-O) Clustering heatmap for representative genes (J) and relative expressions of matrisome (K), actin cytoskeleton (L), cholesterol biosynthesis (M), cholesterol efflux (N) and lysosome (O) in isogenic APOE astrocytes with or without proinflammatory activators (INFγ+TNFα) or vehicle controls (DMSO) for 4h and 20h. One-way unpaired t-test for genotype comparisons, Two-way ANOVA with Bonferroni post-hoc corrections for comparisons of multiple treatments. *, p<0.05, **, p<0.01, ***, p<0.001, n.s., not significant, Error bars=SEM

Comment in

References

    1. Abreu CM, Gama L, Krasemann S, Chesnut M, Odwin-Dacosta S, Hogberg HT, Hartung T, and Pamies D (2018). Microglia Increase Inflammatory Responses in iPSC-Derived Human BrainSpheres. Front Microbiol 9, 2766. - PMC - PubMed
    1. Abud EM, Ramirez RN, Martinez ES, Healy LM, Nguyen CHH, Newman SA, Yeromin AV, Scarfone VM, Marsh SE, Fimbres C, et al. (2017). iPSC-Derived Human Microglia-like Cells to Study Neurological Diseases. Neuron 94, 278–293 e279. - PMC - PubMed
    1. Andreone BJ, Przybyla L, Llapashtica C, Rana A, Davis SS, van Lengerich B, Lin K, Shi J, Mei Y, Astarita G, et al. (2020). Alzheimer’s-associated PLCgamma2 is a signaling node required for both TREM2 function and the inflammatory response in human microglia. Nature neuroscience - PubMed
    1. Barcia C, Ros CM, Annese V, Gomez A, Ros-Bernal F, Aguado-Yera D, Martinez-Pagan ME, de Pablos V, Fernandez-Villalba E, and Herrero MT (2011). IFN-gamma signaling, with the synergistic contribution of TNF-alpha, mediates cell specific microglial and astroglial activation in experimental models of Parkinson’s disease. Cell Death Dis 2, e142. - PMC - PubMed
    1. Bardy C, van den Hurk M, Eames T, Marchand C, Hernandez RV, Kellogg M, Gorris M, Galet B, Palomares V, Brown J, et al. (2015). Neuronal medium that supports basic synaptic functions and activity of human neurons in vitro. Proc Natl Acad Sci U S A 112, E2725–2734. - PMC - PubMed

Publication types