. 2022 Jun 23;185(13):2292-2308.e20.
doi: 10.1016/j.cell.2022.05.021.

Parkinson's disease-risk protein TMEM175 is a proton-activated proton channel in lysosomes

Affiliations

Parkinson's disease-risk protein TMEM175 is a proton-activated proton channel in lysosomes

Meiqin Hu et al. Cell. .

Abstract

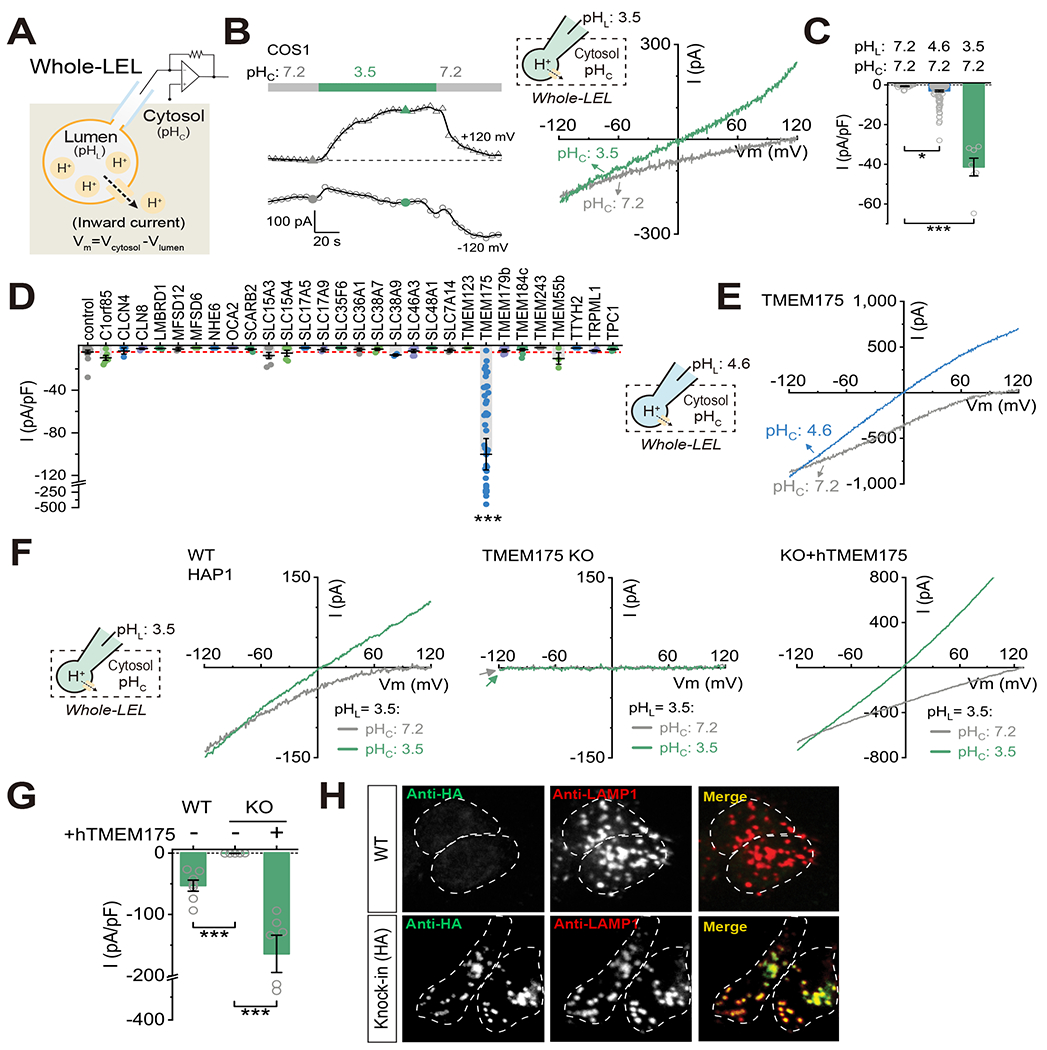
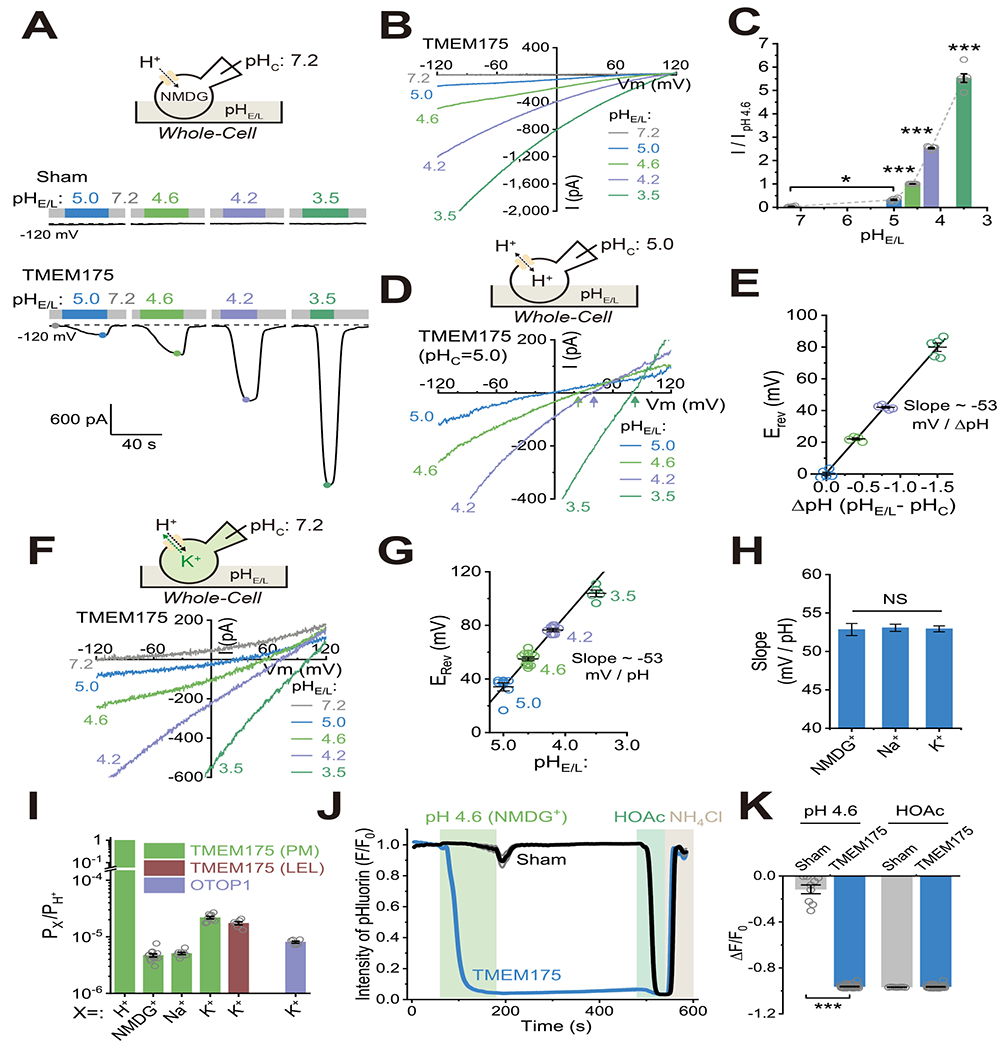
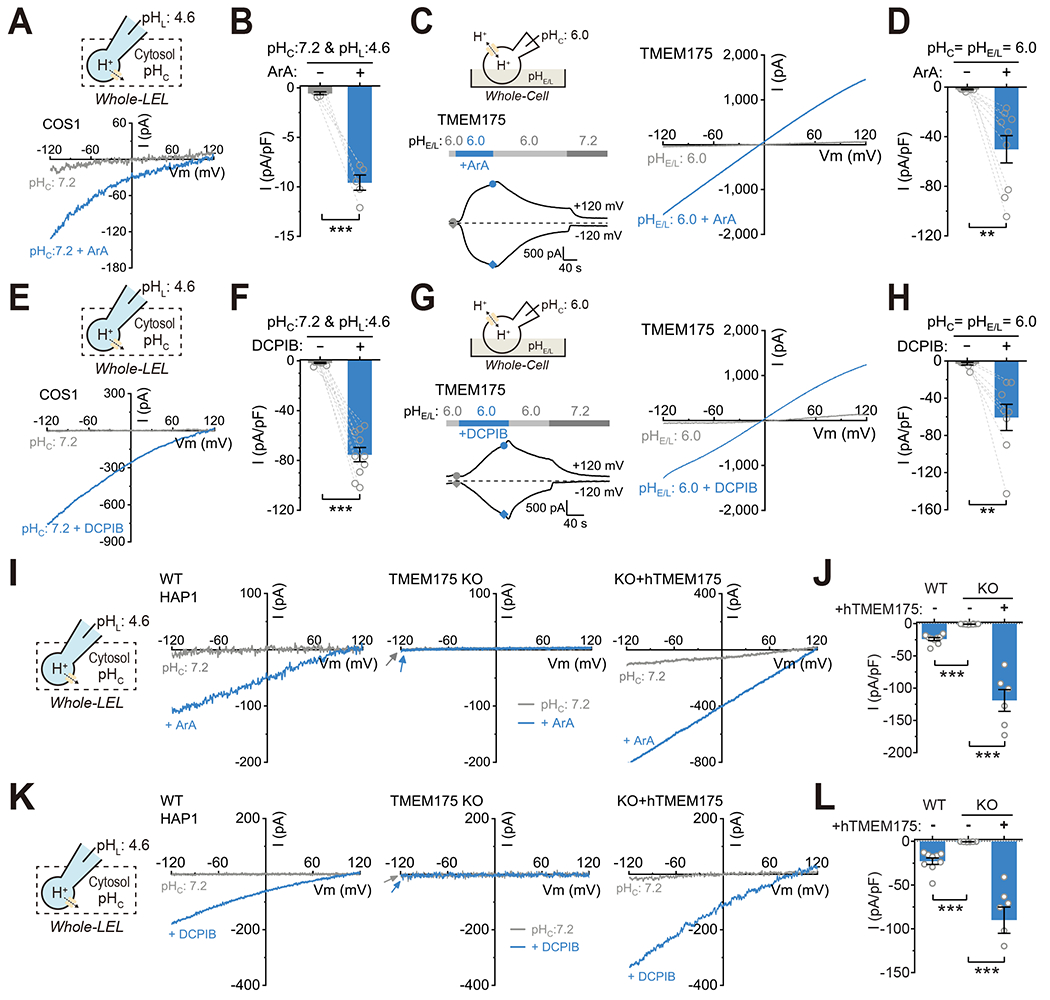
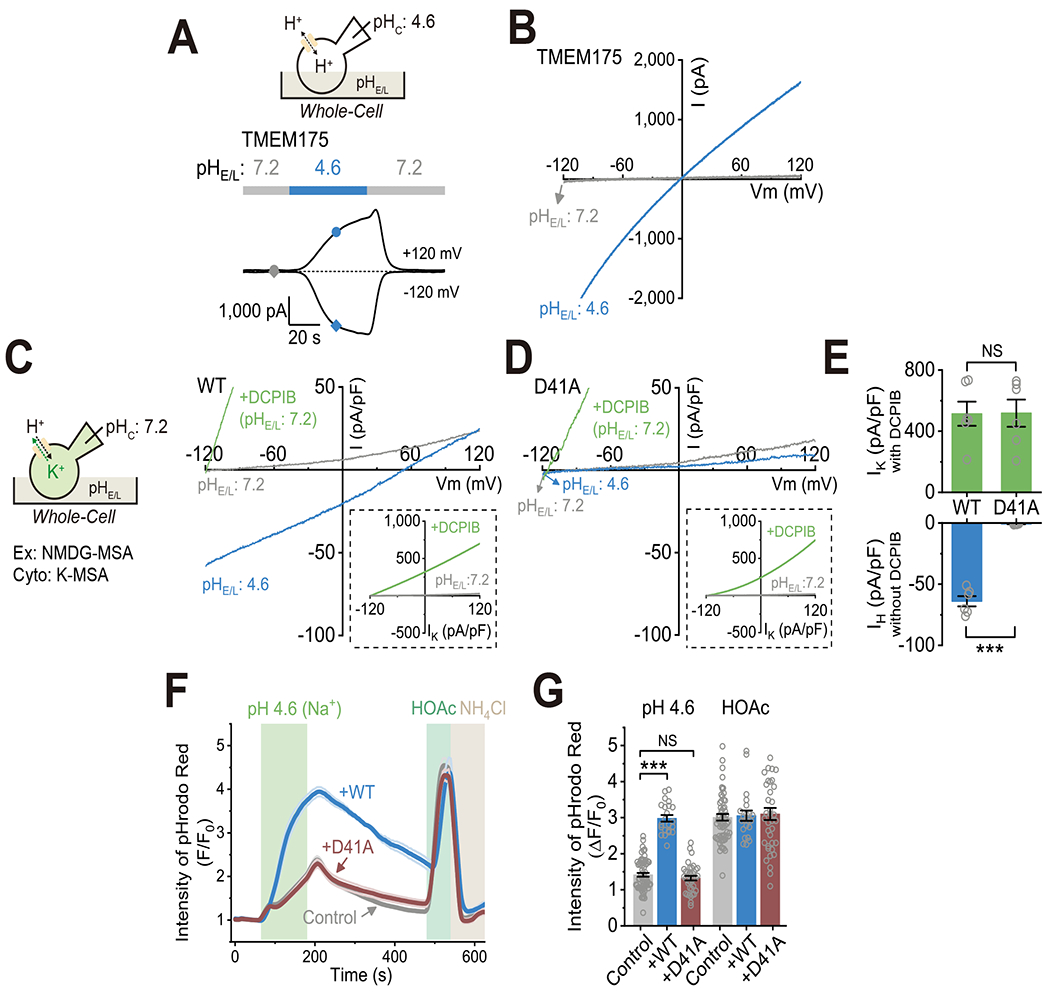
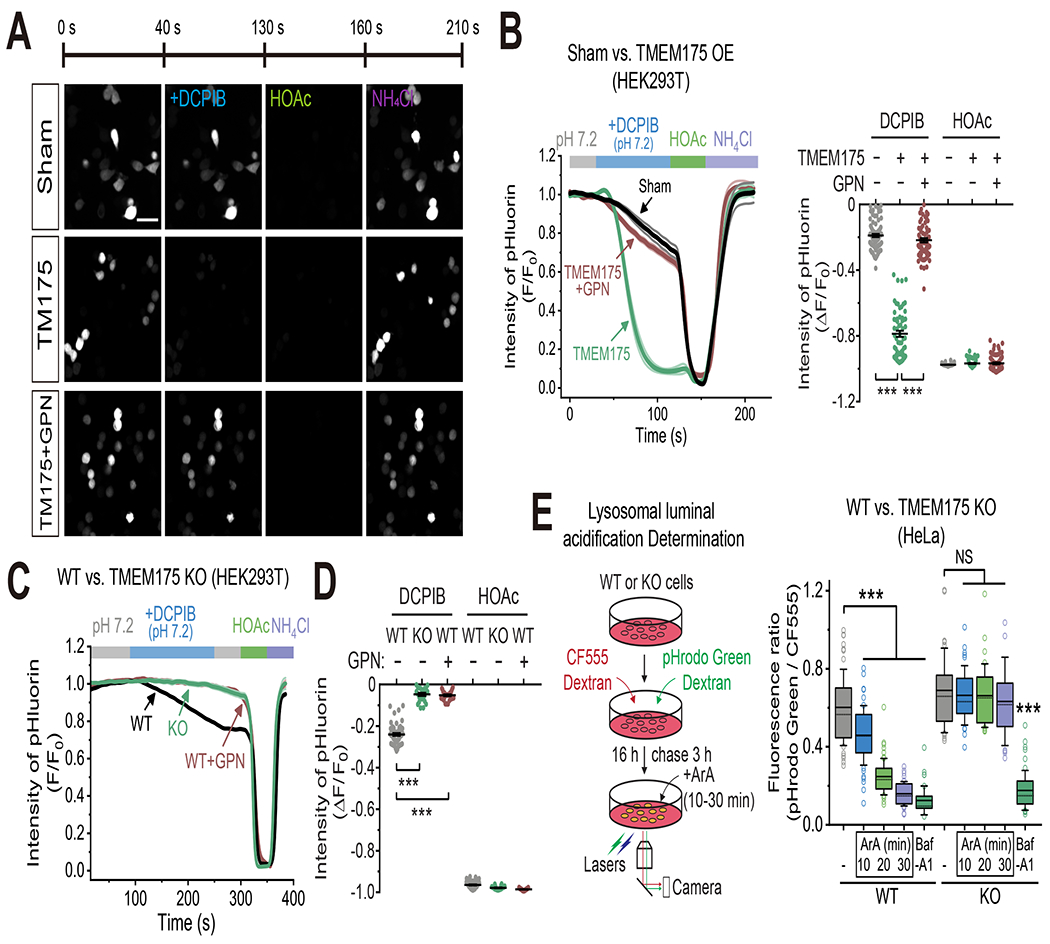
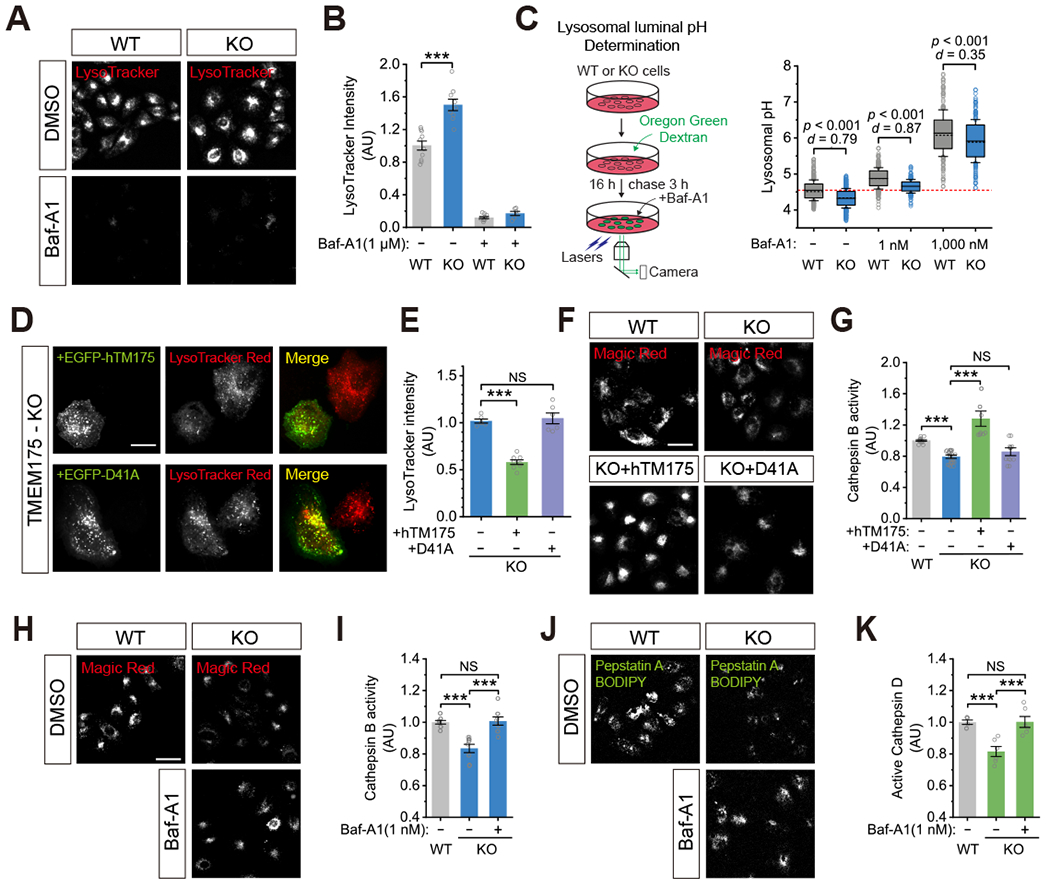
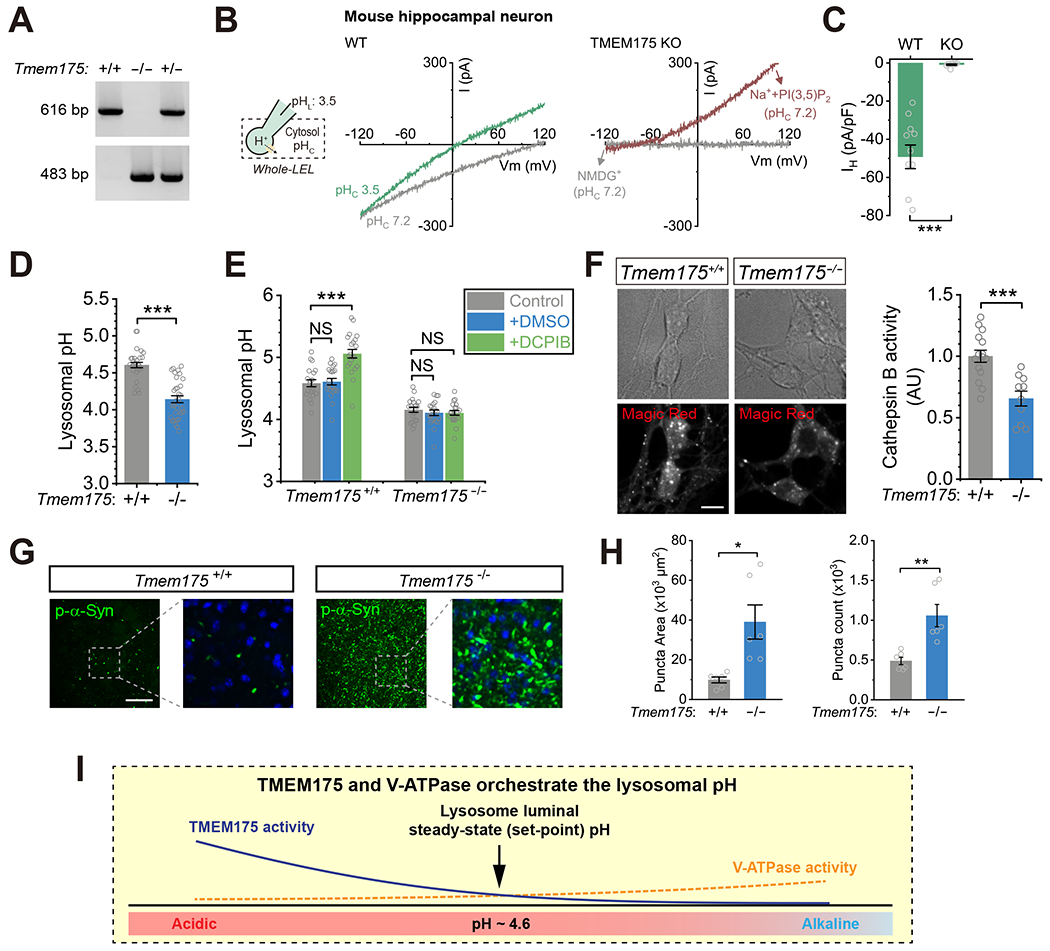
Lysosomes require an acidic lumen between pH 4.5 and 5.0 for effective digestion of macromolecules. This pH optimum is maintained by proton influx produced by the V-ATPase and efflux through an unidentified "H+ leak" pathway. Here we show that TMEM175, a genetic risk factor for Parkinson's disease (PD), mediates the lysosomal H+ leak by acting as a proton-activated, proton-selective channel on the lysosomal membrane (LyPAP). Acidification beyond the normal range potently activated LyPAP to terminate further acidification of lysosomes. An endogenous polyunsaturated fatty acid and synthetic agonists also activated TMEM175 to trigger lysosomal proton release. TMEM175 deficiency caused lysosomal over-acidification, impaired proteolytic activity, and facilitated α-synuclein aggregation in vivo. Mutational and pH normalization analyses indicated that the channel's H+ conductance is essential for normal lysosome function. Thus, modulation of LyPAP by cellular cues may dynamically tune the pH optima of endosomes and lysosomes to regulate lysosomal degradation and PD pathology.

Keywords: Proton channel; acidification; degradation; lysosome; pH optimum.


Conflict of interest statement

Declaration of interests H.X. is the scientific co-founder and a partial owner of Lysoway Therapeutics Inc (Boston, MA).

Figures

Figure 1.
Figure 1.. TMEM175 is necessary and sufficient for lysosomal proton-activated proton-permeant (LyPAP) currents.
(A) Diagram of whole-LEL (late endosome and lysosome) recording method. Cation flow out of the LEL is defined as inward current. (B) Whole-LEL H+ “leak” currents from a COS1 cell. Luminal pH (pHL) was set to 3.5 and cytosolic pH (pHC) varied as indicated. Unless otherwise indicated, all recording solutions contained NMDG-MSA as the major ions. The I-V relations at the time of the colored points are illustrated. (C) Summary of whole-LEL H+ “leak” current density (pA/pF) at −120 mV (Vm= VCytosol – VLumen) from COS1 cells. Representative recordings when pHL was set to 4.6 or 7.2 are shown in Supplemental Fig. S1A and S1C (pHL 7.2/4.6/3.5: n = 18/128/7 LELs, mean ± SEM, * p <0.05, *** p <0.001). (D) Candidate expression screening revealed that only human TMEM175 overexpression resulted in a dramatic increase of whole-LEL H+ “leak” currents from COS1 cells (pHL = 4.6 and pHC = 7.2). The red dashed line represents the mean level from non-transfected control cells (control/TMEM175/others: n = 16/39/2-9 LELs, mean ± SEM, *** p <0.001). (E) Typical whole-LEL H+ “leak” currents from a COS1 cell overexpressing TMEM175. (F) Examples of whole-LEL H+ “leak” currents from WT HAP1 cells, TMEM175 KO cells, and KO cells re-expressing human TMEM175 (hTMEM175, pHL = 3.5). (G) Summary of current density at −120 mV from experiments as in (F) (WT/KO/KO+hTMEM175: n = 7/5/6, mean ± SEM, *** p <0.001). (H) Assessment of co-localization of TMEM175 with LAMP1 in TMEM175-HA knock-in and WT control HAP1 cells that were immuno-stained with anti-HA (green) and anti-LAMP1 (red) antibodies. Dashed lines indicate cell perimeters. Scale bar = 10 μm.
Figure 2.
Figure 2.. The TMEM175 channel is highly proton selective.
(A-B) Whole-cell currents recorded in an HEK293T cell overexpressing TMEM175 or a vector transfected (sham) cell. pHC was set to 7.2 and extracellular pH (pHE/L) varied as indicated. Unless otherwise indicated, all recording solutions (bath/extracellular and pipette/cytosolic) contained NMDG-MSA as the major ions. (C) Summary of whole-cell TMEM175 currents (ITMEM175) at −120 mV normalized to current at pHE/L = 4.6 (n = 6 cells, mean ± SEM, * p <0.05, *** p <0.001). Summary of whole-cell macroscopic conductance is shown in Supplemental Fig. S3A. (D) Erev measured in an HEK293T cell overexpressing TMEM175 with pHc set to 5.0 and pHE/L varied as indicated. (E) Erev as a function of ΔpH (= pHE/L- pHC) from experiments as in (D). The line fit to the data had a slope of −53 mV/ΔpH (n = 4 - 5, mean ± SEM). (F) Erev of ITMEM175 under “bi-ionic” conditions. The cytosolic solution contained K-MSA instead of NMDG-MSA as the major ions (pHc = 7.2). (G) Analysis of pH-dependence of Erev from experiments as in (F). The line is a least square linear regression fit to the averages of Erev measured at pHE/L 5.0 to 4,2 (n = 5 - 11, slope = −53 mV/ΔpH, mean ± SEM). (H) Summary of slope values in the pH-Erev experiments when NMDG+ (as in D-E), Na+, and K+ (as in F-G) were used as the major ions (n = 4 - 6, mean ± SEM, NS, p > 0.05). (I) Analysis of relative H+ permeability over NMDG+, Na+, or K+ based on Erev measurement (n = 6 - 13). The estimated PK/PH for the OTOP1 H+ channel, measured using the same recording conditions, is shown for comparison. Note that an incomplete block (by TEA+) of background K+ channels present in the HEK293T plasma membrane (PM) might make a contaminating contribution to PK, hence leading to an underestimated PH/PK value for TMEM175 on the PM compared with on LELs. Additionally, the outward currents may also contain a contaminating component of H+, currents due to experimentally-induced cytosolic H+ accumulation (see Methods). (J) Average pHlourin fluorescence in TMEM175-transfected HEK293T cells (n > 30 cells per coverslip) in response to stimuli as indicated. Imaging solutions contained NMDG-MSA as the major ions. HOAc (pH 5.0) and NH4Cl (pH 7.2), which freely enter the cytosol, served as positive and negative controls to acidify or alkalinize the cytosol, respectively. (K) Summary of relative pHluorin fluorescence intensity in response to pHE/L 4.6 and HOAc (sham/TMEM175: n = 9/35, mean ± SEM, *** p <0.001). See Supplemental Fig. S3K–O for similar experiments using other imaging solutions. N represents the number of cells randomly selected from at least three independent biological replicates.
Figure 3.
Figure 3.. Arachidonic Acid and synthetic chemicals activate TMEM175.
(A) Effects of Arachidonic Acid (ArA, 200 μM) on whole-LEL H+ currents in COS1 cells. The luminal solution contained NMDG-MSA with pHL set to 4.6. (B) Summary of current density at −120 mV from isolated enlarged LELs as in (A) (n = 5 LELs, mean ± SEM, *** p <0.001). (C-D) Effects of ArA (100 μM) on whole-cell H+ currents in TMEM175-transfected HEK293T cells. Current density (−120 mV) before and after ArA application is summarized in (D) (n = 9 cells, mean ± SEM, ** p <0.01), A representative recording from a non-transfected control cell is shown in Supplemental Fig. S4A. (E-F) Effects of DCPIB (100 μM) on whole-LEL H+ currents in COS1 cells. Current density (−120 mV) is summarized in (F) (n = 10 LELs, mean ± SEM, *** p <0.001). (G-H) Effects of DCPIB (50 μM) on whole-cell H+ currents in TMEM175-transfected HEK293T cells. Current density (−120 mV) before and after DCPIB application is summarized in (H) (n = 8 cells, mean ± SEM, ** p <0.01). (I) Representative traces of whole-LEL H+ currents from WT HAP1 cells, TMEM175 KO cells, and KO cells re-expressing human TMEM175 (KO+hTMEM175) in response to ArA (100 μM) with pHL = 4.6 and pHC = 7.2. (J) Summary of whole-LEL H+ currents (−120 mV) from experiments as in (I) (WT/KO/KO+hTMEM175, n = 9/10/6, mean ± SEM, *** p <0.001). (K) Representative traces of whole-LEL H+ currents from WT HAP1 cells, TMEM175 KO cells, and KO cells re-expressing human TMEM175 (KO+hTMEM175) in response to DCPIB (100 μM) with pEL = 4.6 and pHC = 7.2. (L) Summary of whole-LEL H+ currents (−120 mV) from experiments as in (K) (WT/KO/KO+hTMEM175, n = 9/8/7, mean ± SEM, *** p <0.001).
Figure 4.
Figure 4.. The TMEM175 channel is activated by luminal protons.
(A-B) Whole-cell currents recorded in aTMEM175-overexpressing HEK293T cell with the proton gradient reversed from what is normally found across lysosomal membranes. Cytosolic pHC was set to 4.6 and the extracellular pHE/L varied from 7.2 to 4.6 and back. See Supplemental Fig. S5F for a lumen-side-out lysosomal recording. (C-D) Whole-cell currents recorded in an HEK293T cell overexpressing WT TMEM175 or the D41A mutant. The cytosolic solution contained K-MSA with pHC set to 7.2. The large outward K+ currents in the presence of DCPIB are shown on a different scale in the boxed inset. (E) Summary of H+ (IH) and K+ (IK) currents recorded in cells from experiments as in (C-D). IH was recorded at pHE/L 4.6 at −120 mV without any activator, and IK was recorded in the presence of 50 μM DCPIB at pHE/L 7.2 at +120 mV (WT/D41A: n = 6/6 cells, mean ± SEM, *** p <0.001). (F) Average fluorescence changes of pHrodo™ Red in HEK293T cells overexpressing WT EGFP-TMEM175 or EGFP-TMEM175-D41A in response to the stimuli as indicated. (G) Summary of the relative fluorescent intensity of pHrodo™ Red in response to pH 4.6 and HOAc (control/WT/D41A, n = 65/25/38 cells; mean ± SEM, *** p <0.001, NS, p > 0.05). N represents the number of cells randomly selected from at least three independent biological replicates.
Figure 5.
Figure 5.. Activation of lysosomal TMEM175 induces proton efflux from lysosomes.
(A) The fluorescence intensity of pHluorin in HEK293T cells dually transfected with pHluorin and mCherry-TMEM175 or mCherry (sham) in response to stimuli as indicated (scale bar = 50 μm). Imaging solution was set to pHE/L 7.2 to minimize H+ influx across the plasma membrane (ΔpH = 0). DCPIB (50 μM) was bath applied to activate TMEM175. In the GPN experiment, cells were pre-treated with GPN (200 μM) one hour before imaging to dissipate the lysosomal H+ gradient. (B) Average time series from experiments as in (A) (mean ± SEM). The right panel shows the summary of relative pHluorin fluorescence intensity in response to DCPIB and HOAc (sham/TM175/TM175+GPN, n = 88/63/73 randomly selected cells from at least three independent biological repeats; mean ± SEM, *** p <0.001). See Supplemental Fig. S7A–B for the effect of ArA. (C) Average pHlourin fluorescence in pHlourin-expressing WT or TMEM175 KO HEK293T cells in response to stimuli as indicated (mean ± SEM). DCPIB (20 μM) was bath-applied to activate endogenous lysosomal TMEM175. In the GPN experiment, cells were pretreated with GPN (200 μM) one hour before imaging. Imaging solutions contained Na-MSA as the major ions. HOAc and NH4Cl served as controls to acidify or alkalinize the cytosol. (D) Summary of relative pHluorin fluorescence intensity in response to pHE/L 4.6 and HOAc from experiments as in (C) (WT/KO/WT+GPN: n = 57/26/31 cells, mean ± SEM, *** p <0.001). (E) Time-dependent effects of ArA application (400 μM) on lysosomal acidity in WT and KO HeLa cells, which was determined using a ratiometric pH dye combination (pHrodo Green dextran and CF555 dextran). Note that the slow de-acidification effect of ArA on lysosomes might be due to a combination of slow membrane diffusion, delayed lysosomal delivery, and the existence of counteracting acidifying force. Baf-A1 (1 μM, 1h) served as a positive control. Plots show the fluorescence ratios of pHrodo Green vs. CF555 (n = 26-52 randomly selected cells from three biological replicates; *** p <0.001, NS, p > 0.05) (see Methods for the details about the box plots).
Figure 6.
Figure 6.. Proton permeation through TMEM175 is required for lysosomal pH homeostasis and effective proteolytic degradation.
(A-B) Lysosomal acidity assessed by LysoTracker (red) staining in WT and TMEM175 KO HeLa cells (scale bar = 50 μm). Plots show the overall LysoTracker intensity per cell (n = 6-10 randomly selected images from at least three independent biological repeats, *** p <0.001). Cells incubated with 1 μM Baf-A1 for 1 hour served as a positive control. (C) Lysosomal pH in WT and KO HeLa cells determined using Oregon Green Dextran. Baf-A1 was applied to mildly (1 nM) or maximally (1,000 nM) block the V-ATPase to alkalize the lysosomes. The red dashed line represents the mean level from WT cells (n = 177-487 cells per group; Cohen’s d > 0.75 indicates large effects and d = 0.25-0.50 indicates small effects. (D-E) Lysosomal acidity assessed by LysoTracker staining in TMEM175 KO HeLa cells re-expressing WT EGFP-TMEM175 or EGFP-TMEM175-D41A (scale bar = 20 μm, n = 6-8, *** p < 0.001, NS, p > 0.05). (F-G) Lysosomal Cathepsin B activity assayed by Magic Red staining in WT, KO, and KO HeLa cells stably expressing WT TMEM175 or D41A (scale bar = 50 μm, n = 6-13, NS, p > 0.05, *** p < 0.001). (H-I) Lysosomal Cathepsin B activity in WT, KO, and KO cells incubated with Baf-A1 (1 nM) for 30 min (scale bar = 50 μm; n = 6-8, NS, p > 0.05, *** p < 0.001). (J-K) Lysosomal active amount of Cathepsin D assayed by Pepstatin-A-BODIPY-FL staining in WT, KO, and KO cells incubated with Baf-A1 (1 nM) for 30 min (scale bar = 50 μm; n = 6, NS, p > 0.05, *** p < 0.001). All plots show the results from at least three independent biological replicates for each experimental condition.
Figure 7.
Figure 7.. TMEM175 deficiency in mouse neurons causes lysosomal over-acidification, impaired lysosomal hydrolytic activity, and α-synuclein aggregation in the brain.
(A) PCR genotype analysis of Tmem175+/+ (WT), Tmem175+/− (Heterozygous), and Tmem175−/− (KO) mice. (B) Whole-LEL ILyPAP in the cultured hippocampal neurons isolated from WT and Tmem175 KO mice (pHL = 3.5 and pHC = 7.2). The TPC-mediated outward Na+ current evoked by PI(3,5)P2 (Wang et al., 2012) served as a positive control that the recording was in the whole-LEL mode. (C) Average current density at −120 mV from experiments as in (B) (n = 9 - 11 LELs, mean ± SEM, *** p <0.001). (D) Lysosomal pH in WT and Tmem175 KO hippocampal neurons determined using Oregon Green Dextran (n = 30 - 32 randomly selected images from at least three independent repeats, mean ± SEM, *** p <0.001). (E) Effects of DCPIB (50 μM) on lysosomal pH in Tmem175+/+ and Tmem175−/− hippocampal neurons determined using Oregon Green Dextran (n = 20-21 images, mean ± SEM, NS p > 0.05, *** p <0.001). (F) Lysosomal Cathepsin B activity assayed with Magic Red staining in Tmem175+/+ and Tmem175−/− hippocampal neurons (scale bar = 10 μm, n = 10 - 15, *** p < 0.001). (G) Representative images of phosphorylated α-synuclein puncta in striatal slices collected from Tmem175+/+ and Tmem175−/− mice (scale bar = 100 μm). The boxed regions are shown at higher magnification on the right together with DAPI staining. (H) Summary of puncta area and count of phosphorylated α-synuclein in striatum (n = 6 slices from 3 mice for each group, mean ± SEM, * p < 0.05, ** p < 0.01). (I) A working model for how TMEM175, a lysosomal luminal proton-activated proton release channel, regulates lysosome pH set-point, optimum, and hydrolytic activity. Lysosomal pH is heterogeneous within the range of pH 4.5-5.0 that is required for the optimal hydrolytic activity of lysosomal enzymes. For individual lysosomes, the steady-state luminal pH is determined by the relative rates of V-ATPase-mediated proton influx (which decreases with luminal acidification (Sakai et al., 2006)) vs. TMEM175-mediated proton efflux. For a typical lysosome with a steady-state pH of 4.6 (the set-point), only a small lysosomal proton efflux through TMEM175 is needed to balance out the proton influx produced by the V-ATPase. Because TMEM175 is far from maximally activated at pH 4.6, any stimulus that acidifies the lysosome to below 4.6 causes TMEM175 currents to rapidly increase as if a pH “threshold” has been crossed. Increasing the expression/activity of TMEM175 causes an alkaline shift in the pH set-point and steady-state pH. When the activity of TMEM175 is compromised, as in the TMEM175 knockout cells, lysosomes are over-acidified due to an unopposed proton influx produced by V-ATPase, causing impaired lysosomal hydrolysis, a-synuclein aggregation in the central neurons, and PD-like pathology.

References

    1. Ashcom JD, and Jacobson LA (1989). Self-quenched fluorogenic protein substrates for the detection of cathepsin D and other protease activities. Analytical biochemistry 176, 261–264. - PubMed
    1. Bagriantsev SN, Ang KH, Gallardo-Godoy A, Clark KA, Arkin MR, Renslo AR, and Minor DL Jr. (2013). A high-throughput functional screen identifies small molecule regulators of temperature- and mechano-sensitive K2P channels. ACS chemical biology 8, 1841–1851. - PMC - PubMed
    1. Ballabio A, and Bonifacino JS (2019). Lysosomes as dynamic regulators of cell and organismal homeostasis. Nat Rev Mol Cell Biol. - PubMed
    1. Blauwendraat C, Heilbron K, Vallerga CL, Bandres-Ciga S, von Coelln R, Pihlstrom L, Simon-Sanchez J, Schulte C, Sharma M, Krohn L, et al. (2019). Parkinson’s disease age at onset genome-wide association study: Defining heritability, genetic loci, and alpha-synuclein mechanisms. Movement disorders : official journal of the Movement Disorder Society. - PMC - PubMed
    1. Bonam SR, Wang F, and Muller S (2019). Lysosomes as a therapeutic target. Nat Rev Drug Discov 18, 923–948. - PMC - PubMed

Publication types