. 2022 Jul 11;40(7):768-786.e7.
doi: 10.1016/j.ccell.2022.06.001. Epub 2022 Jun 23.

Genome-wide CRISPR screens of T cell exhaustion identify chromatin remodeling factors that limit T cell persistence

Affiliations

Genome-wide CRISPR screens of T cell exhaustion identify chromatin remodeling factors that limit T cell persistence

Julia A Belk et al. Cancer Cell. .

Abstract

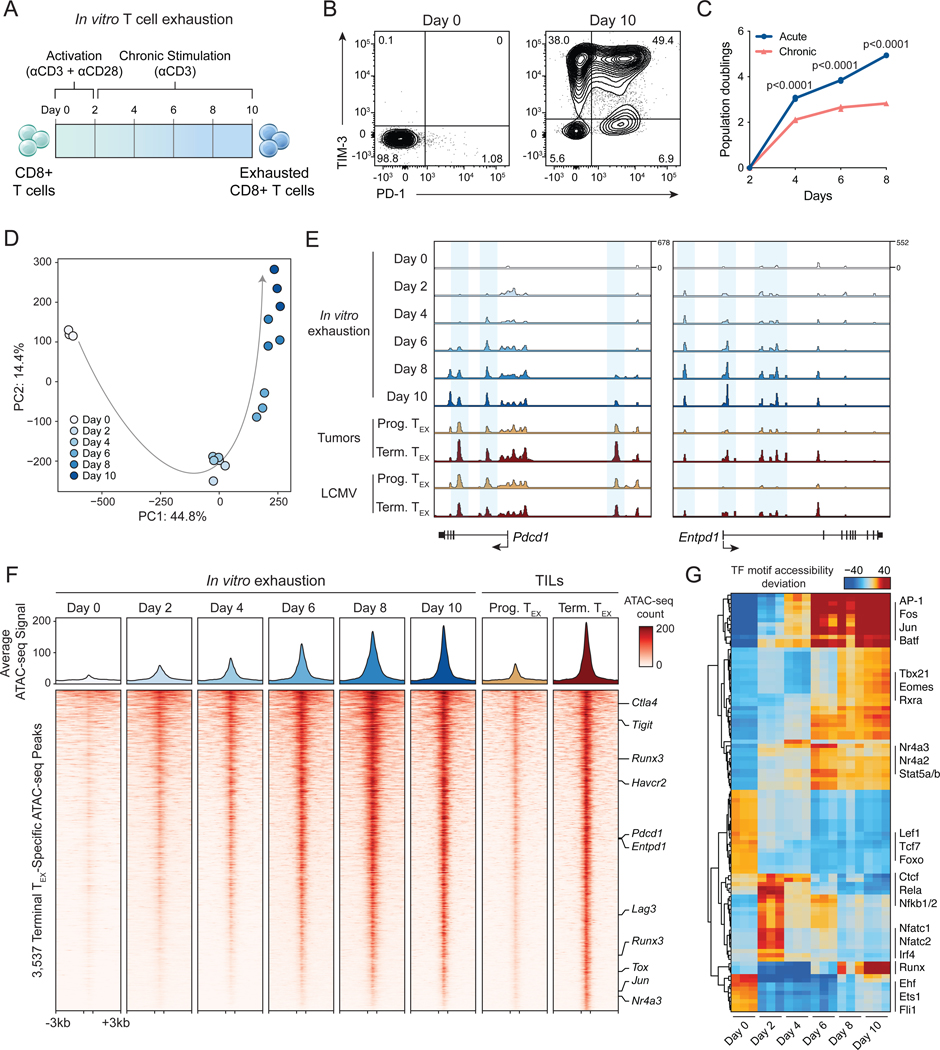
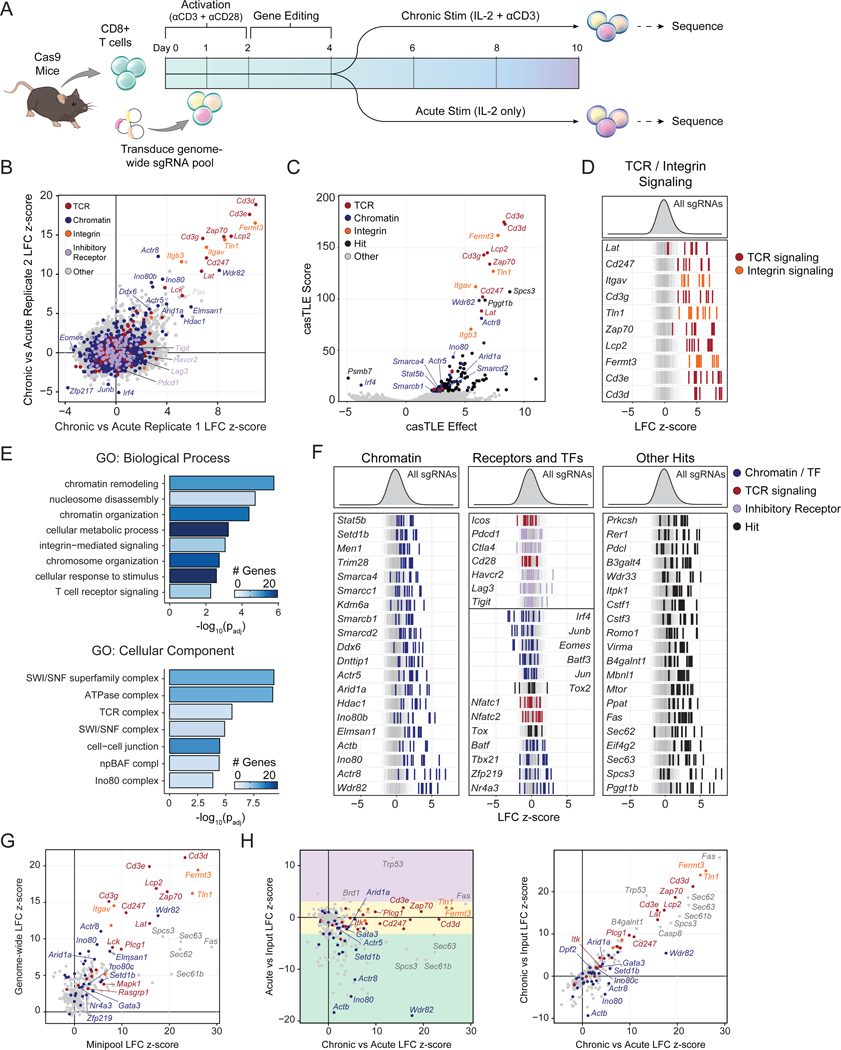
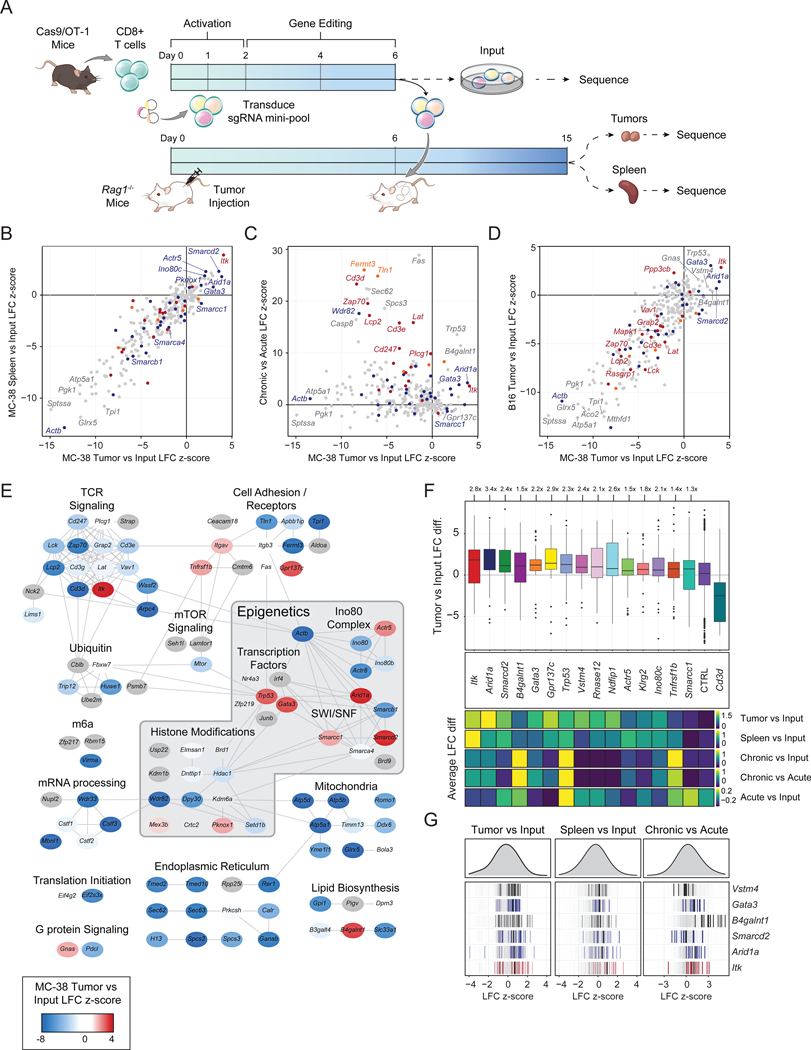
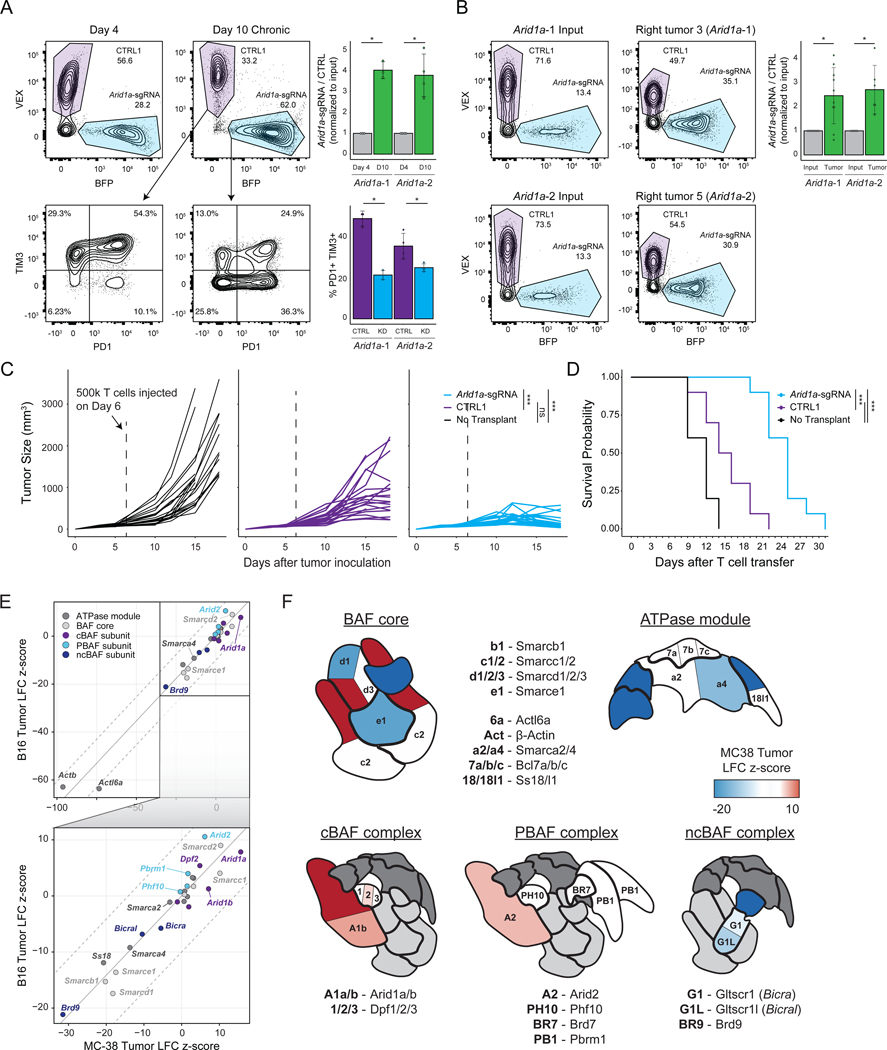
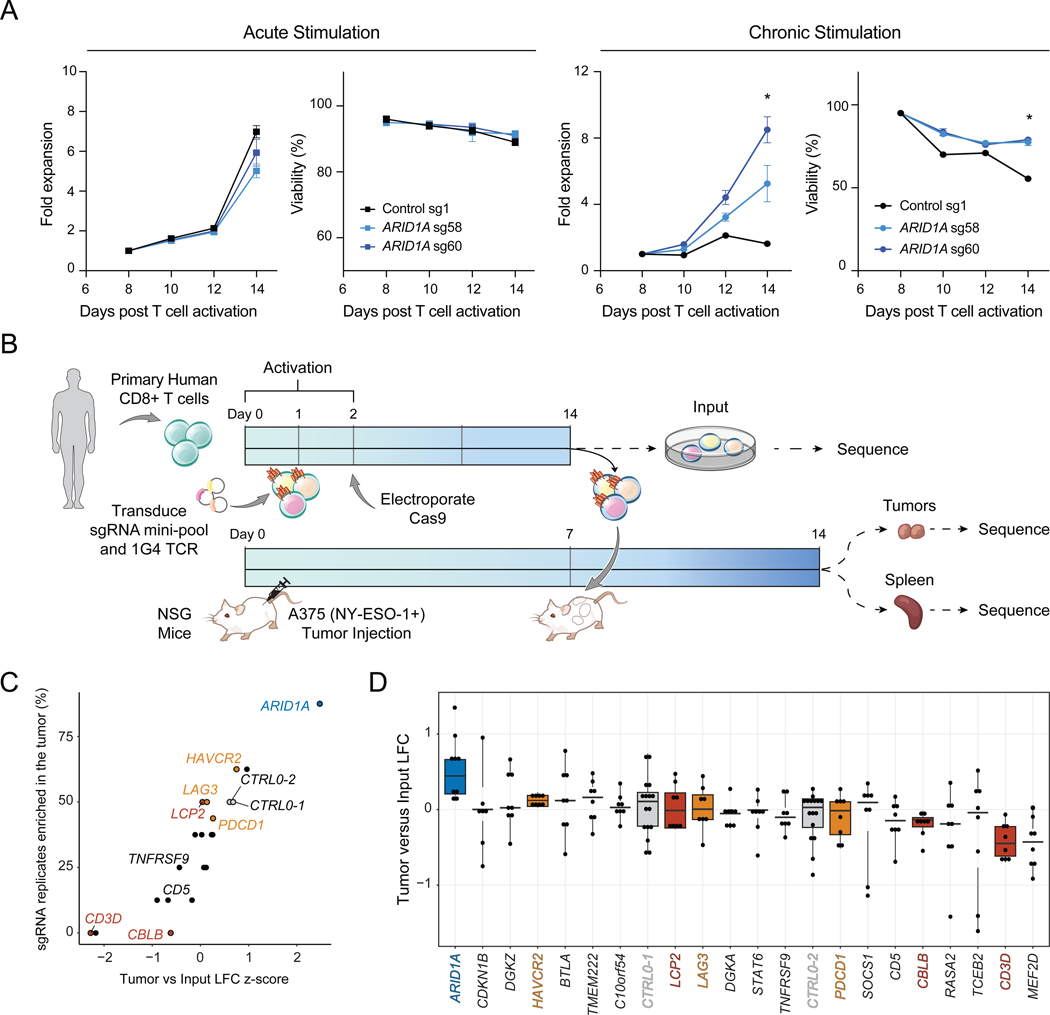
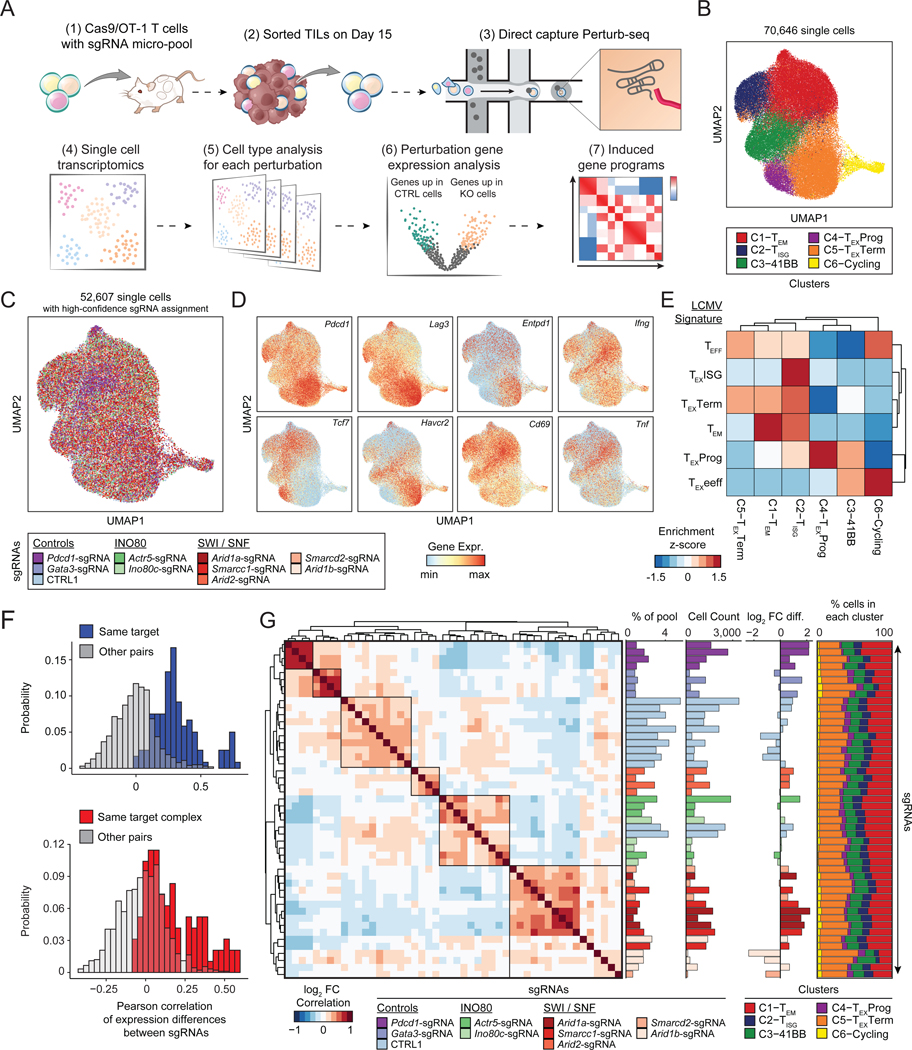
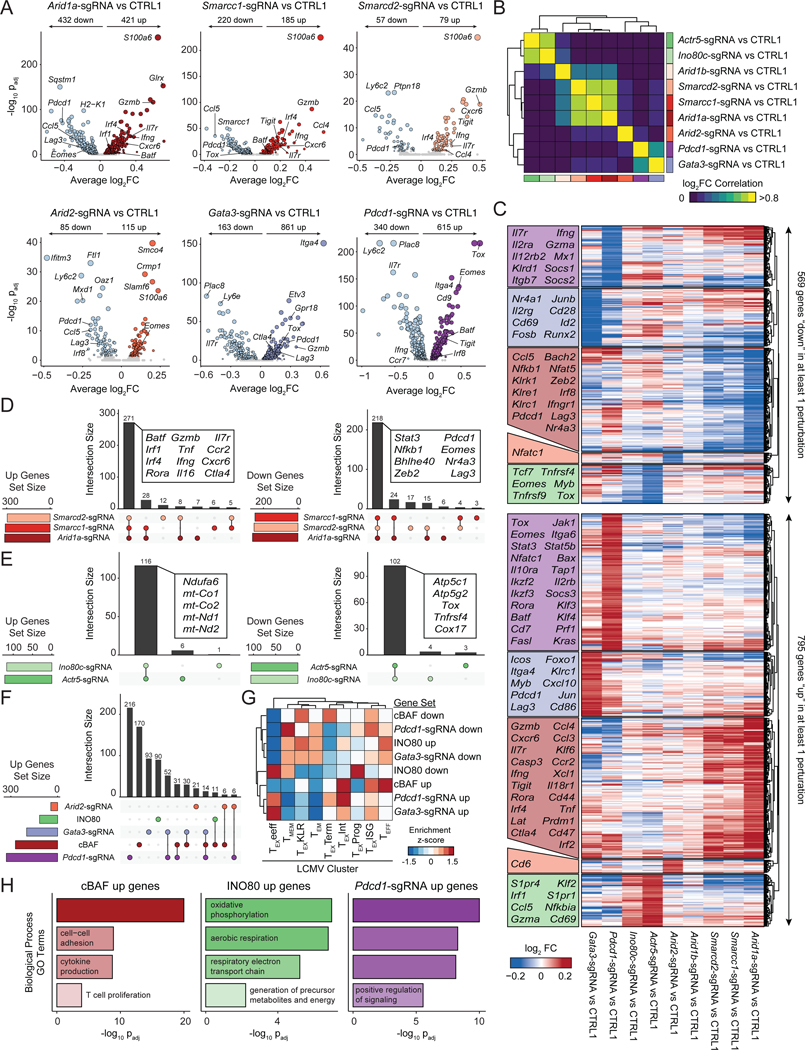
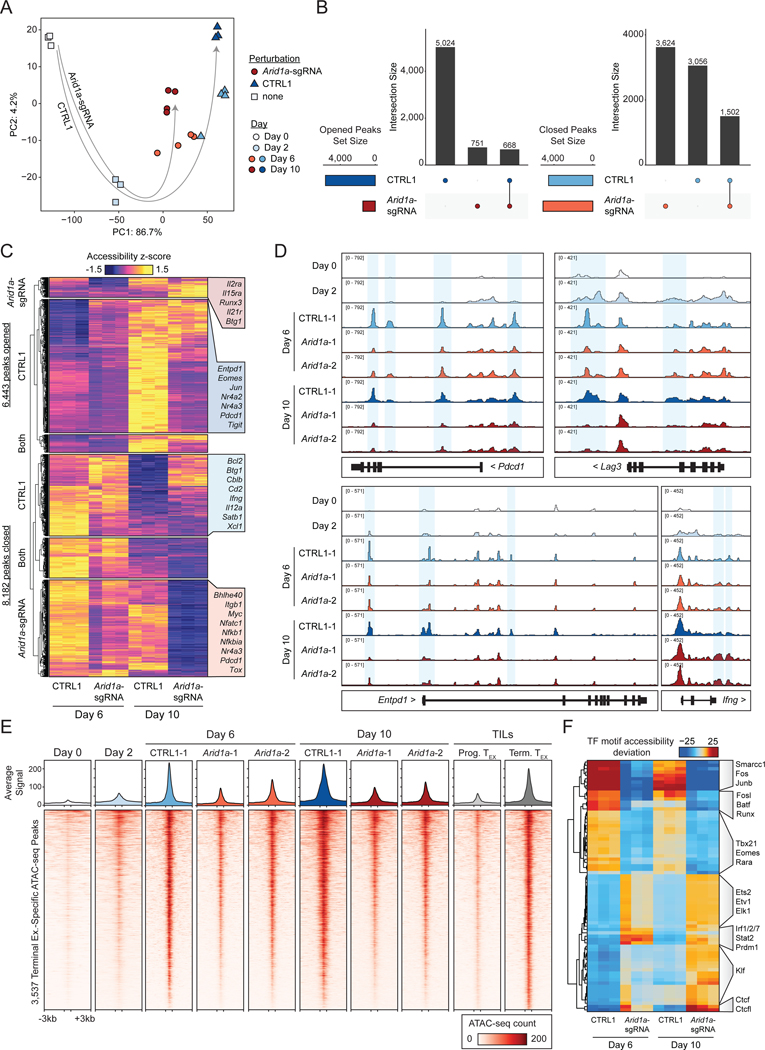
T cell exhaustion limits antitumor immunity, but the molecular determinants of this process remain poorly understood. Using a chronic stimulation assay, we performed genome-wide CRISPR-Cas9 screens to systematically discover regulators of T cell exhaustion, which identified an enrichment of epigenetic factors. In vivo CRISPR screens in murine and human tumor models demonstrated that perturbation of the INO80 and BAF chromatin remodeling complexes improved T cell persistence in tumors. In vivo Perturb-seq revealed distinct transcriptional roles of each complex and that depletion of canonical BAF complex members, including Arid1a, resulted in the maintenance of an effector program and downregulation of exhaustion-related genes in tumor-infiltrating T cells. Finally, Arid1a depletion limited the acquisition of exhaustion-associated chromatin accessibility and led to improved antitumor immunity. In summary, we provide an atlas of the genetic regulators of T cell exhaustion and demonstrate that modulation of epigenetic state can improve T cell responses in cancer immunotherapy.

Keywords: CRISPR; T cell exhaustion; canonical BAF complex; chromatin remodeling; epigenetics; genomics; immunology; in vivo Perturb-seq.


Conflict of interest statement

Declaration of interests A.T.S. is a scientific founder of Immunai and founder of Cartography Biosciences and receives research funding from Arsenal Biosciences, Allogene Therapeutics, and Merck Research Laboratories. J.A.B. is a consultant to Immunai. S.A.V. is an advisor to Immunai. K.E.Y. is a consultant to Cartography Biosciences. C.L.M. is a co-founder of Lyell Immunopharma and Syncopation Life Sciences, and consults for Lyell, Syncopation, NeoImmune Tech, Apricity, Nektar, Immatics, Mammoth, and Ensoma. A.A. is a co-founder of Tango Therapeutics, Azkarra Therapeutics, Ovibio Corporation, and Kytarro; a consultant for SPARC, Bluestar, Pro-Lynx, Earli, Cura, GenVivo, Ambagon, Phoenix Molecular Designs, and GlaxoSmithKline (GSK); a member of the Scientific Advisory Board of Genentech, GLAdiator, Circle and Cambridge Science Corporation; receives research support from SPARC and AstraZeneca; holds patents on the use of poly (ADP-ribose) polymerase (PARP) inhibitors held jointly with AstraZeneca. A.M. is a co-founder of Spotlight Therapeutics, Arsenal Biosciences, and Survey Genomics; a member of the Scientific Advisory Board of NewLimit; owns stock in Arsenal Biosciences, Spotlight Therapeutics, NewLimit, Survey Genomics, PACT Pharma, and Merck; has received fees from 23andMe, PACT Pharma, Juno Therapeutics, Trizell, Vertex, Merck, Amgen, Genentech, AlphaSights, Rupert Case Management, Bernstein, and ALDA; is an investor in and informal advisor to Offline Ventures; and is a client of EPIQ. The Marson lab has received research support from Juno Therapeutics, Epinomics, Sanofi, GSK, Gilead, and Anthem. K.A.F., E.S., J.C., A.A., A.M., and C.L.M. hold patents in the arena of CAR-T cell therapeutics. J.A.B. and A.T.S. have filed a patent related to the contents of this study.

Figures

Figure 1:
Figure 1:. In vitro chronic antigen stimulation assay recapitulates the epigenetic hallmarks of T cell exhaustion.
(A) Diagram of in vitro exhaustion assay. (B) Surface phenotype of CD8+ T cells at day 0 and day 10 of the T cell exhaustion assay, gated on live cells. (C) Expansion of chronically stimulated and acutely stimulated T cells in vitro. Statistical significance was assessed by Student’s t-test, n=3. (D) Principal component analysis of ATAC-seq profiles of CD8+ T cells throughout the course of chronic stimulation, n=3. (E) ATAC-seq signal tracks in the Pdcd1 and Entpd1 gene loci at each time point in the in vitro exhaustion assay, as well as previously published reference ATAC-seq profiles from T cells in tumors or LCMV (Miller et al., 2019). (F) Heatmap showing ATAC-seq coverage of each peak in the “Terminal Exhaustion peak set” for each time point in the in vitro exhaustion assay. Reference data from TILs is also included. Selected nearest genes are indicated on the right. (G) chromVAR motif accessibility heatmap for each ATAC-seq sample. Selected TF motifs are indicated on the right. Top 100 most variable motifs are shown. See also Figure S1.
Figure 2:
Figure 2:. Genome-wide functional interrogation of T cell exhaustion.
(A) Diagram of genome-wide T cell exhaustion screen. (B) Correlation of replicate screens (n=2) with selected functional categories of genes colored as indicated. Gene sets were based on GO Terms and were supplemented with manual annotations. (C) casTLE volcano plot of the Chronic vs Acute stimulation screen comparison, with top hits labeled. (D) Individual sgRNA z-scores for top hits in “integrin signaling” or “TCR signaling” functional categories. (E) GO Term analysis of the top 100 positive hits. (F) Individual sgRNA z-scores for genes in different functional categories: chromatin (left), selected receptors and transcription factors (center), or other (right). In (D) and (F) n=10 sgRNA-replicates per gene are shown. 1,000 randomly selected guides are shown in the background of each row in grey, for visual reference. (G) Correlation of Acute vs Chronic z-scores in the mini-pool versus the genome-wide screen. (H) Correlation of the mini-pool Chronic vs Acute z-scores against Acute vs Input (left) or Chronic vs Input (right). Genes in (G) and (H) are colored by functional category: TCR signaling (red), integrin signaling (orange), chromatin (blue), or other (grey). Colored boxes in (H, left) denote enhanced (purple), similar (yellow), or reduced (green) expansion after acute stimulation. See also Figures S2–5 and Tables S1–3.
Figure 3:
Figure 3:. Targeted in vivo screening identifies subunits of the INO80 and BAF complexes that limit T cell persistence.
(A) Diagram of in vivo pooled CRISPR screening. (B) Correlation of tumor LFC z-scores to spleen LFC z-scores, colored by functional category. (C) Correlation of in vivo z-score and in vitro z-scores for genes in the CRISPR mini-pool. (D) Correlation of in vivo MC-38 and B16 tumor z-scores for genes in the CRISPR mini-pool. (B-D) Results shown are merged from 3 mice per tumor model (n=6 tumors, n=3 spleens). (E) Cytoscape protein-protein interaction network colored by z-score in MC-38 tumors. (F) Top: Boxplot of MC-38 tumor versus input log fold change for each sgRNA targeting the indicated gene, with the mean control log fold change subtracted. Bottom: heatmaps showing the sgRNA average of the indicated in vivo or in vitro screen for the same hits. Box plots show 25th, 50th (median), and 75th percentiles with outliers shown as dots. Each dot represents one sgRNA-replicate, n=36 per target gene. (G) Individual sgRNA-replicate z-scores for six top hits showing the MC-38 Tumor vs Input comparison (left, n=36), MC-38 Spleen vs Input (center, n=18), and in vitro Chronic vs Acute (right, n=12). See also Figure S6 and Tables S2–3.
Figure 4:
Figure 4:. SWI/SNF mini-pool CRISPR screens and functional studies demonstrate that tuning cBAF activity can enhance anti-tumor immunity.
(A) In vitro competition assay of Arid1a-sgRNA versus CTRL1 T cells. Left: cells were mixed on Day 4 at the indicated ratios and passaged in the chronic stimulation assay for 6 days. On Day 10, proliferation relative to CTRL1 T cells and surface phenotype were assessed by flow cytometry, n=3 or 4 as indicated. (B) In vivo competition assay of Arid1a-sgRNA versus CTRL1 T cells. Cells were mixed on Day 6 (input) and then transplanted into tumor bearing mice. On Day 15, relative proliferation in the tumor was assessed by flow cytometry, n=6 or 10 as indicated. (A-B) Error bars denote mean ± SD and significance was assessed by Welch Two Sample t-test. (C) Tumor sizes for each cohort. Statistical significance was assessed at Day 15 by Wilcoxon rank sum exact test, n=20 tumors per group. (D) Survival curves of tumor-bearing mice in each treatment group. Statistical significance was assessed by log-rank test, n=10 mice per group. (E) Correlation of SWI/SNF CRISPR mini-pool tumor enrichments in MC-38 versus B16 tumor models. Results shown are merged from 4 mice for MC-38 (n=8 tumors, n=4 spleens) or 2 mice for B16 tumors (n=4 tumors, n=2 spleens). (F) Cartoons of the three BAF complexes colored by z-score from SWI/SNF CRISPR mini-pool experiments in MC-38 tumors. BAF complex cartoons adapted from (Mashtalir et al., 2018). * p < 0.05, *** p < 0.001. See also Figure S6 and Table S4.
Figure 5:
Figure 5:. Conserved function of ARID1A in human T cells in vitro and in vivo.
(A) Proliferation and viability of primary human T cells after electroporation of the indicated RNP. Left: Acutely stimulated T cells. Right: Chronically stimulated T cells using anti-CD3-coated plates. Data shown is representative of 3 independent experiments and 3 donors. Error bars denote mean ± SD and significance was assessed by Student’s t-test, n=2 replicates per sgRNA. (B) Schematic of CRISPR mini-pool screen in primary human CD8+ T cells transduced with the NY-ESO-1-specific TCR, 1G4. (C) Results of the human CRISPR mini-pool screen aggregated by gene. (D) Results of the human CRISPR mini-pool screen with individual sgRNA replicates shown as dots. Genes are ordered from highest to lowest average LFC. Box plots show 25th, 50th (median), and 75th percentiles. Results shown in (C-D) are combined from 2 independent donors, 2 mice per donor, and 2 sgRNAs per target gene (n=8 sgRNA replicates per target). In (C-D), orange indicates inhibitory receptors, red indicates TCR signaling pathway genes, blue indicates chromatin remodelers and grey indicates negative controls. See also Table S5.
Figure 6:
Figure 6:. In vivo Perturb-seq reveals distinct transcriptional roles of the cBAF and INO80 complexes in TILs.
(A) Diagram of direct-capture Perturb-seq of sorted TILs. (B) scRNA-seq profiles of TILs colored by cluster assignment. (C) scRNA-seq profiles of cells colored by the perturbation detected in each cell. Cells where no guide, or multiple guides, were detected are shown in grey. (D) Expression of selected marker genes in each single cell. (E) Analysis of LCMV signature gene sets for each cluster. Gene set enrichment scores were calculated for each single cell, cell values were averaged by cluster and z-scored. (F) Histogram of Pearson correlation of gene expression differences of pairs of sgRNAs. Top: Pairs targeting the same gene are shown in blue (n=120), other pairs are shown in gray (n=1,008). Bottom: Pairs targeting the same protein complex are shown in red (n=96), other pairs are shown in gray (n=912). Complexes considered in the analysis are cBAF (Arid1a, Arid1b, Smarcd2, and Smarcc1) and INO80 (Ino80c and Actr5) and pairs of sgRNAs that target the same gene are excluded. (G) Left: Heatmap of the correlation of gene expression differences of each pair of sgRNAs. Center (from left to right): Representation of each sgRNA in the pre-transplant sample, cell count of each sgRNA in the Perturb-seq dataset, and estimated fold change of each sgRNA relative to controls. Right: Proportion of cells in each cluster for each sgRNA. See also Figure S7.
Figure 7:
Figure 7:. cBAF-depleted T cells exhibit enhanced effector gene signatures and reduced terminal exhaustion.
(A) Volcano plots comparing aggregated cells with the indicated perturbation versus CTRL1 cells. FDR values were calculated via Wilcoxon Rank Sum test, as implemented in Seurat. Sample size: n=4,668 (Arid1a-sgRNA), n=5,891 (Smarcc1-sgRNA), n=1,448 (Smarcd2-sgRNA), n=3,712 (Arid2-sgRNA), n=2,625 (Gata3-sgRNA), n=6,465 (Pdcd1-sgRNA), n=18,569 (CTRL1). (B) Pairwise correlations of gene expression differences induced by each perturbation. (C) Heatmap of all upregulated (up) or downregulated (down) genes in at least one perturbation, grouped by which perturbation has the strongest effect on expression. Selected genes in each block are labeled. (D) Comparison of upregulated or downregulated gene sets by perturbation of cBAF subunits, Arid1a, Smarcd2, or Smarcc1. (E) Comparison of gene sets up- or downregulated by perturbation of INO80 subunits Actr5, or Ino80c. (F) Comparison of gene sets upregulated by perturbation of cBAF subunits, INO80 subunits, or Pdcd1, Gata3, or Arid2. (G) Enrichments of upregulated and downregulated gene sets in LCMV expression data (Daniel et al., 2021). Module scores of each gene set were computed for each single cell in the LCMV dataset, averaged by cluster, and then z-scored to obtain the indicated enrichment z-scores. (H) Selected GO Terms of indicated gene sets. See also Figure S8 and Table S7.
Figure 8:
Figure 8:. Arid1a is required for the acquisition of the exhausted T cell chromatin state.
(A) Principal component analysis of ATAC-seq profiles of Arid1a-sgRNA and CTRL1 cells in the in vitro exhaustion competition assay (n=3 or 4 as indicated). Unperturbed naïve and activated samples (Day 0 and 2) are included for reference (n=3). (B) Comparison of ‘opened’ and ‘closed’ ATAC-seq peak sets from Day 6 to Day 10 for each genotype. (C) Visualization of ‘opened’ and ‘closed’ ATAC-seq peak sets, with selected nearest genes labeled. (D) ATAC-seq signal tracks of selected gene loci. Representative replicates are shown for each condition. (E) Heatmap showing ATAC-seq coverage of each peak in the “Terminal Exhaustion peak set” for Arid1a-sgRNA and CTRL1 cells at Day 6 and Day 10 in the in vitro exhaustion assay. Reference data from TILs is also included, as well as reference naïve and activated cell profiles. (F) chromVAR motif accessibility heatmap for Arid1a-sgRNA and CTRL1 ATAC-seq samples. Selected motifs are indicated on the right. Top 100 most variable motifs are shown. See also Figure S8.

Comment in

References

    1. Adamson B, Norman TM, Jost M, Cho MY, Nuñez JK, Chen Y, Villalta JE, Gilbert LA, Horlbeck MA, Hein MY, Pak RA, Gray AN, Gross CA, Dixit A, Parnas O, Regev A, Weissman JS, 2016. A Multiplexed Single-Cell CRISPR Screening Platform Enables Systematic Dissection of the Unfolded Protein Response. Cell 167, 1867–1882.e21. 10.1016/j.cell.2016.11.048 - DOI - PMC - PubMed
    1. Alfei F, Kanev K, Hofmann M, Wu M, Ghoneim HE, Roelli P, Utzschneider DT, von Hoesslin M, Cullen JG, Fan Y, Eisenberg V, Wohlleber D, Steiger K, Merkler D, Delorenzi M, Knolle PA, Cohen CJ, Thimme R, Youngblood B, Zehn D, 2019. TOX reinforces the phenotype and longevity of exhausted T cells in chronic viral infection. Nature 571, 265–269. 10.1038/s41586-019-1326-9 - DOI - PubMed
    1. Ataide MA, Komander K, Knöpper K, Peters AE, Wu H, Eickhoff S, Gogishvili T, Weber J, Grafen A, Kallies A, Garbi N, Einsele H, Hudecek M, Gasteiger G, Hölzel M, Vaeth M, Kastenmüller W, 2020. BATF3 programs CD8+ T cell memory. Nat Immunol 21, 1397–1407. 10.1038/s41590-020-0786-2 - DOI - PubMed
    1. Barber DL, Wherry EJ, Masopust D, Zhu B, Allison JP, Sharpe AH, Freeman GJ, Ahmed R, 2006. Restoring function in exhausted CD8 T cells during chronic viral infection. Nature 439, 682–687. 10.1038/nature04444 - DOI - PubMed
    1. Belk JA, Daniel B, Satpathy AT, 2022. Epigenetic regulation of T cell exhaustion. Nat Immunol 1–13. 10.1038/s41590-022-01224-z - DOI - PMC - PubMed

Publication types